Alboran Sea Bathymetric Features

Additional images from a Google search.


09_f01.png
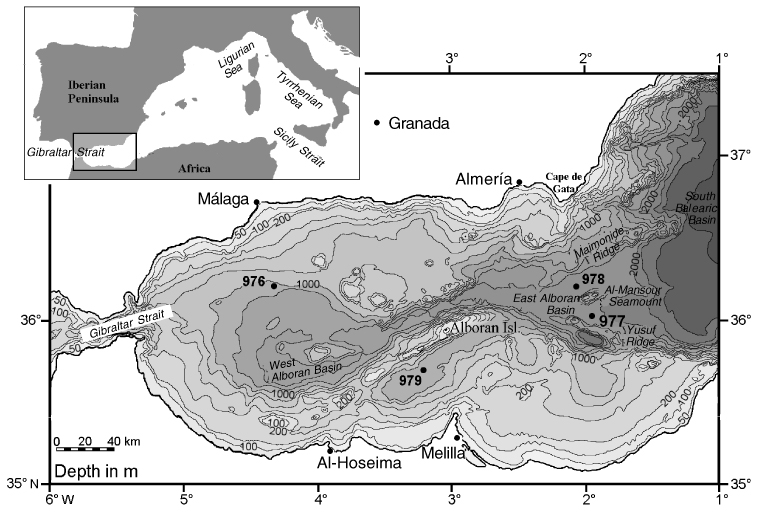
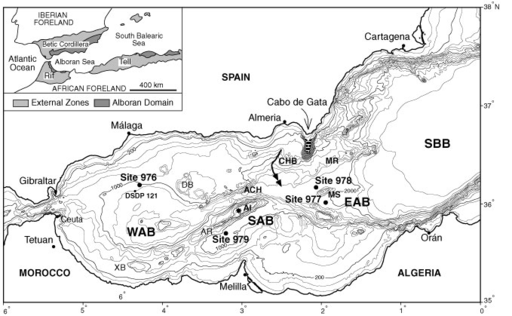
Bathymetric map of the Alboran Sea showing the location of Leg 161 sites and the proposed source area for the carbonate debris-flow bed. Note the location of the Holocene temperate-carbonate platform (black squares) and the fringing talus (stippled) at the offshore prolongation of Cabo de Gata. The two-arrowed line marks the path of the Andarax Canyon turbidite system. Bathymetric contour lines are every 200 m. ACH = Alboran Channel, AI = Alboran Island, AR = Alboran Ridge, CHB = Chella Bank, DB = Djibouti Bank, EAB = Eastern Alboran Basin, MR = Maimonides Ridge, MS = Al-Mansour Seamount, SAB = South Alboran Basin, SBB = South Balearic Basin, WAB = West Alboran Basin, and XB = Xauen Bank. The inset map shows the location of the Alboran Sea between the Betic and Rif Cordilleras, and general tectonic subdivisions.

Image credit: Braga, J.C., and M.C. Comas, 1999. Environmental significance of an uppermost Pliocene carbonate debris flow at Site 978. In Zahn, R., Comas, M.C., and Klaus, A. (Eds.), Proc. ODP, Sci. Results, 161: College Station, TX (Ocean Drilling Program), 77–81. doi:10.2973/odp.proc.sr.161.209.1999

73_f01.png
Bathymetric map of the Alboran Basin and location of Site 977 and other sites of Leg 161.

Image credit: Hauschildt, M., J. Rinna, and J. Rullkötter, 1999. Molecular indicators of the supply of marine and terrigenous organic matter to a Pleistocene organic-matter–rich layer in the Alboran Basin (Western Mediterranean Sea). In Zahn, R., Comas, M.C., and Klaus, A. (Eds.), Proc. ODP, Sci. Results, 161: College Station, TX (Ocean Drilling Program), 391–400. doi:10.2973/odp.proc.sr.161.273.1999

calypso_lg_and_sm_topo_2019_cubehelix_lim2000_test.png
Bathymetry of the Alboran Sea using the MATLAB CubeHelix colormap with a 2000 m depth limit. A PowerPoint slide with the features labeled is also available.

Image credit: MSEAS

Alboran-gyre-with-the-anticyclonics-Western-Alboran-Gyre-and-the-Eastern-Alboran-Gyre.png
Alboran gyre, with the anticyclonics Western Alboran Gyre and the Eastern Alboran Gyre (WAG, EAG). The grey area shows the major phytoplankton productivity area. Source: Hauschildt et al. (1999), modified by Minas et al. (1984).

Image credit: Báez, J.C., 2015. Alboran Sea: Status of open seas fisheries. UNEP-MAP-RAC/SPA.

367_2010_212_Fig3_HTML.png
Coloured shaded-relief bathymetric mosaic of the central Alboran Sea. Thick black lines TOPAS profiles presented in Figs. 6, 7, 8 and 9 (see reference below), white circles ODP Leg 161 sites. Bathymetry contours (GEBCO 97, IOC-IHO) are in metres, contour interval 200 m, UTM projection, units in kilometres (WGS 84 ellipsoid) A. Is Alboran Island

Image credit: Martínez-García, P., J.I. Soto, and M. Comas, 2011. Recent structures in the Alboran Ridge and Yusuf fault zones based on swath bathymetry and sub-bottom profiling: Evidence of active tectonics. Geo-Marine Letters 31(1):19–36. doi:10.1007/s00367-010-0212-0

Main-physiographic-domains-in-the-Alboran-Sea-modified-from-Vazquez-2001-with-the.png
Main physiographic domains in the Alboran Sea (modified from Vázquez 2001), with the study area (rectangle) in the vicinity of the Motril Marginal Plateau (Djibouti Plateau) along the northern continental slope. The bathymetric contours (in m) were extracted from GEBCO (General Bathymetry Chart of the Oceans). 1 Avempace Seamount, 2 Herradura Seamount, 3 Herradura Spur, 4 Djibouti Ville Seamount (Al Idrisi Seamount).

Image credit: Palomino, D., J.-T. Vázquez, G. Ercilla, B. Alonso, N. López-González, and V. Díaz-del-Río, 2011. Interaction between seabed morphology and water masses around the seamounts on the Motril Marginal Plateau (Alboran Sea, Western Mediterranean). Geo-Marine Letters 31(5–6):465–479. doi:10.1007/s00367-011-0246-y

Slope-map-in-degrees-around-the-seamounts-on-the-Motril-Marginal-Plateau.png
Slope map (in degrees) around the seamounts on the Motril Marginal Plateau.

Image credit: Palomino, D., J.-T. Vázquez, G. Ercilla, B. Alonso, N. López-González, and V. Díaz-del-Río, 2011. Interaction between seabed morphology and water masses around the seamounts on the Motril Marginal Plateau (Alboran Sea, Western Mediterranean). Geo-Marine Letters 31(5–6):465–479. doi:10.1007/s00367-011-0246-y

The-3D-diagram-of-Alboran-Basin-compiled-from-multi-beam-data-This-diagram-images-the.png
The 3D diagram of Alboran Basin compiled from multi-beam data. This diagram images the northeast and northwest structures in the center of the basin. A = Almerıá Canyon; AA = Abra Anticline; AL = Alboran Ridge; C = Chella Bank; DJ = Djibouti Bank; E = East Alboran Sub-Basin; F = Fault traces; G = Graben; L = Slide scar; M = Motril Anticline; S = South Alboran Sub-Basin; SC = Serrata-Carboneras Fault; T = Alboran Channel; W = West Alboran Sub-Basin.

Image credit: Ballesteros, M., J. Rivera, A. Muñoz, A. Muñoz-Martín, J. Acosta, A. Carbó, and E. Uchupi, 2008. Alboran Basin, southern Spain—Part II: Neogene tectonic implications for the orogenic float model. Marine and Petroleum Geology 25(1):75–101. doi:10.1016/j.marpetgeo.2007.05.004