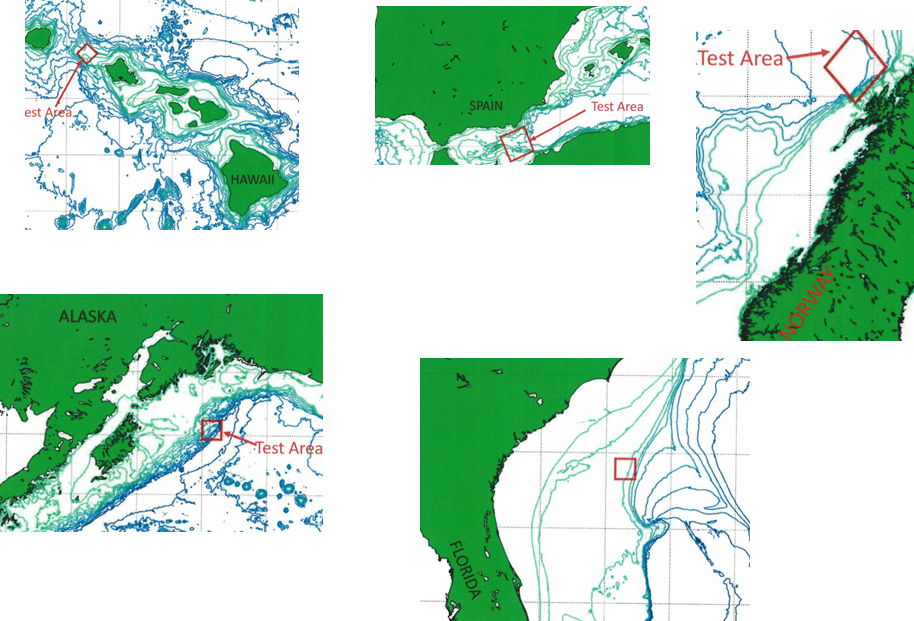
Detection Rate Improvements Through Understanding and Modeling Ocean Variability: S-DUCT

MIT-MSEAS Modeling and Data Products for Phase II

P.F.J. Lermusiaux, P.J. Haley,
C. Mirabito, W.H. Ali
Massachusetts Institute of Technology
Center for Ocean Engineering
Mechanical Engineering
Cambridge, Massachusetts

P. Abbot, C. Emerson
OASIS, Inc.

C.-S. Chiu
Naval Postgraduate School
Presentations
Model output
Comparison with data
Data and Simulations Inputs

S-DUCT Project Main Research Page | This research is sponsored by NAVAIR.


This page contains a listing of all the data processed by MIT-MSEAS that will be used either as simulation inputs, or for data assimilation, or for comparison with MIT-MSEAS simulation results, for each of the five prospective modeling domains and periods. The listing begins with plots of the bathymetry and model domain for the Norway region. This is followed by summary plots that show where and when all profile-based data are available. This is followed by a list of links to plots showing the data available for each data type/source. Finally, MSEAS-processed atmospheric forcing fluxes (used as simulation input) from the Climate Forecast System (CFS) 0.2° model of the National Centers for Environmental Prediction (NCEP) are shown. MIT-MSEAS simulation results, along with a comparison of MIT-MSEAS simulations to the data shown below, are forthcoming.


Data and Simulation Inputs utilized/processed:

Bathymetry and Model Domain (Norway)

Synoptic Data

PE Forcing

Top of page