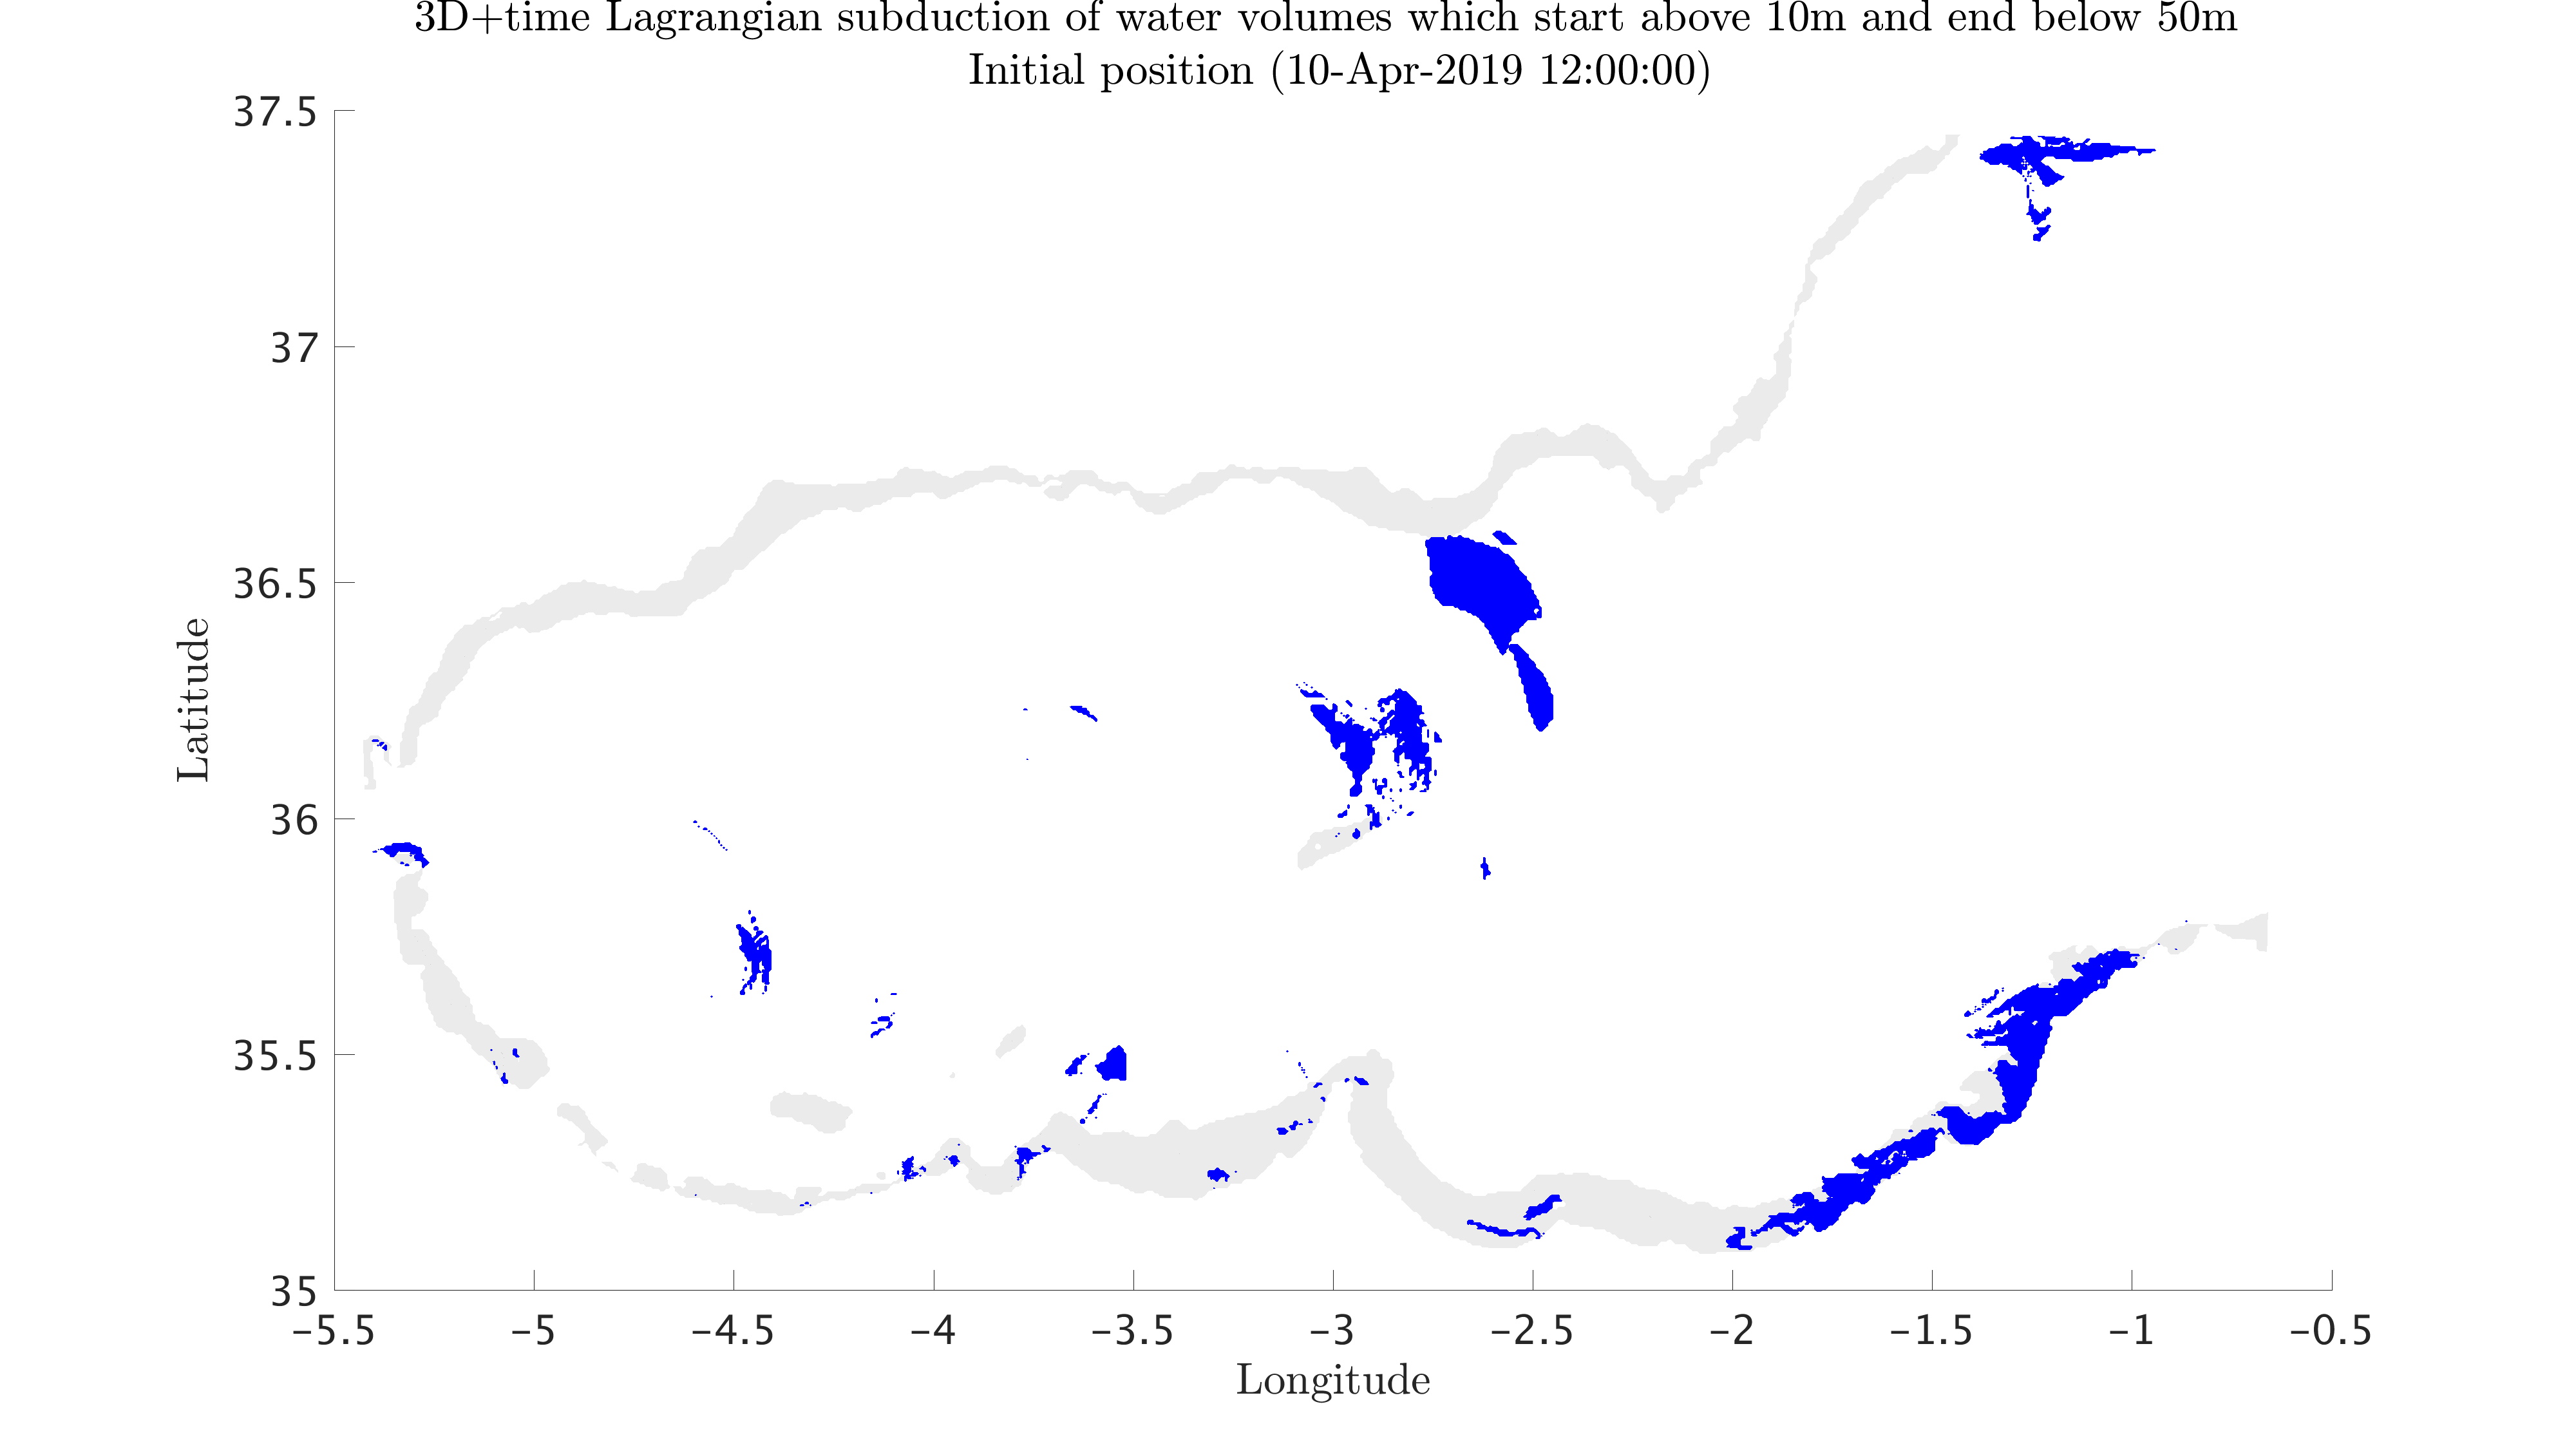
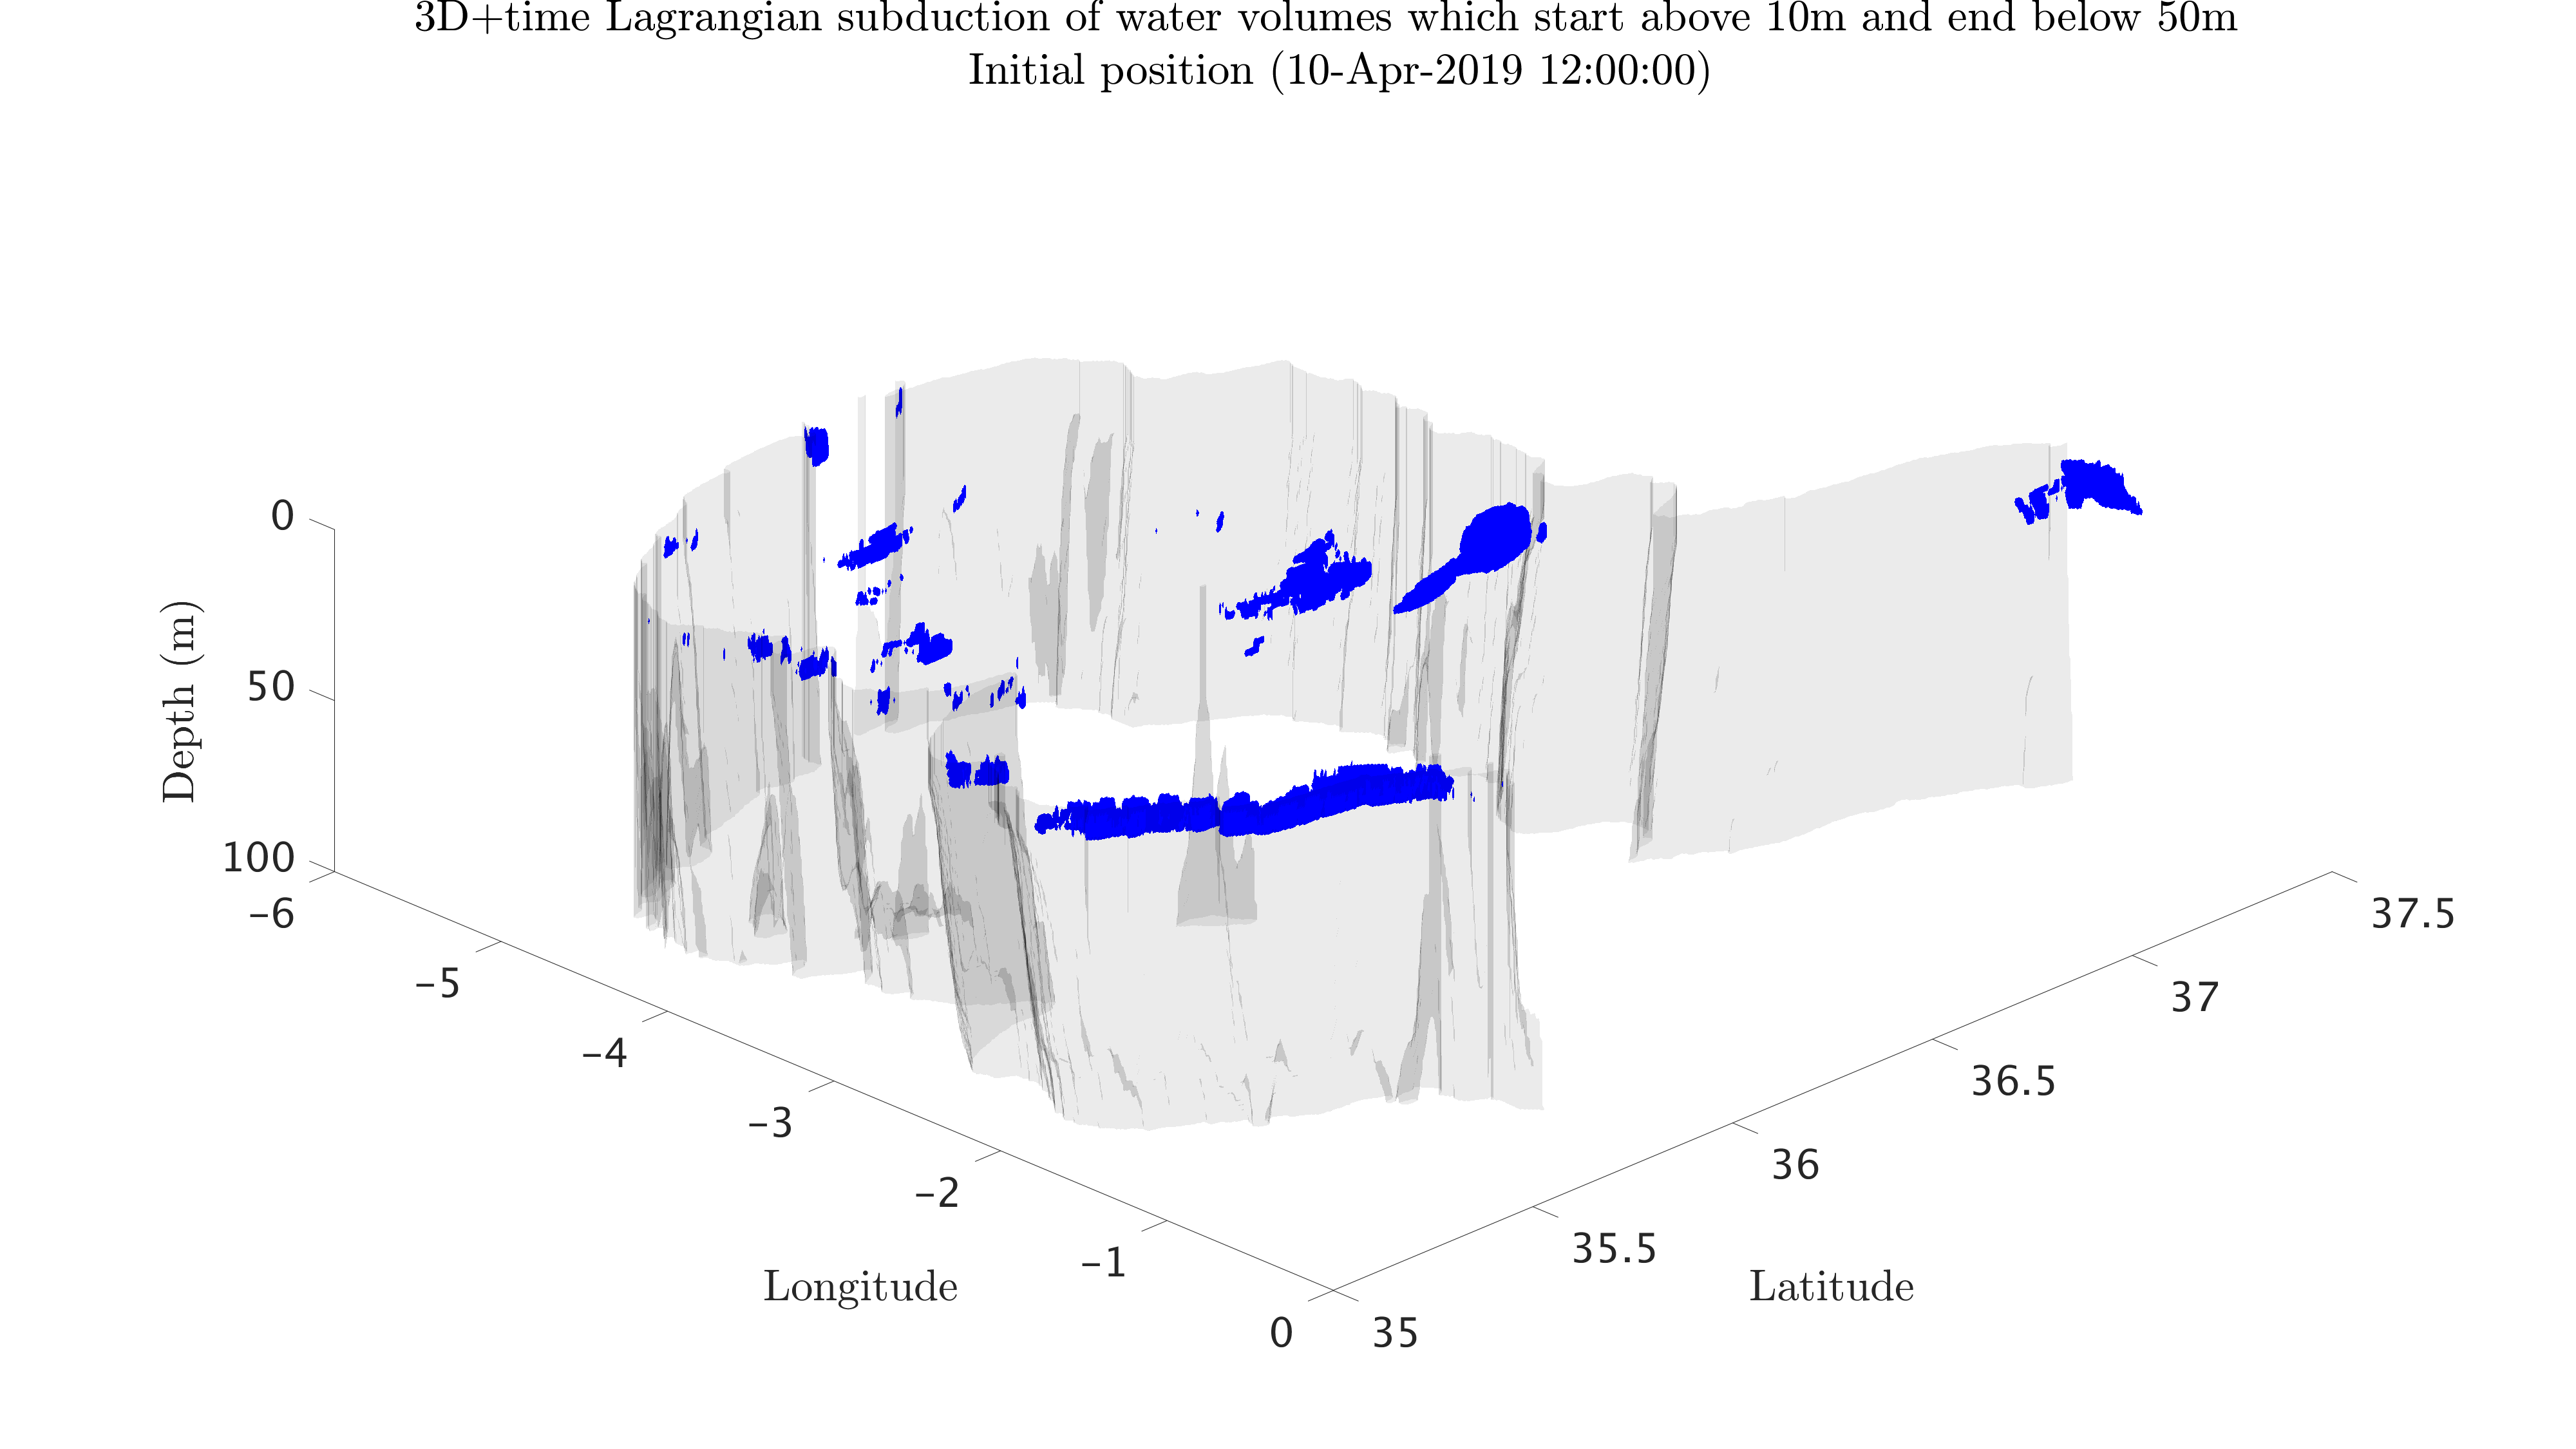
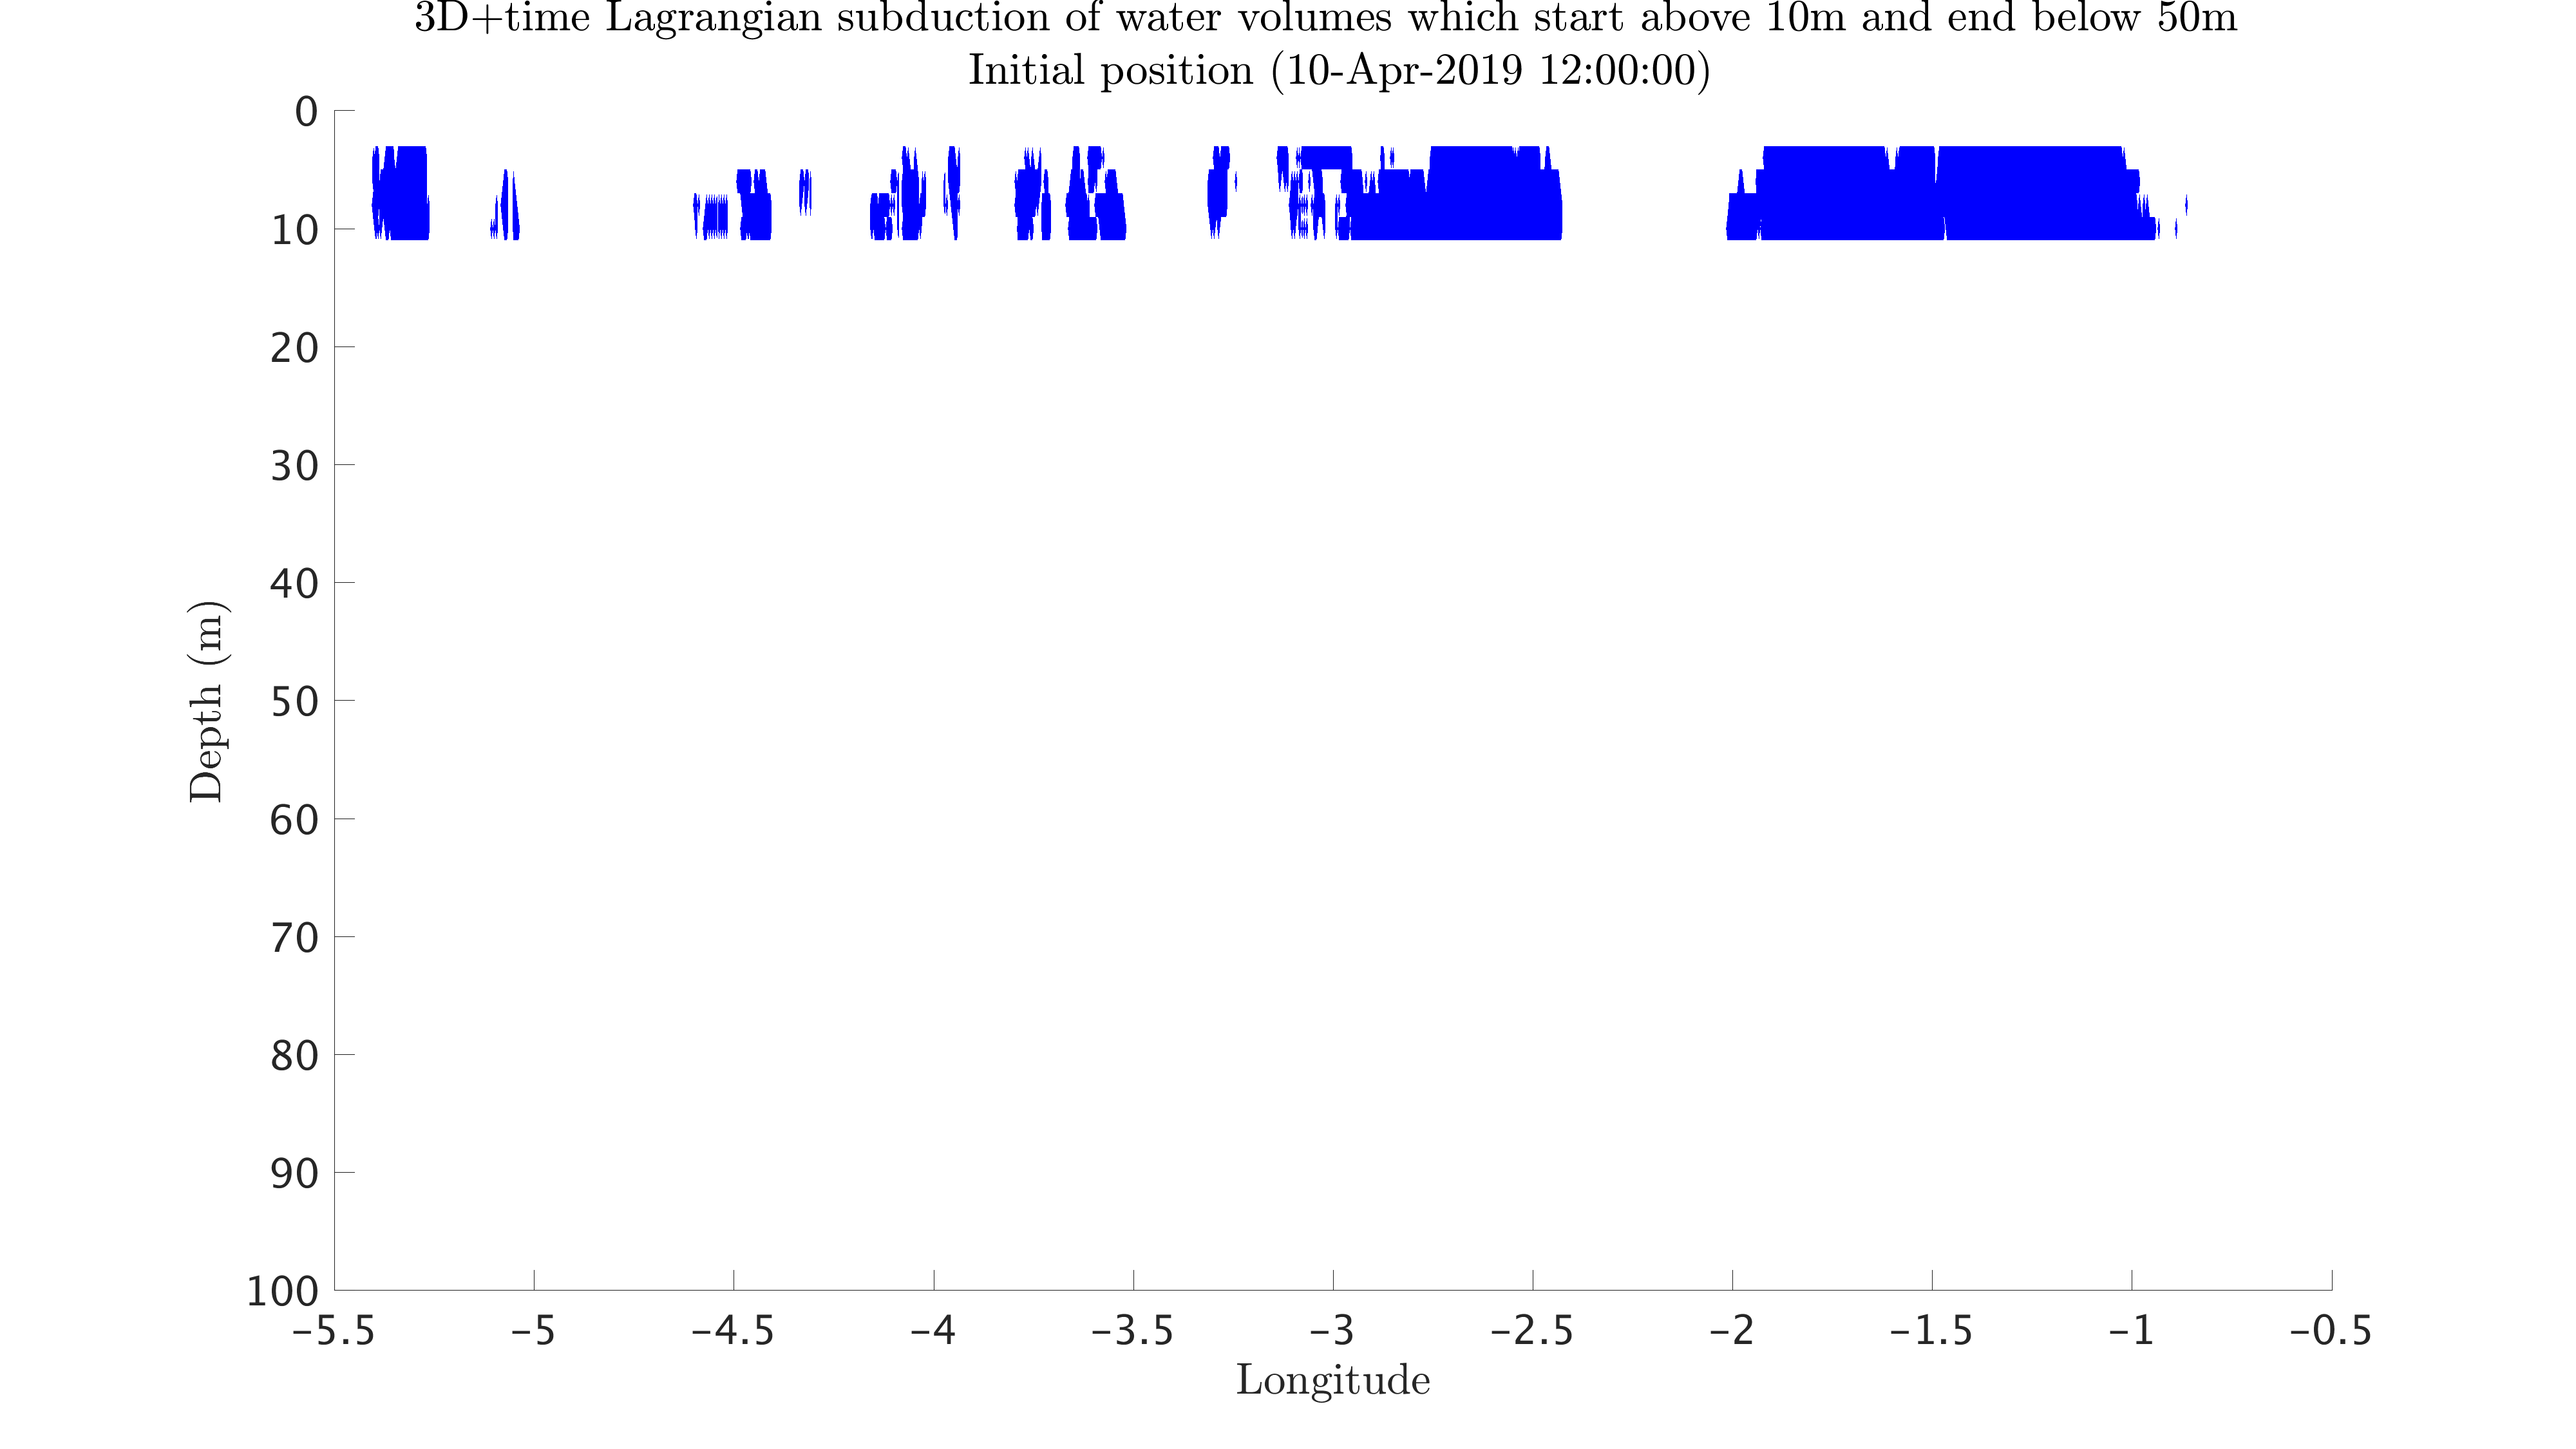
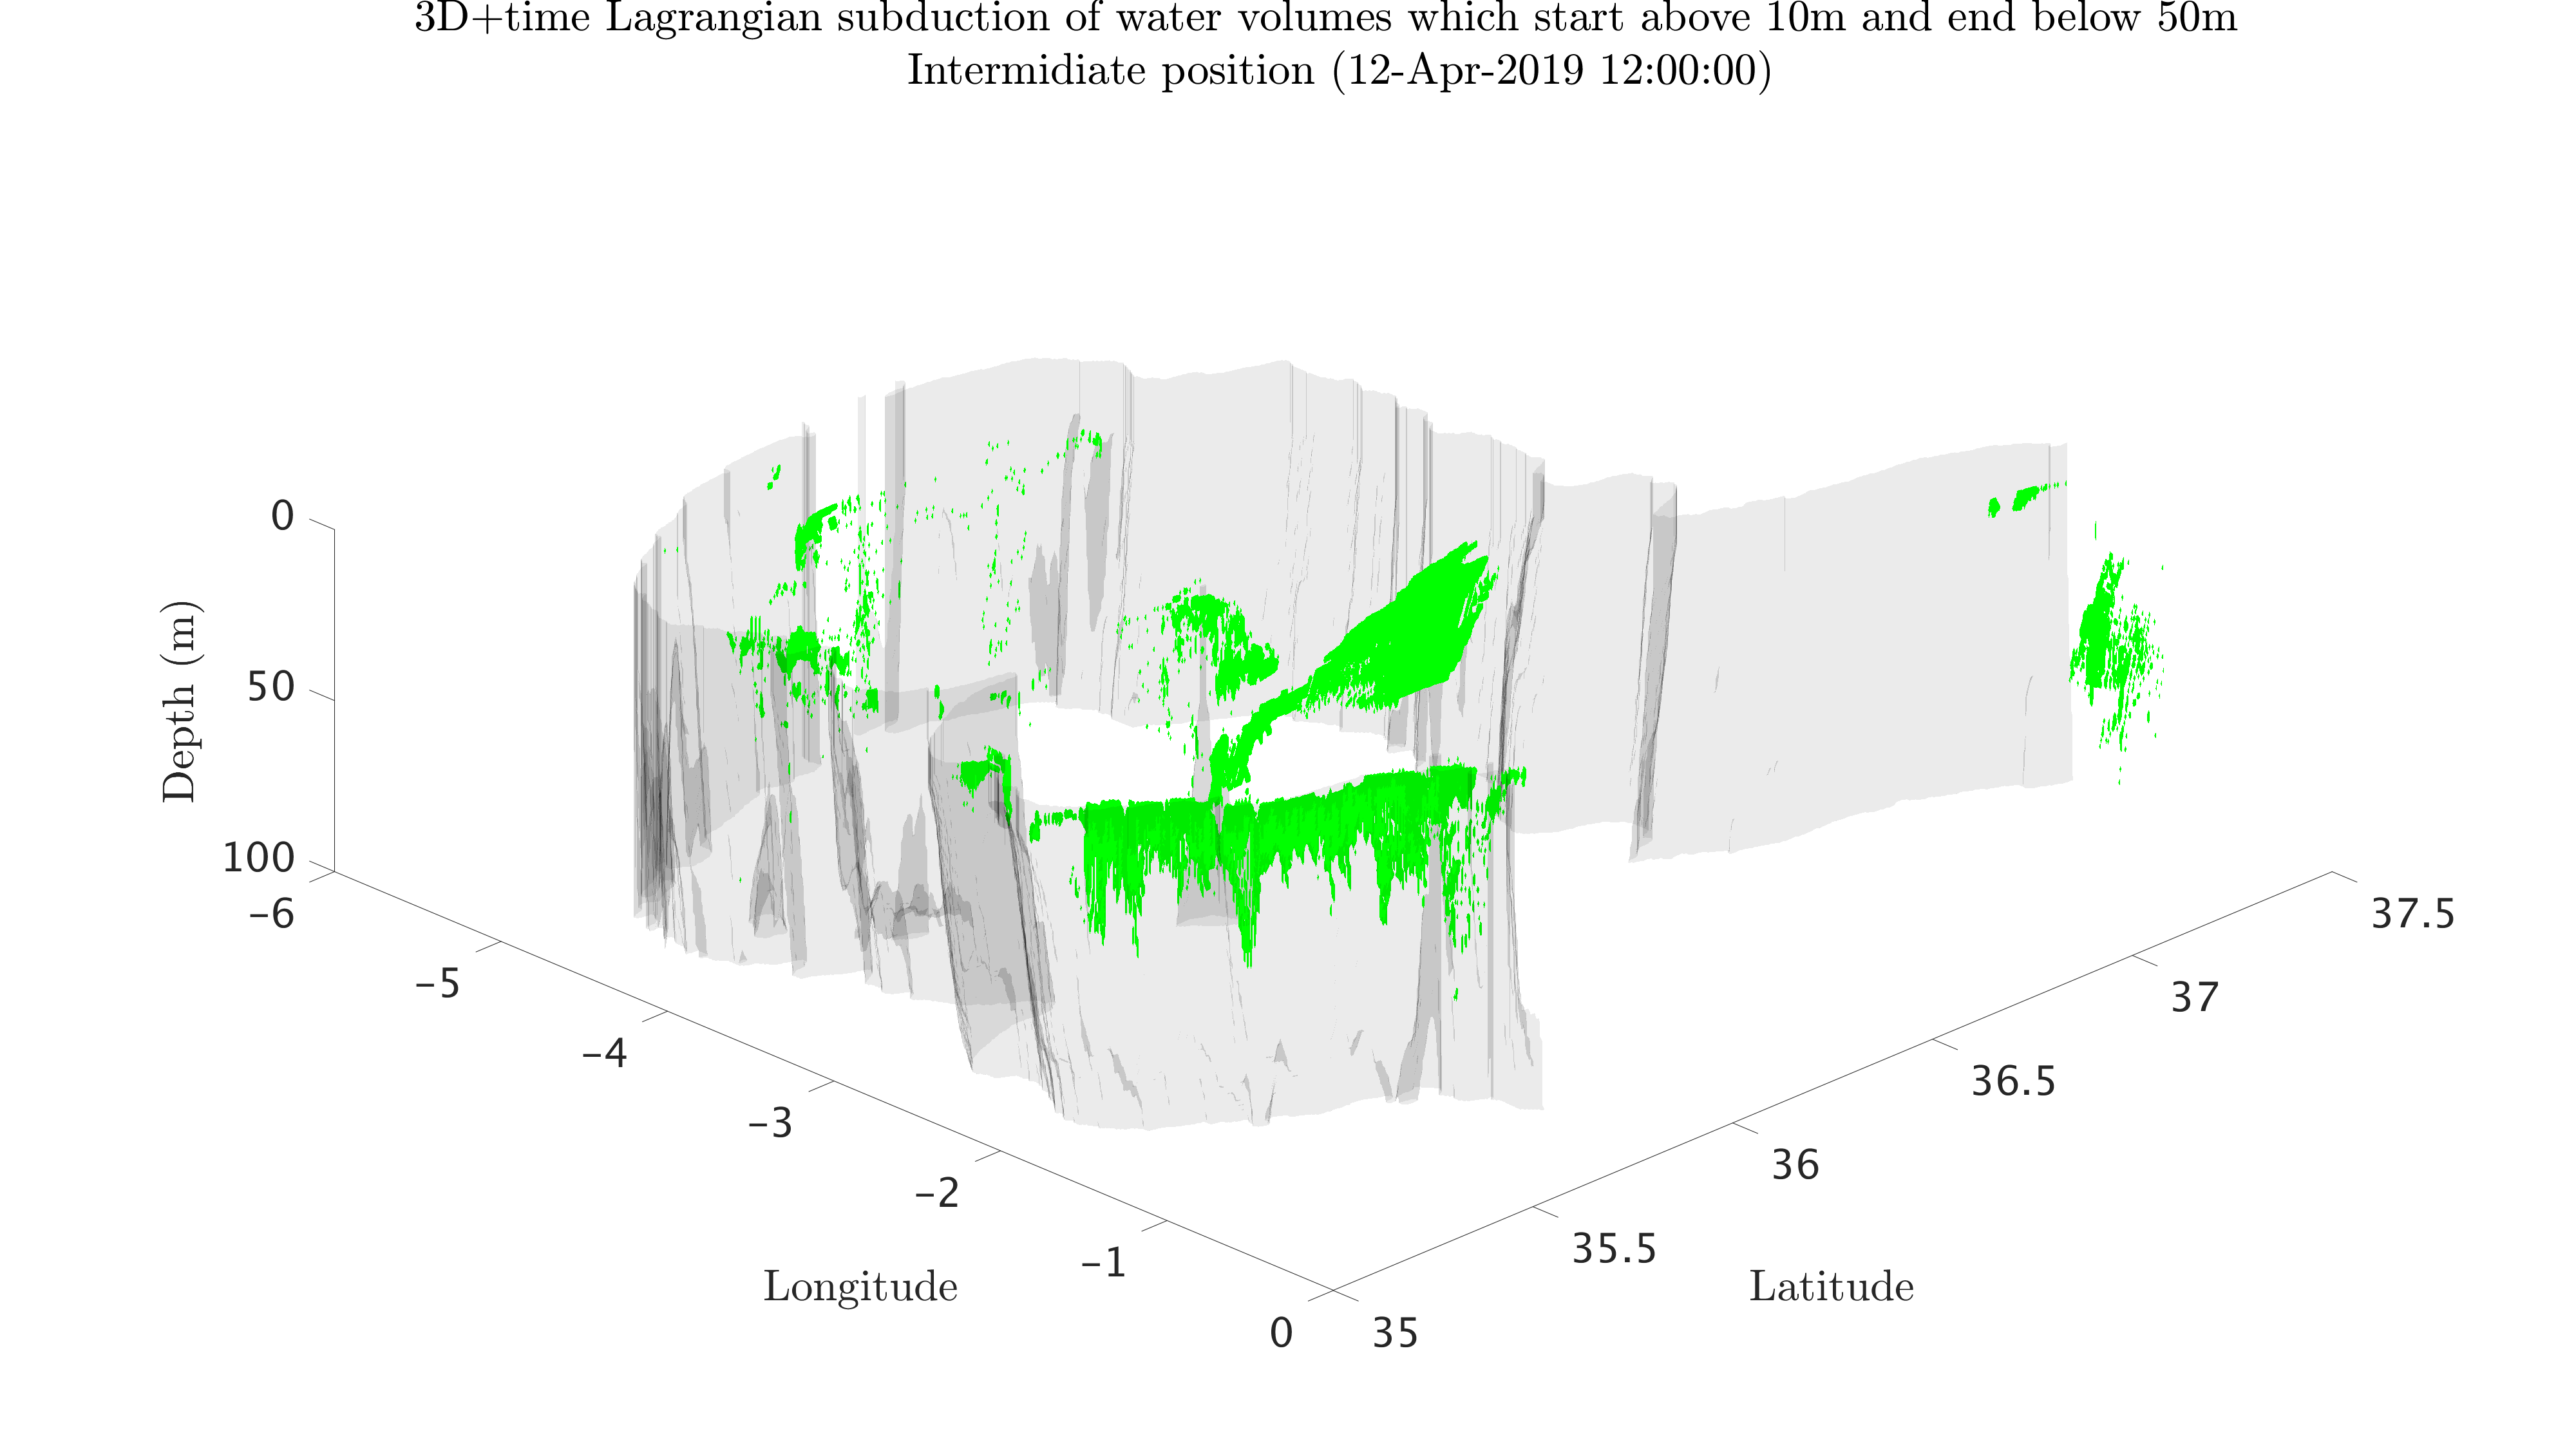
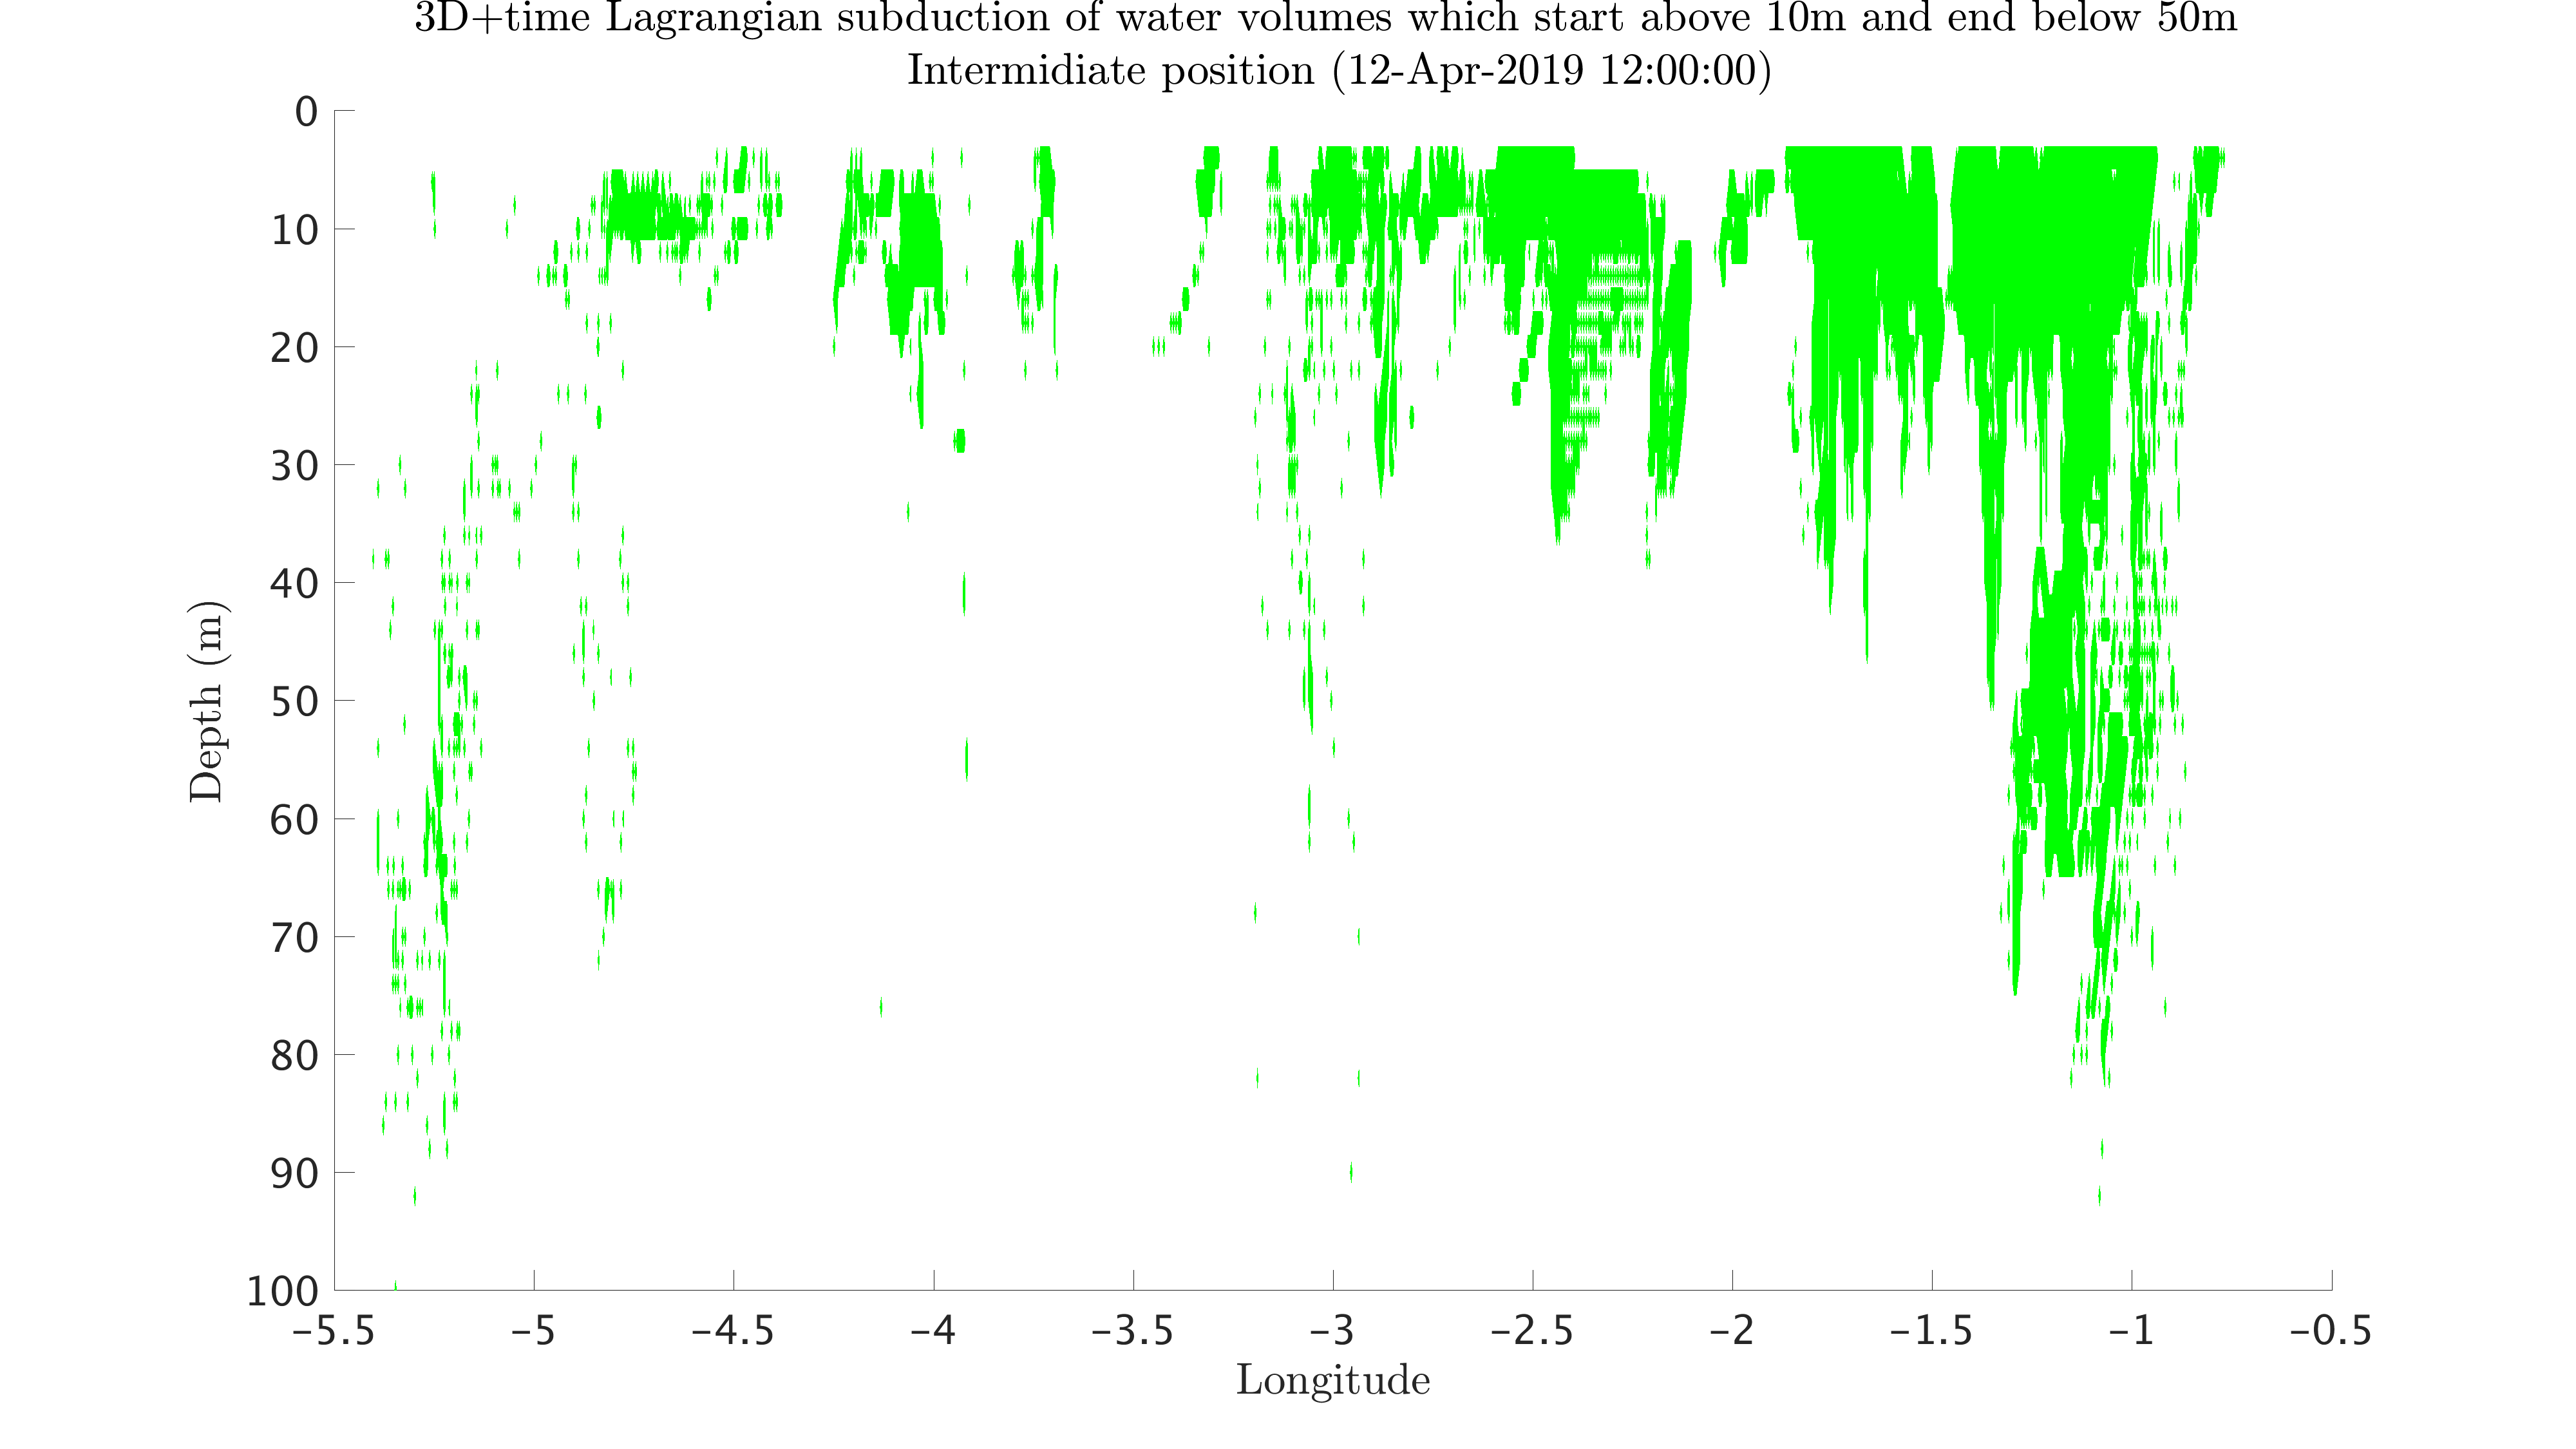
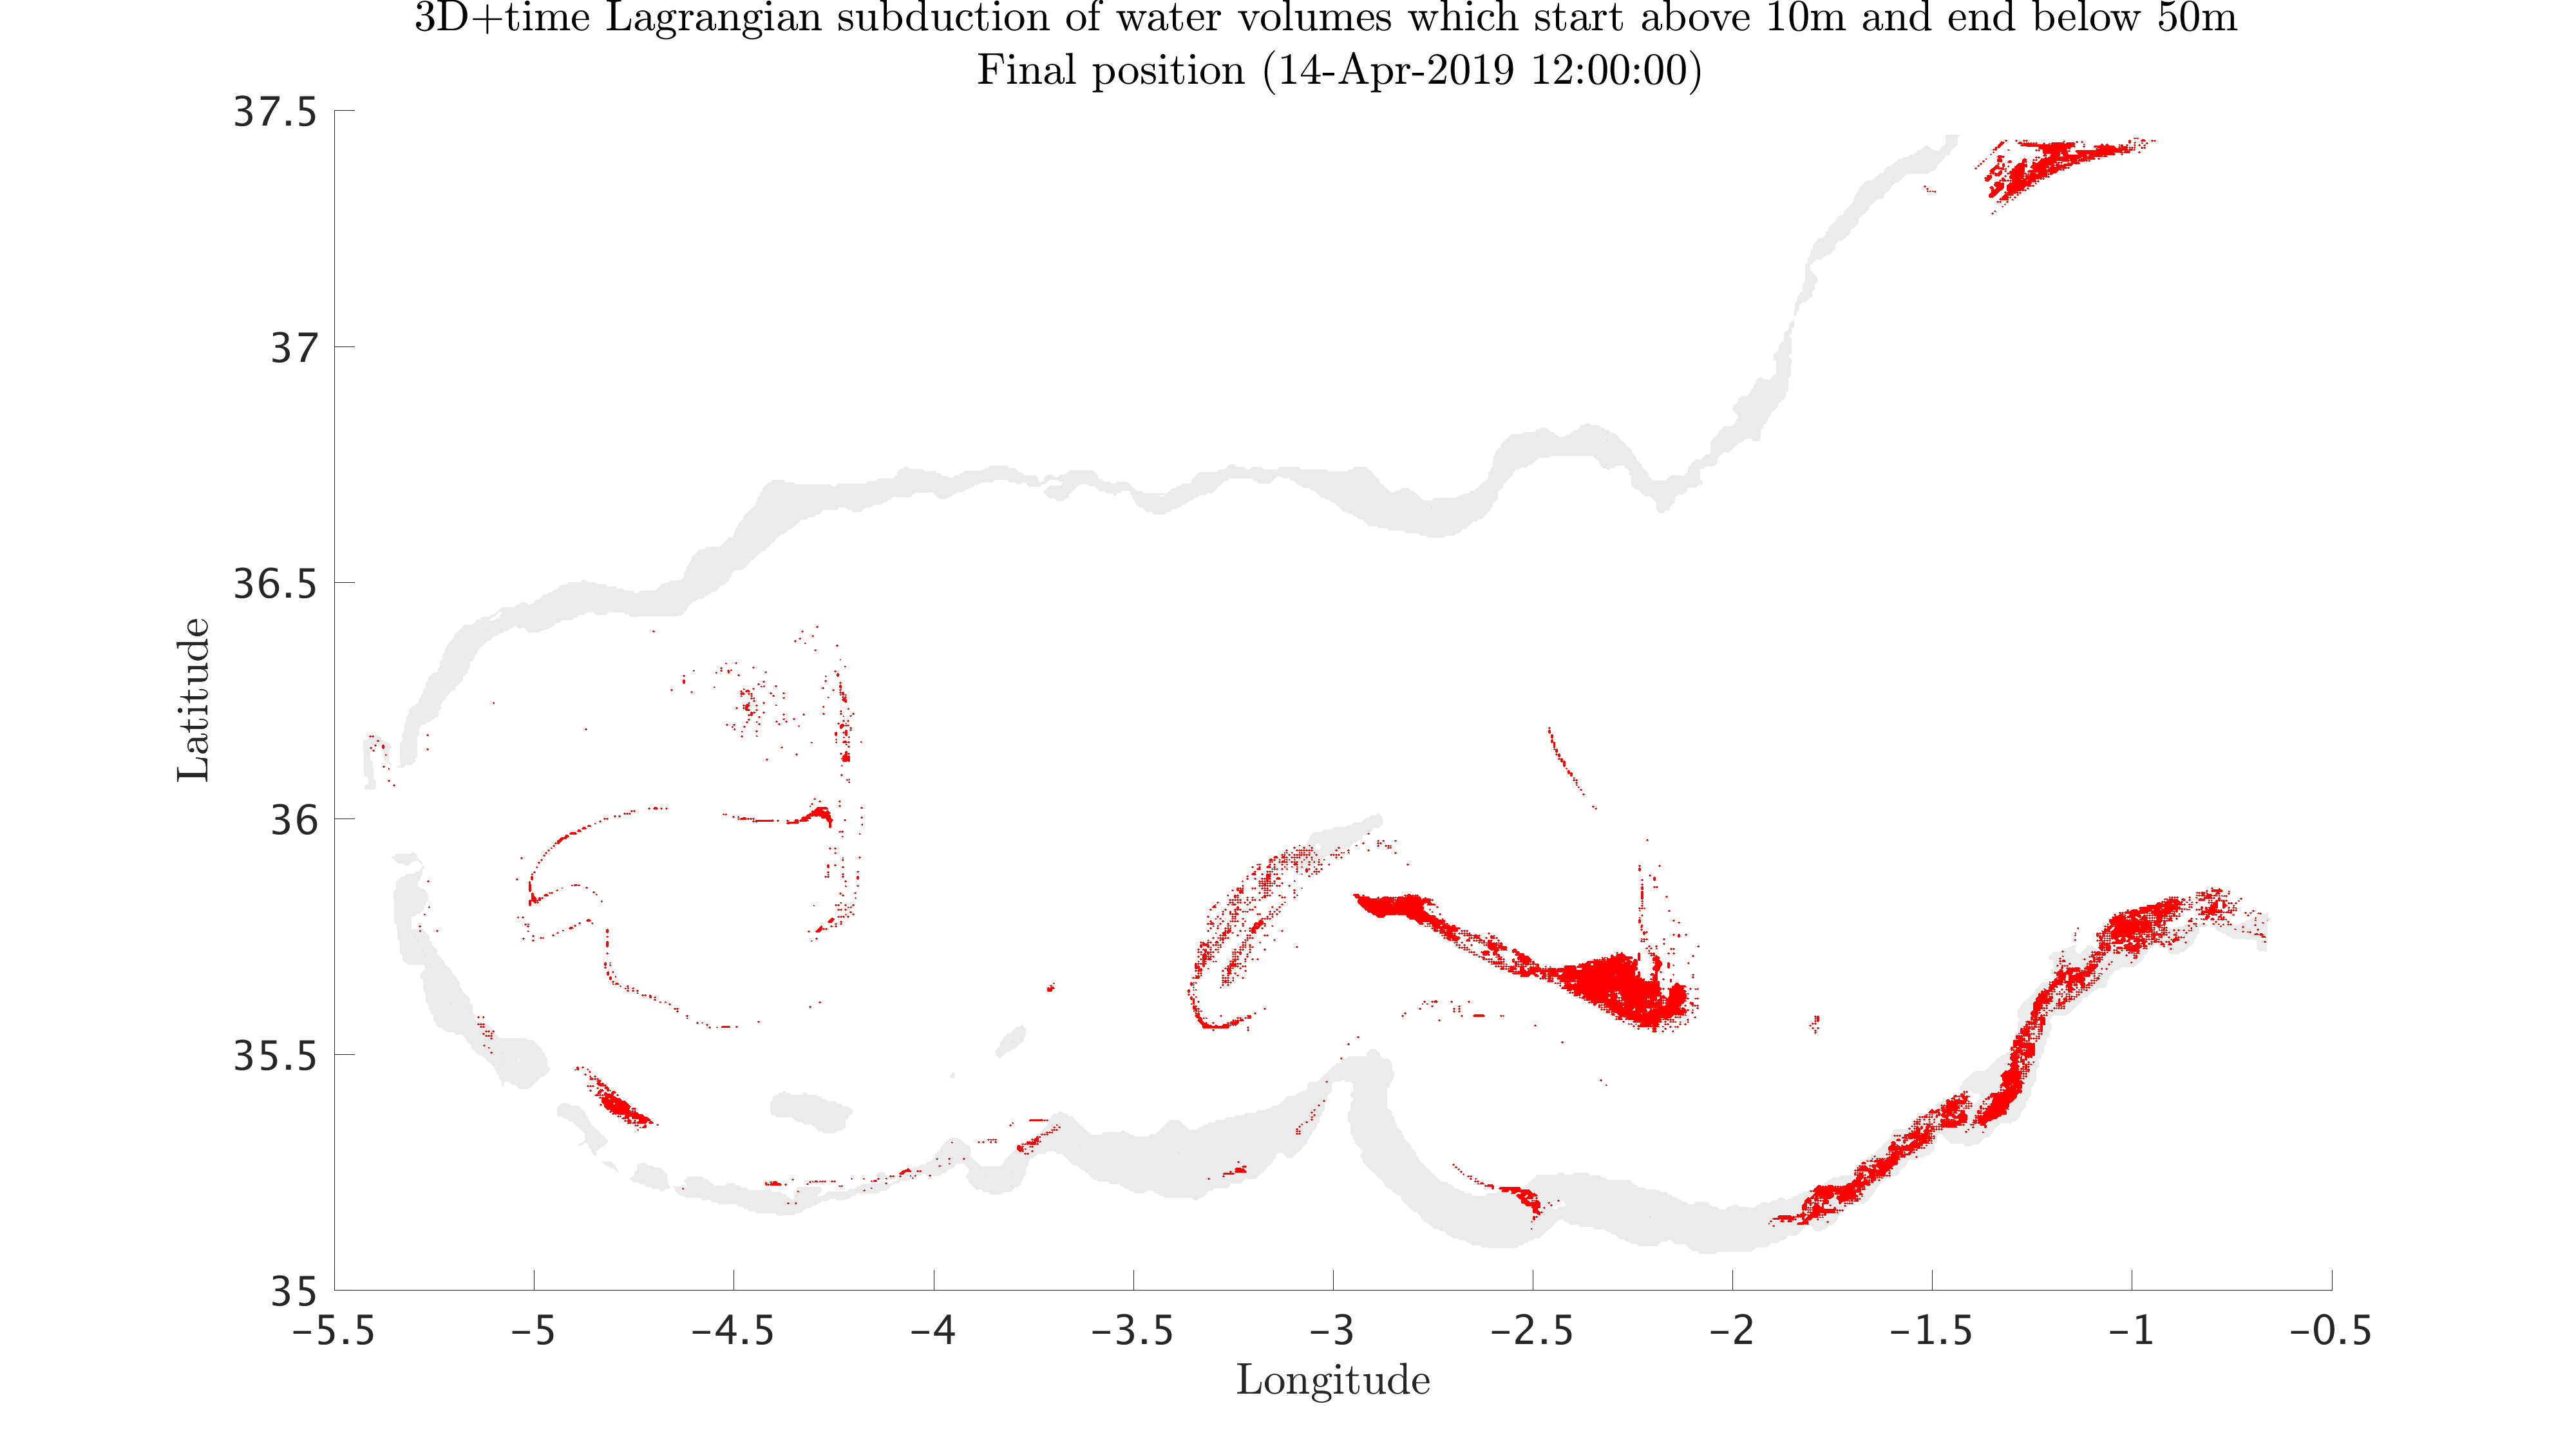
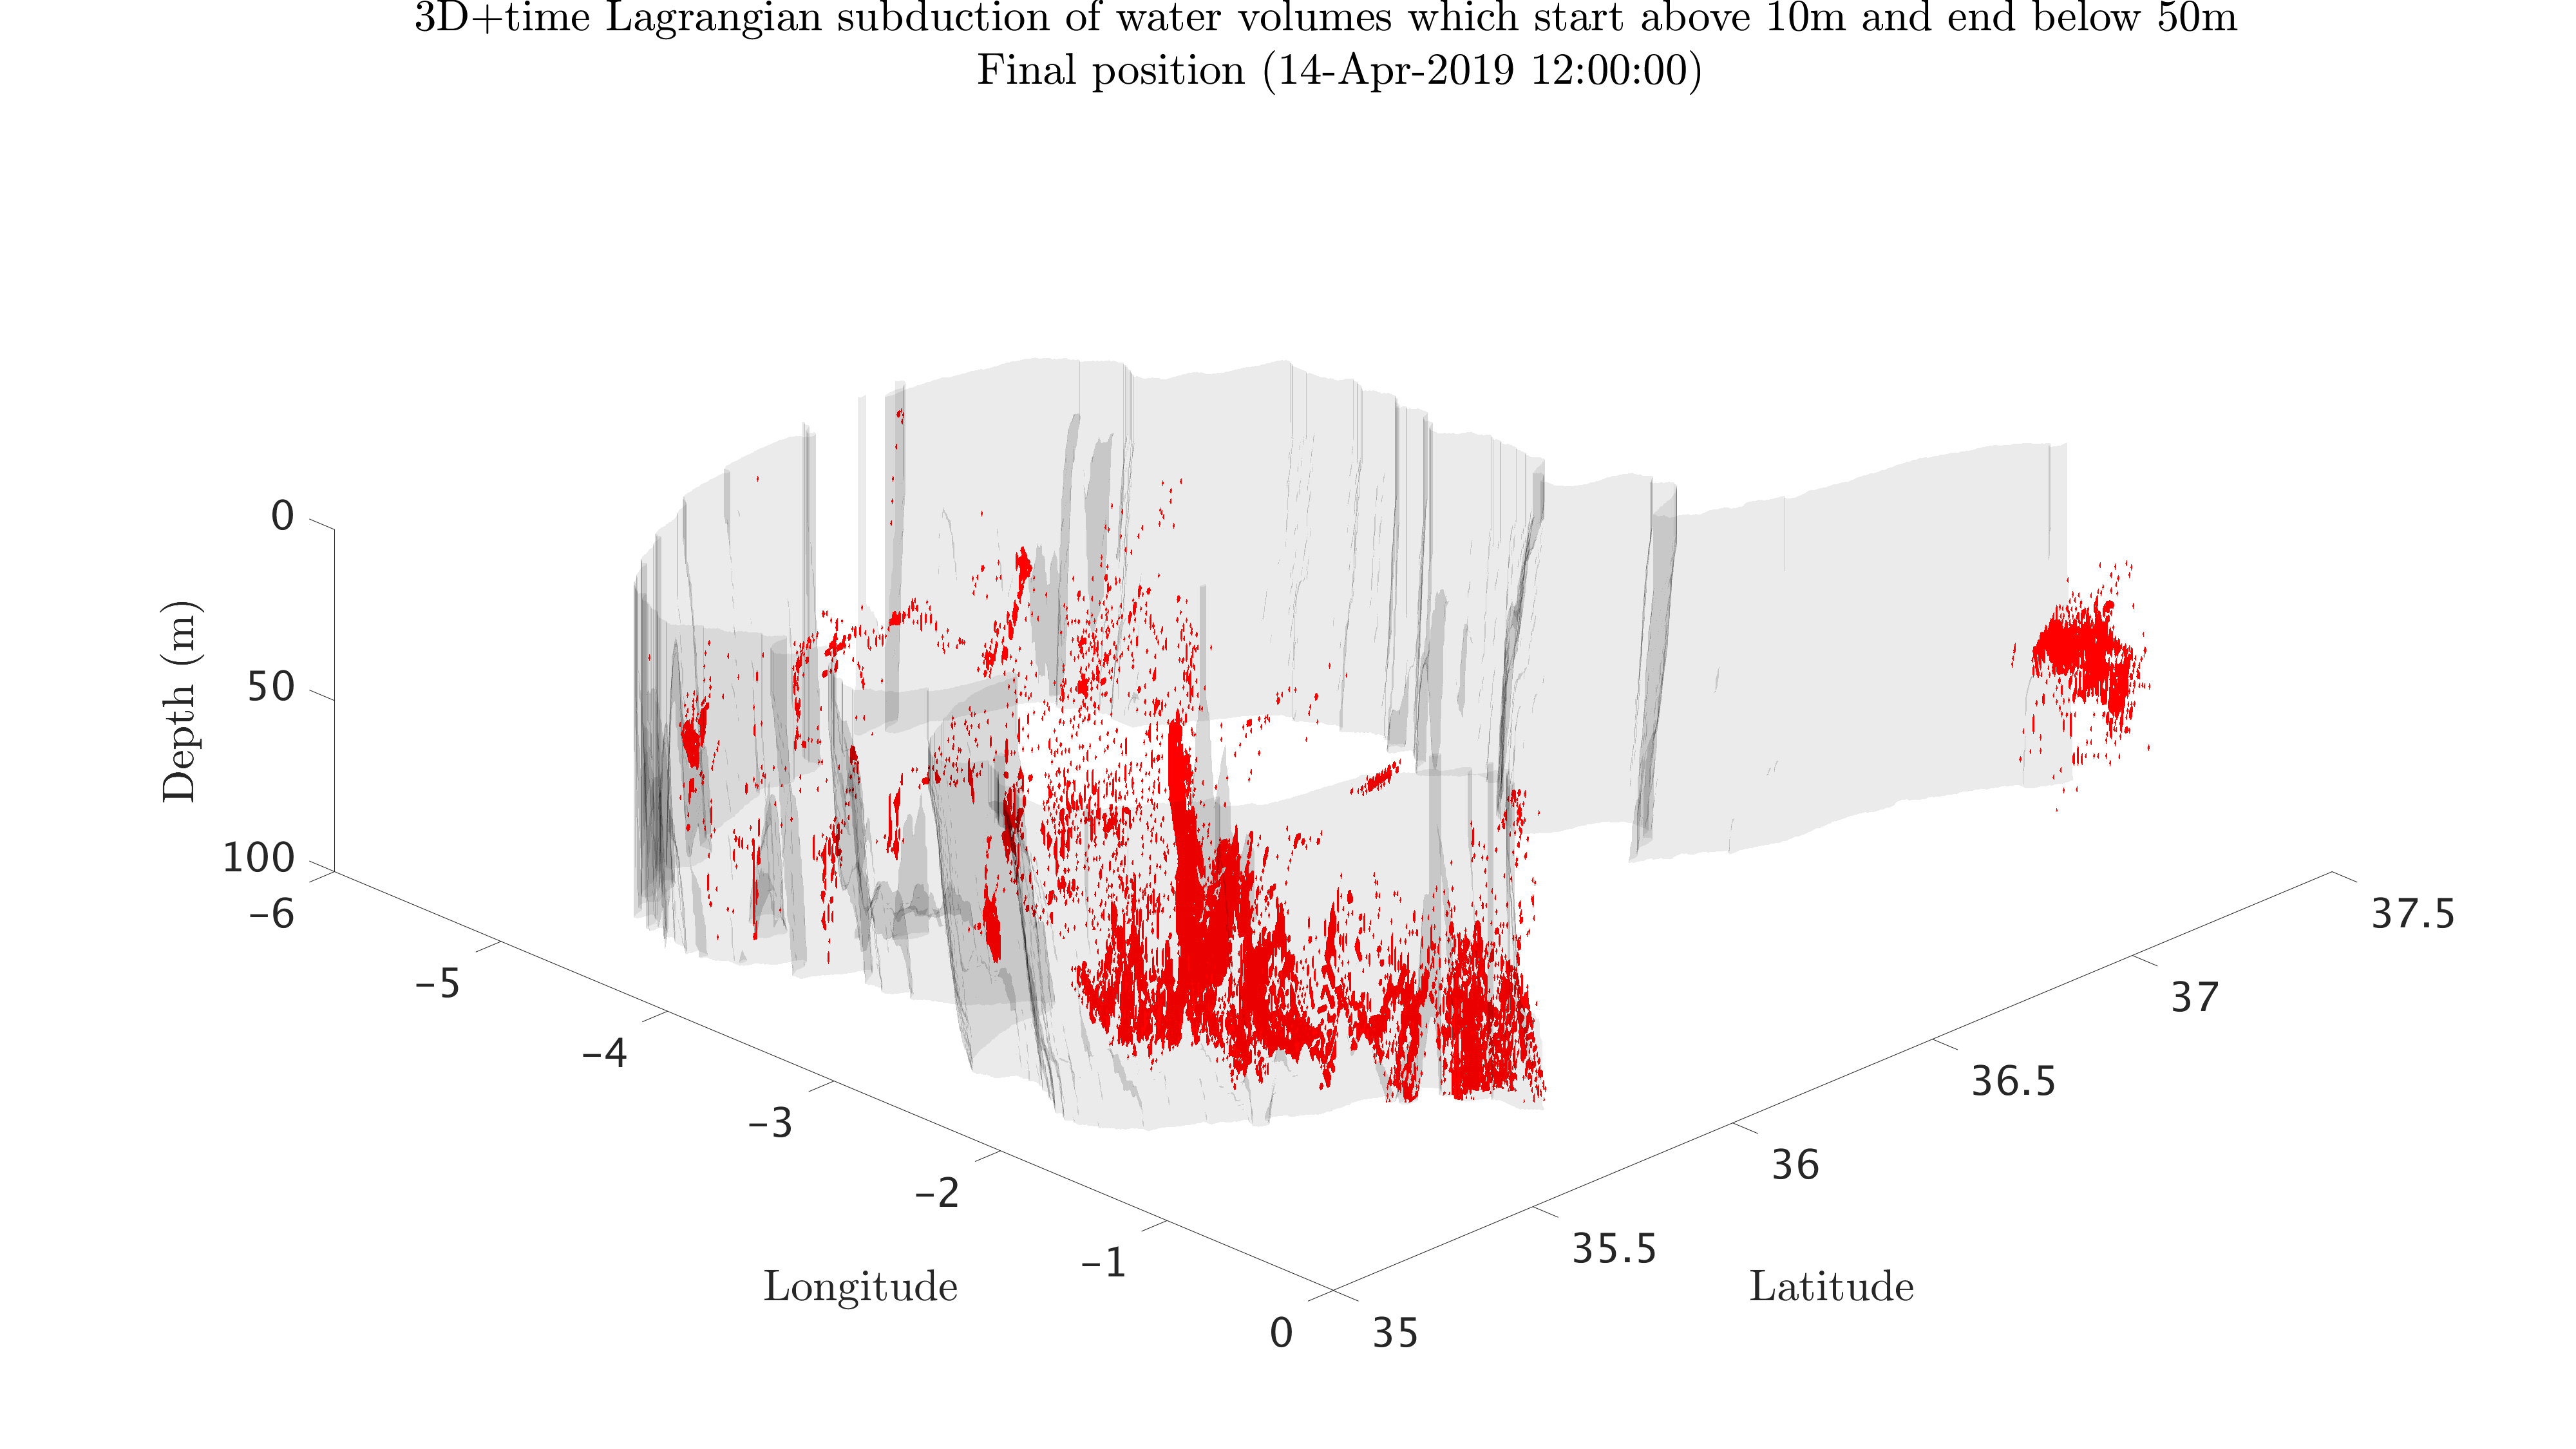
The following figures show the water volumes that are forecast to subduct in 3D (computed based on our MSEAS forward flowmap forecast) from the surface layers to deeper layers. They illustrate in 3D+time where these waters start, how they move, and where they end up.
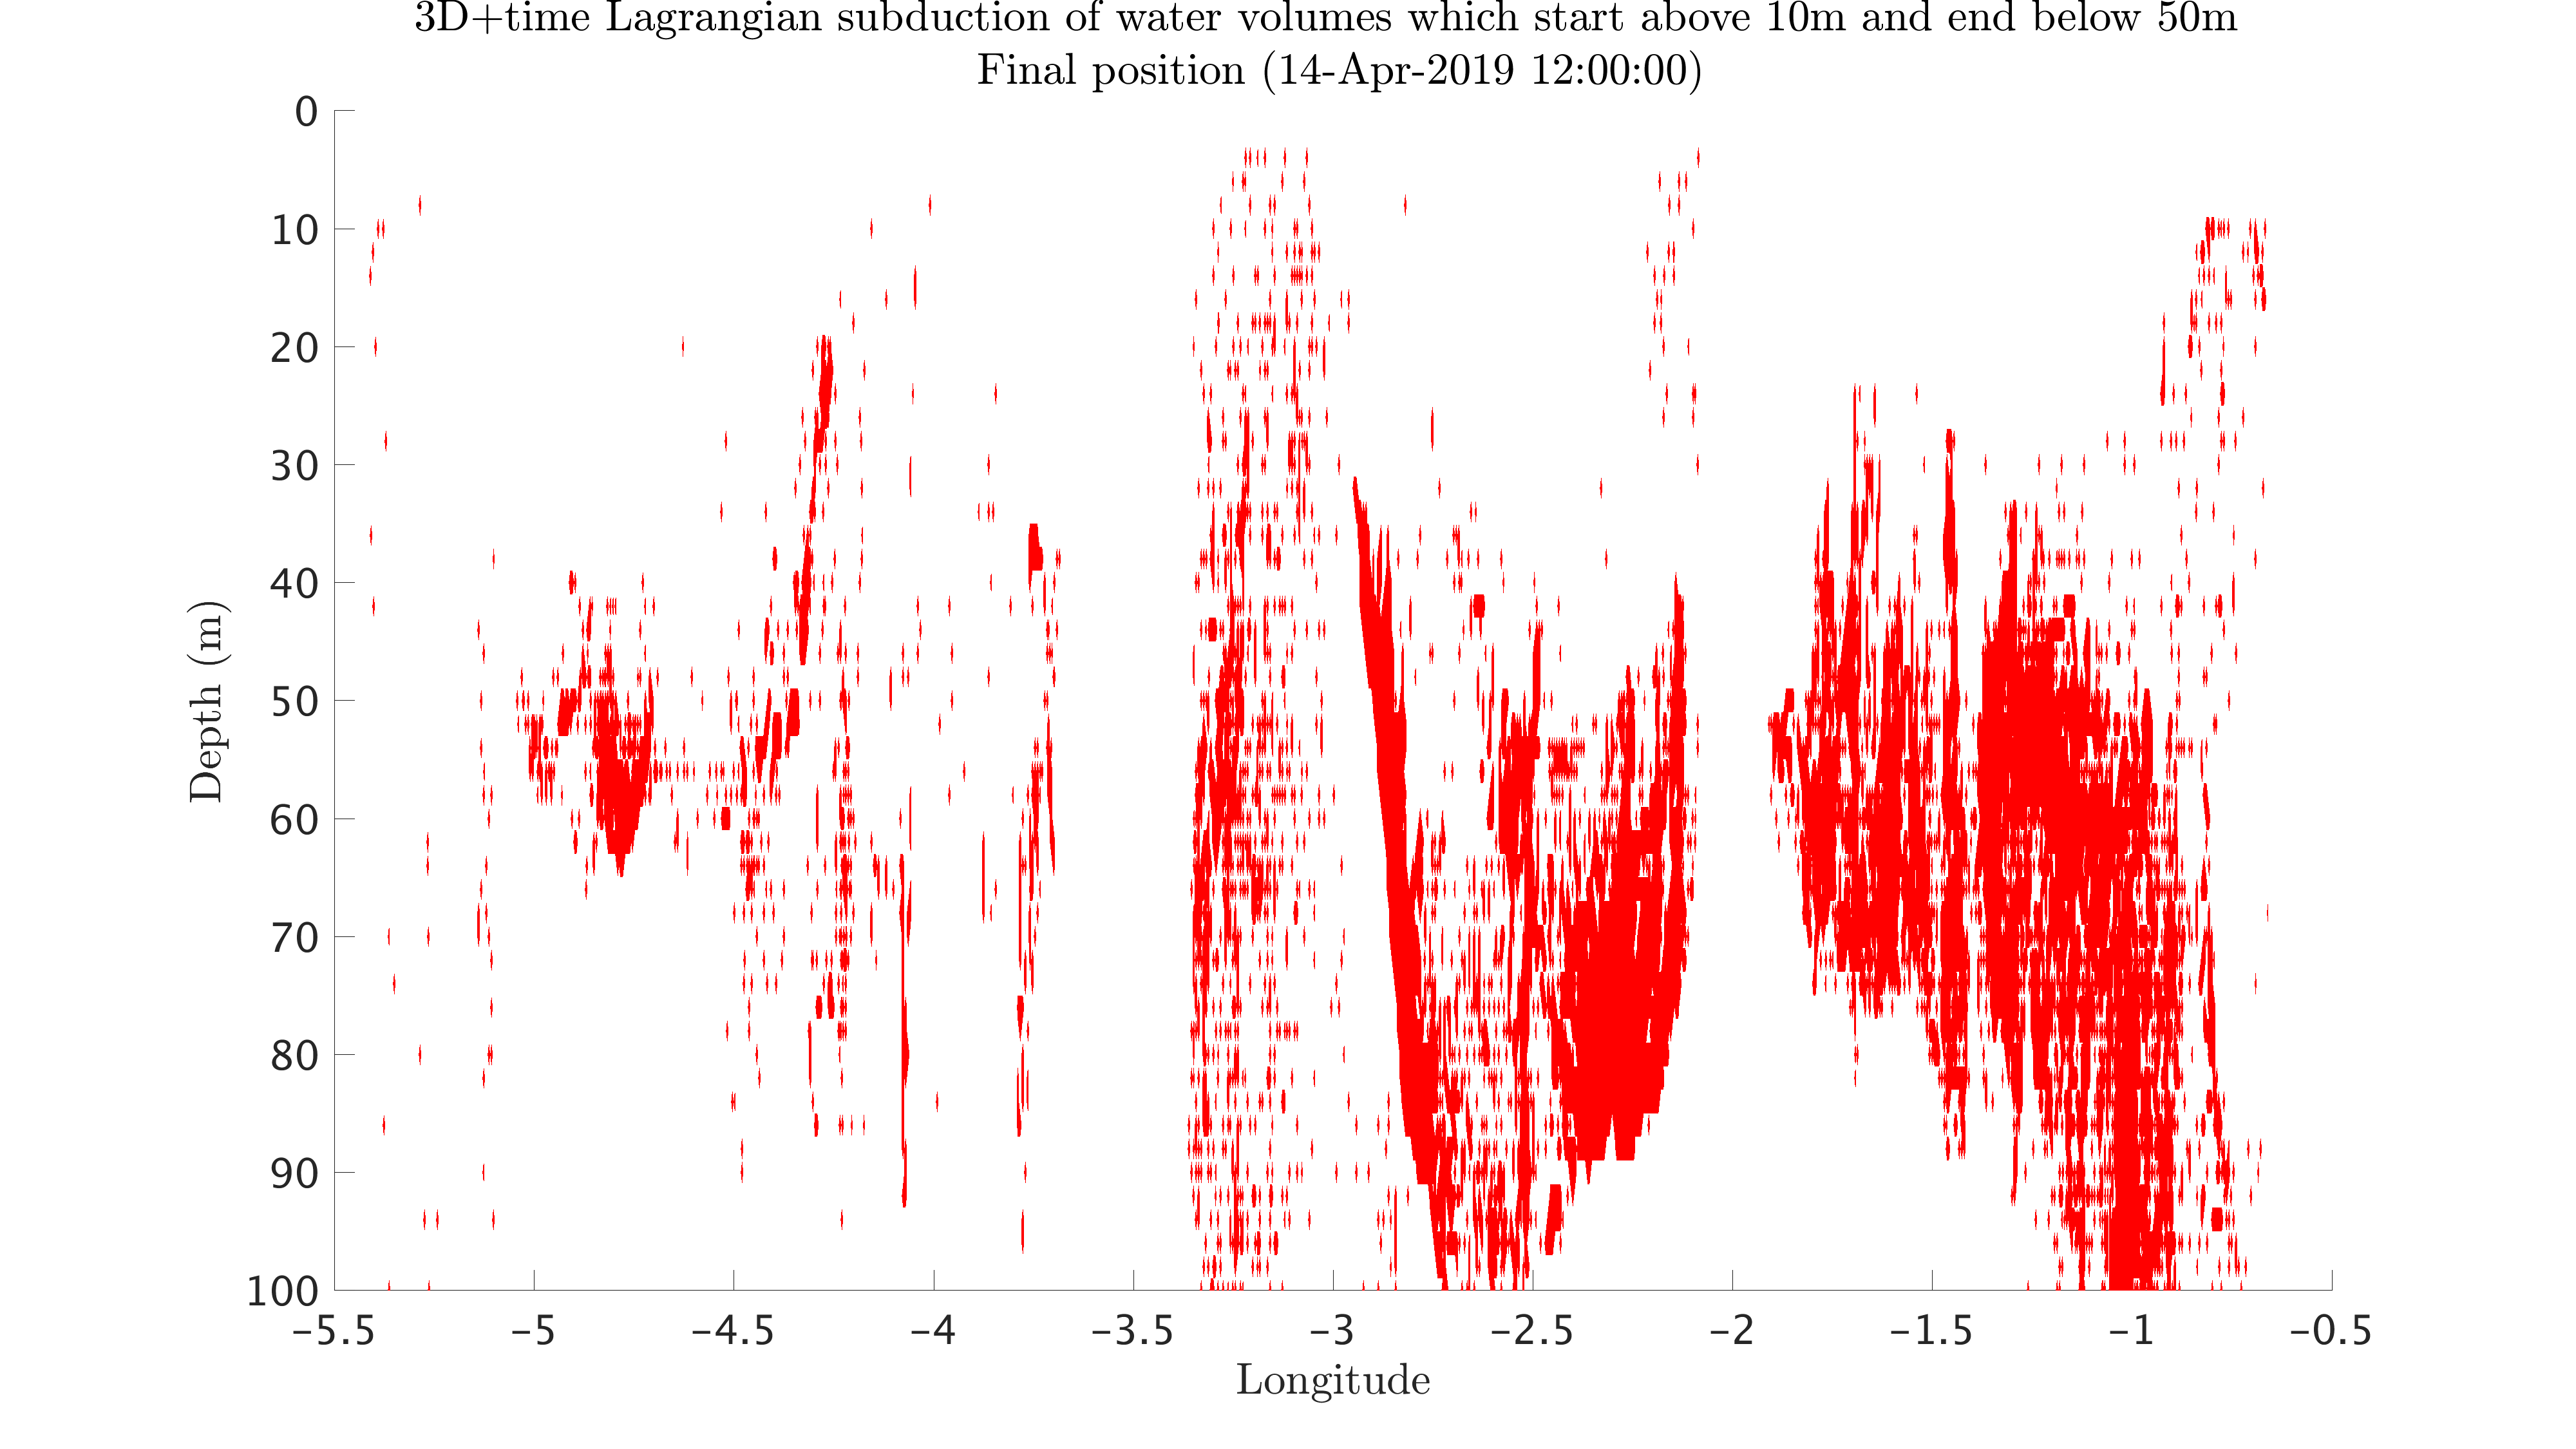
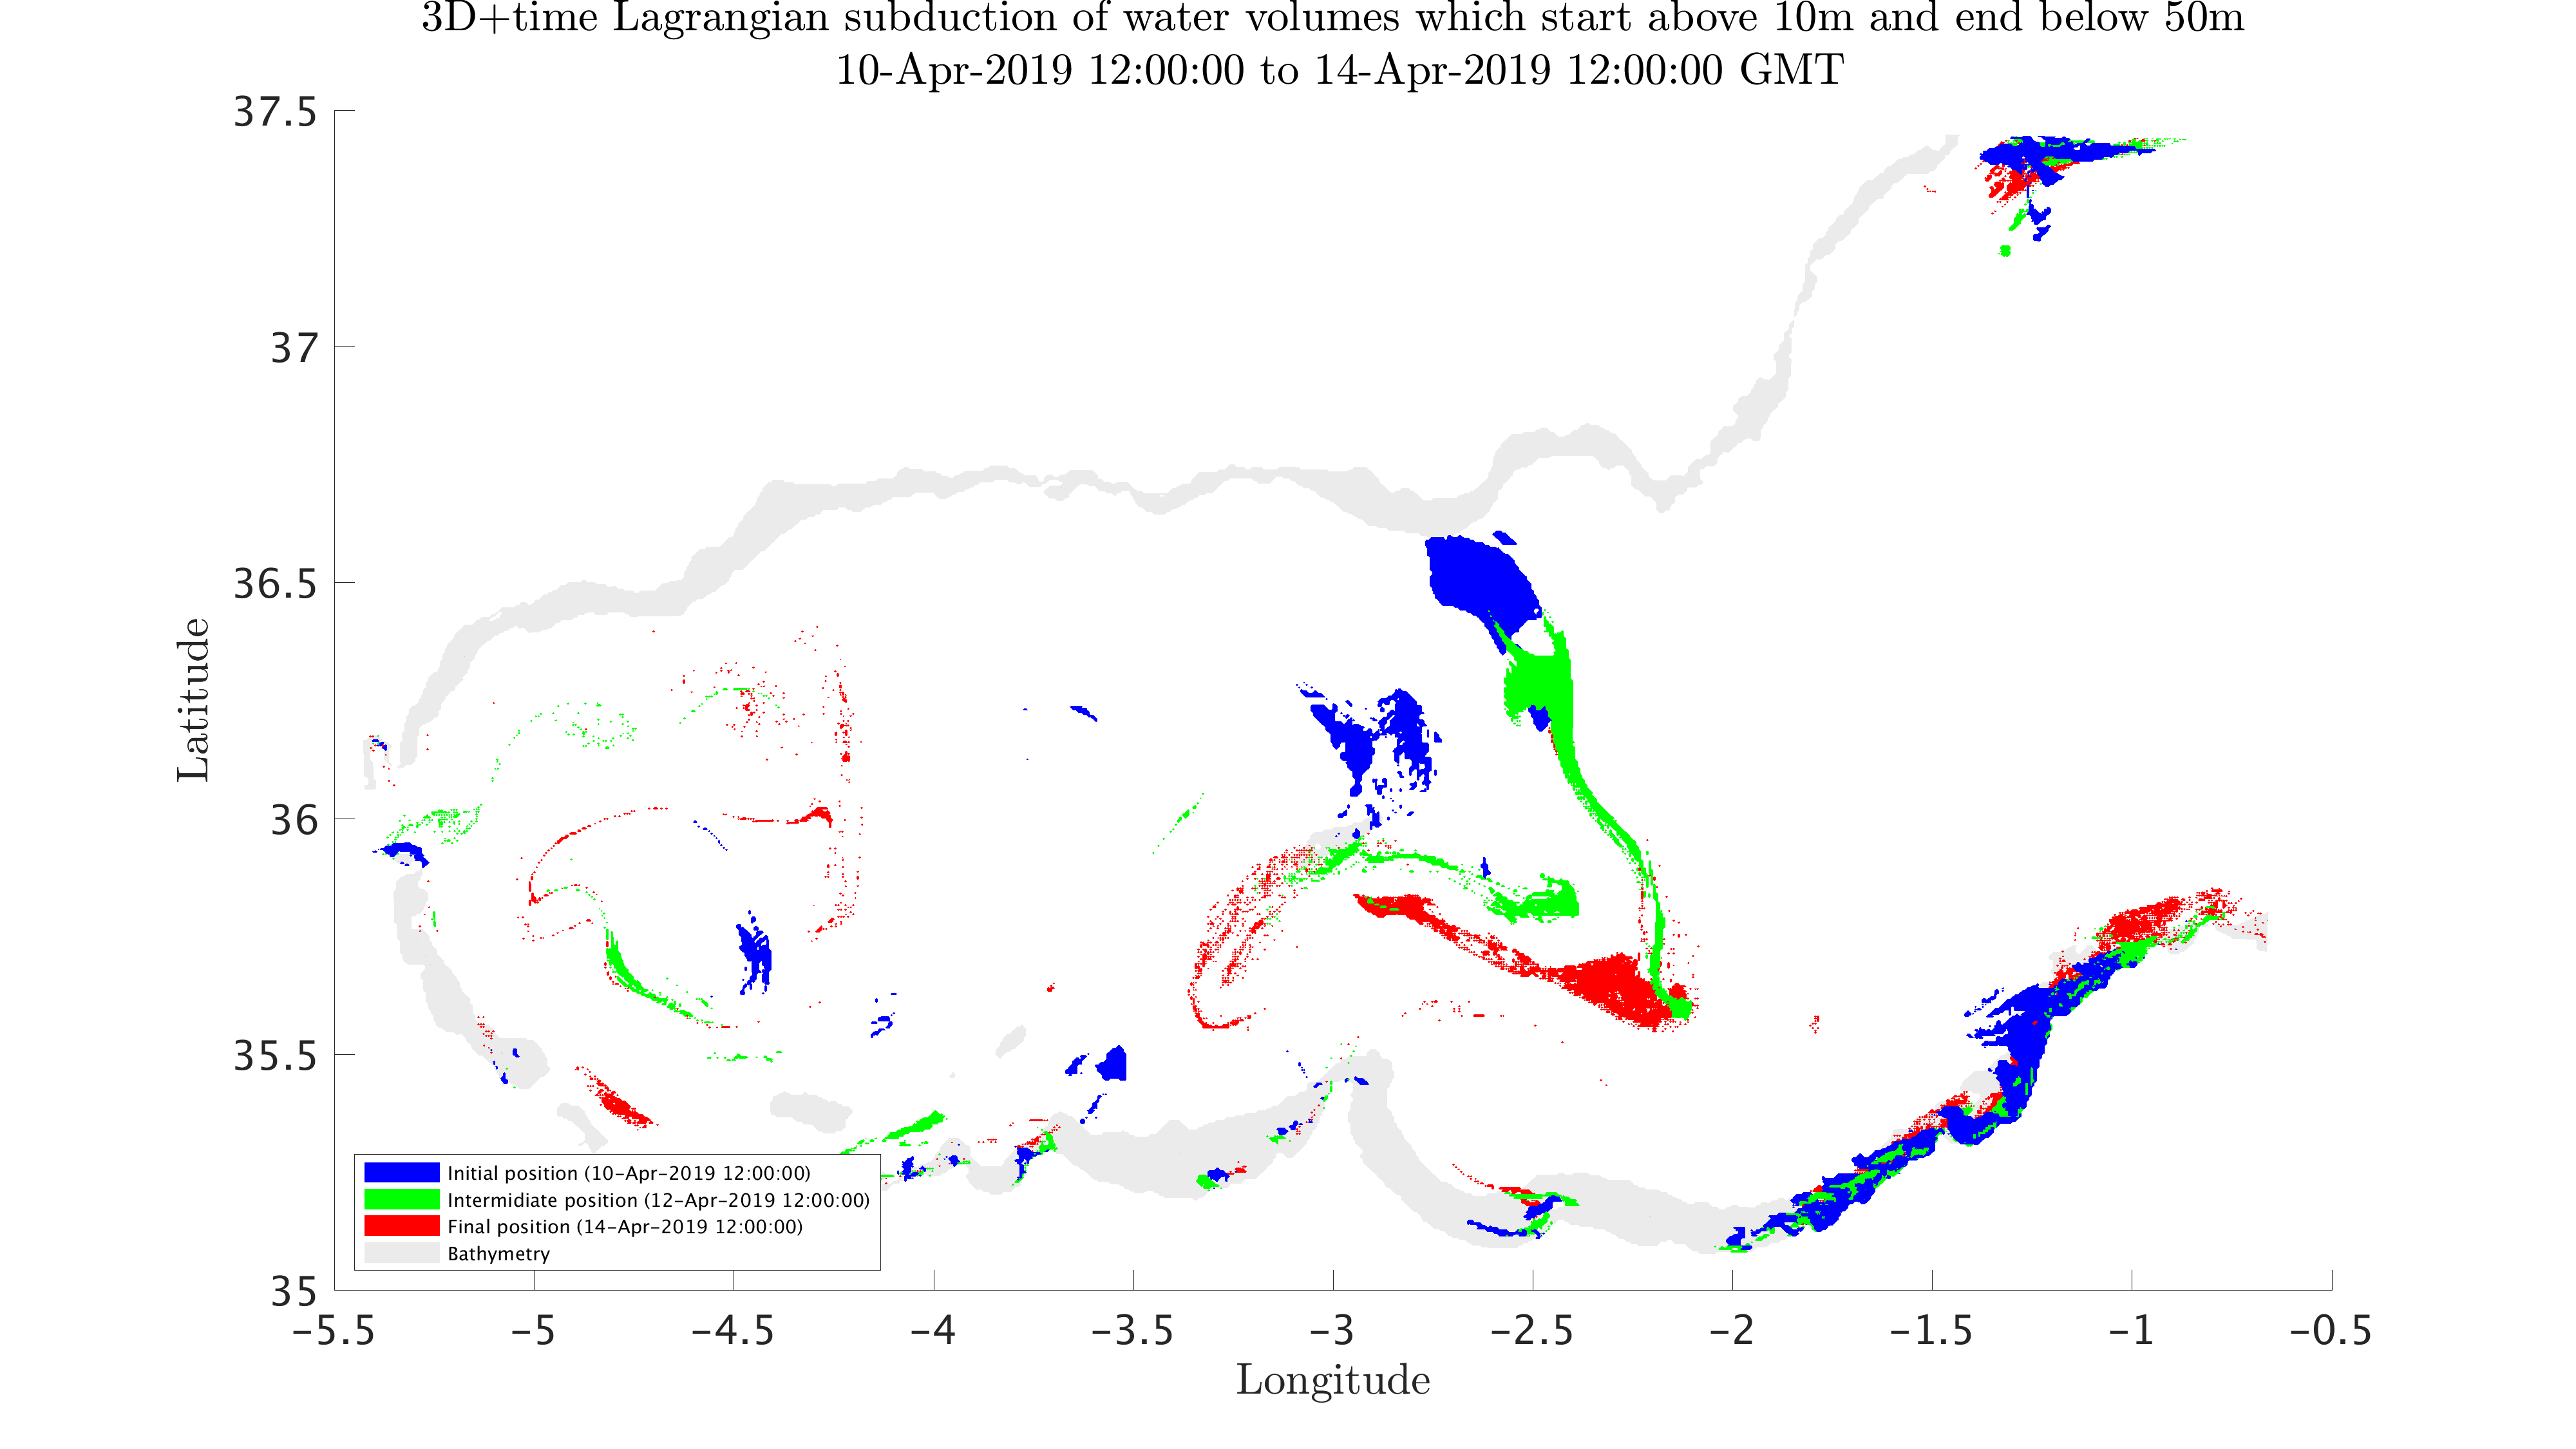
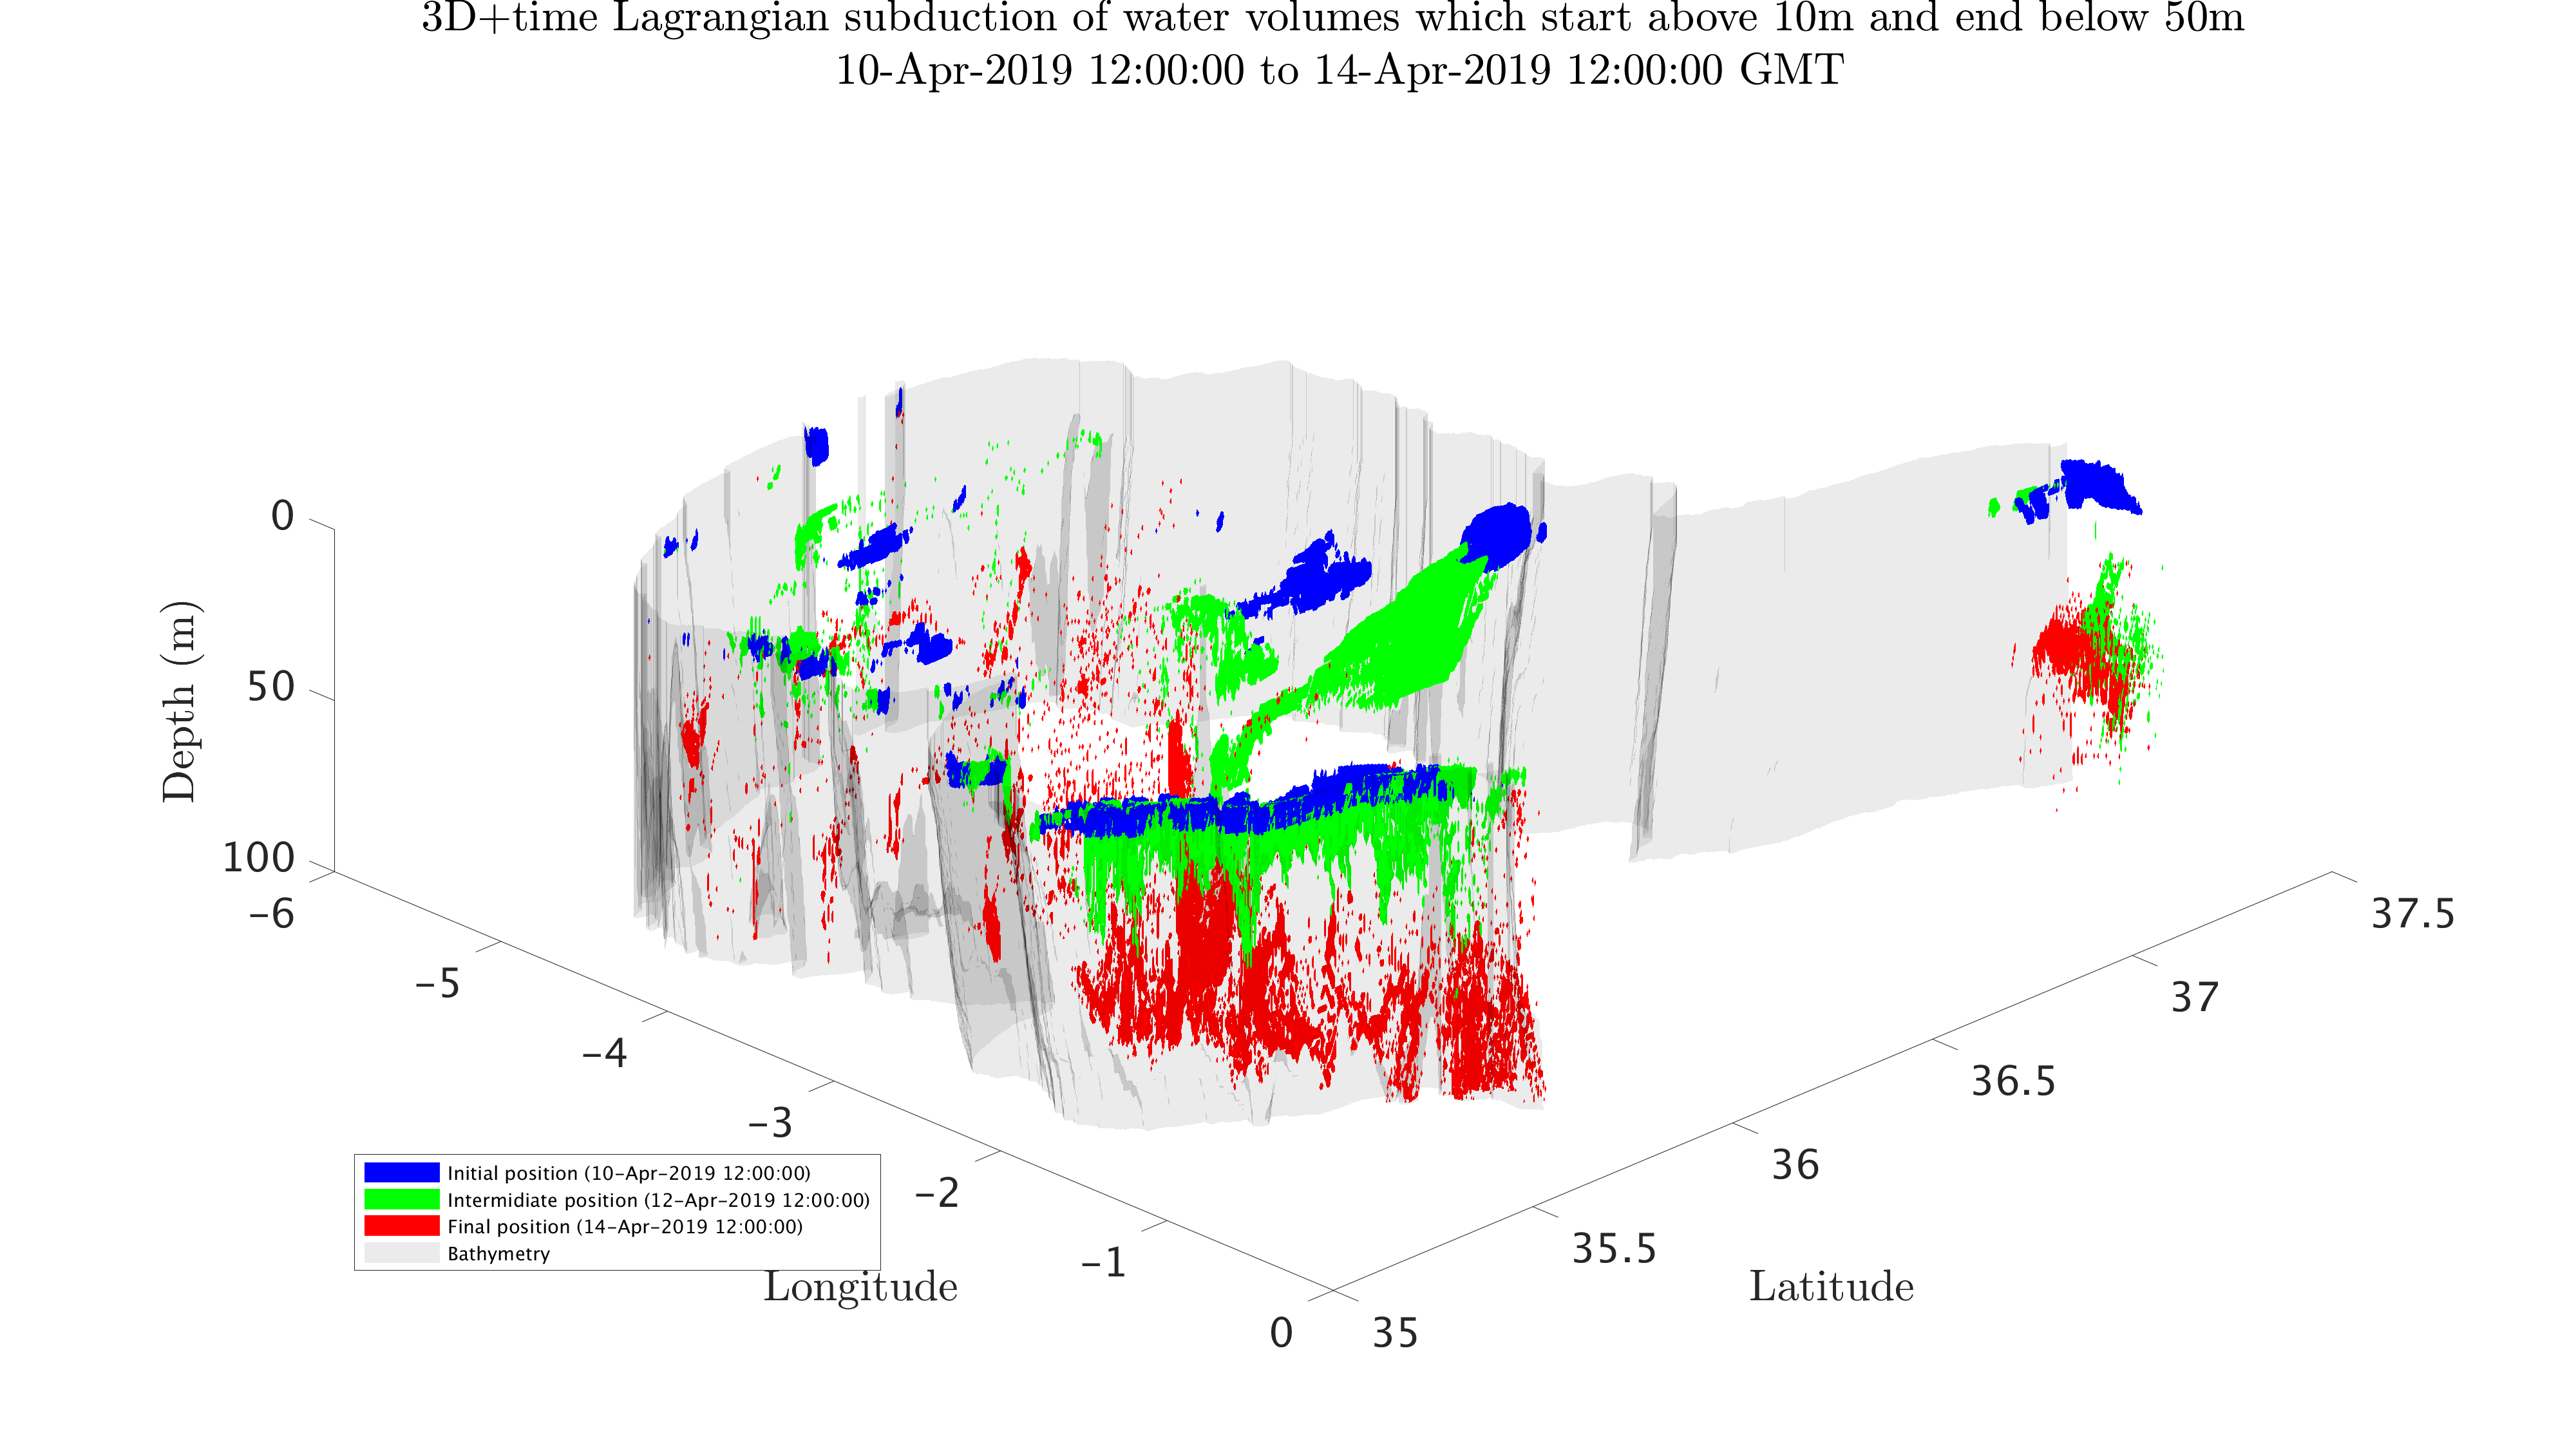
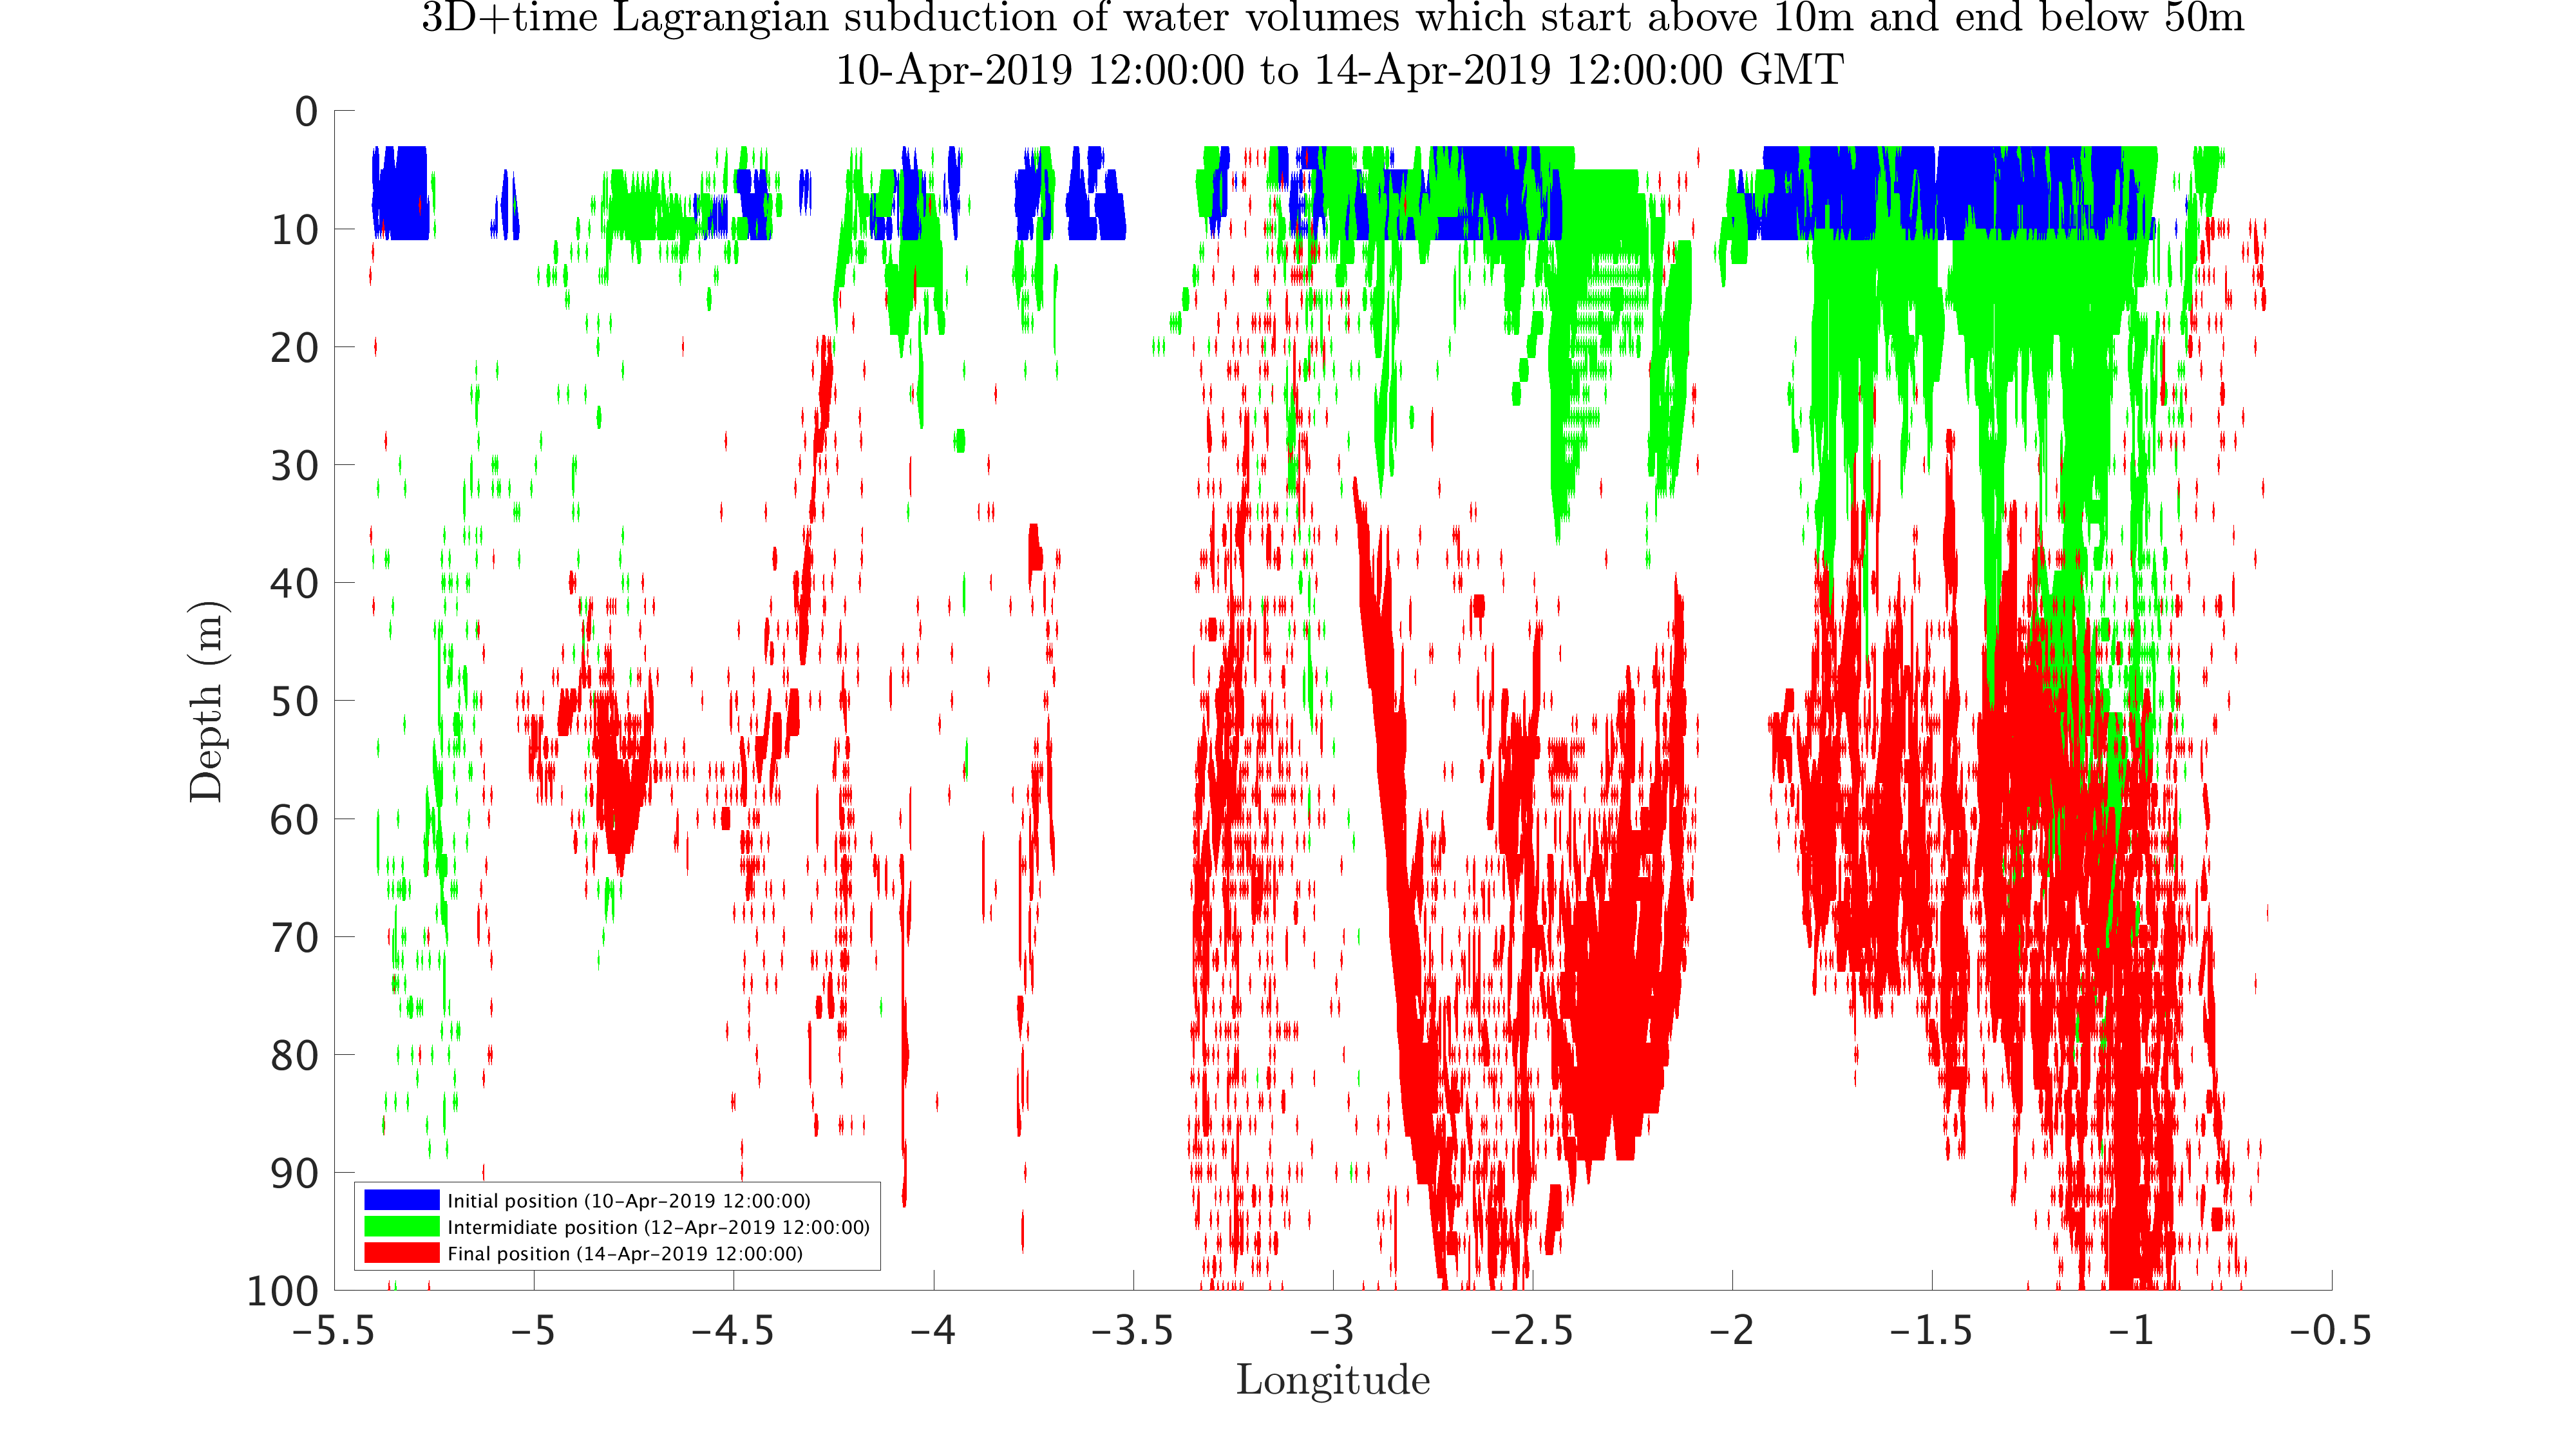
The waters that are plotted in this subduction analysis are only the volumes of water that start within the upper ocean layers (0-to-10 m depths) anywhere in our modeling domain and reach 50m after 4 days. This is all that is plotted, at 3 times (blue is day 0, green is day 2 and red is day 4).
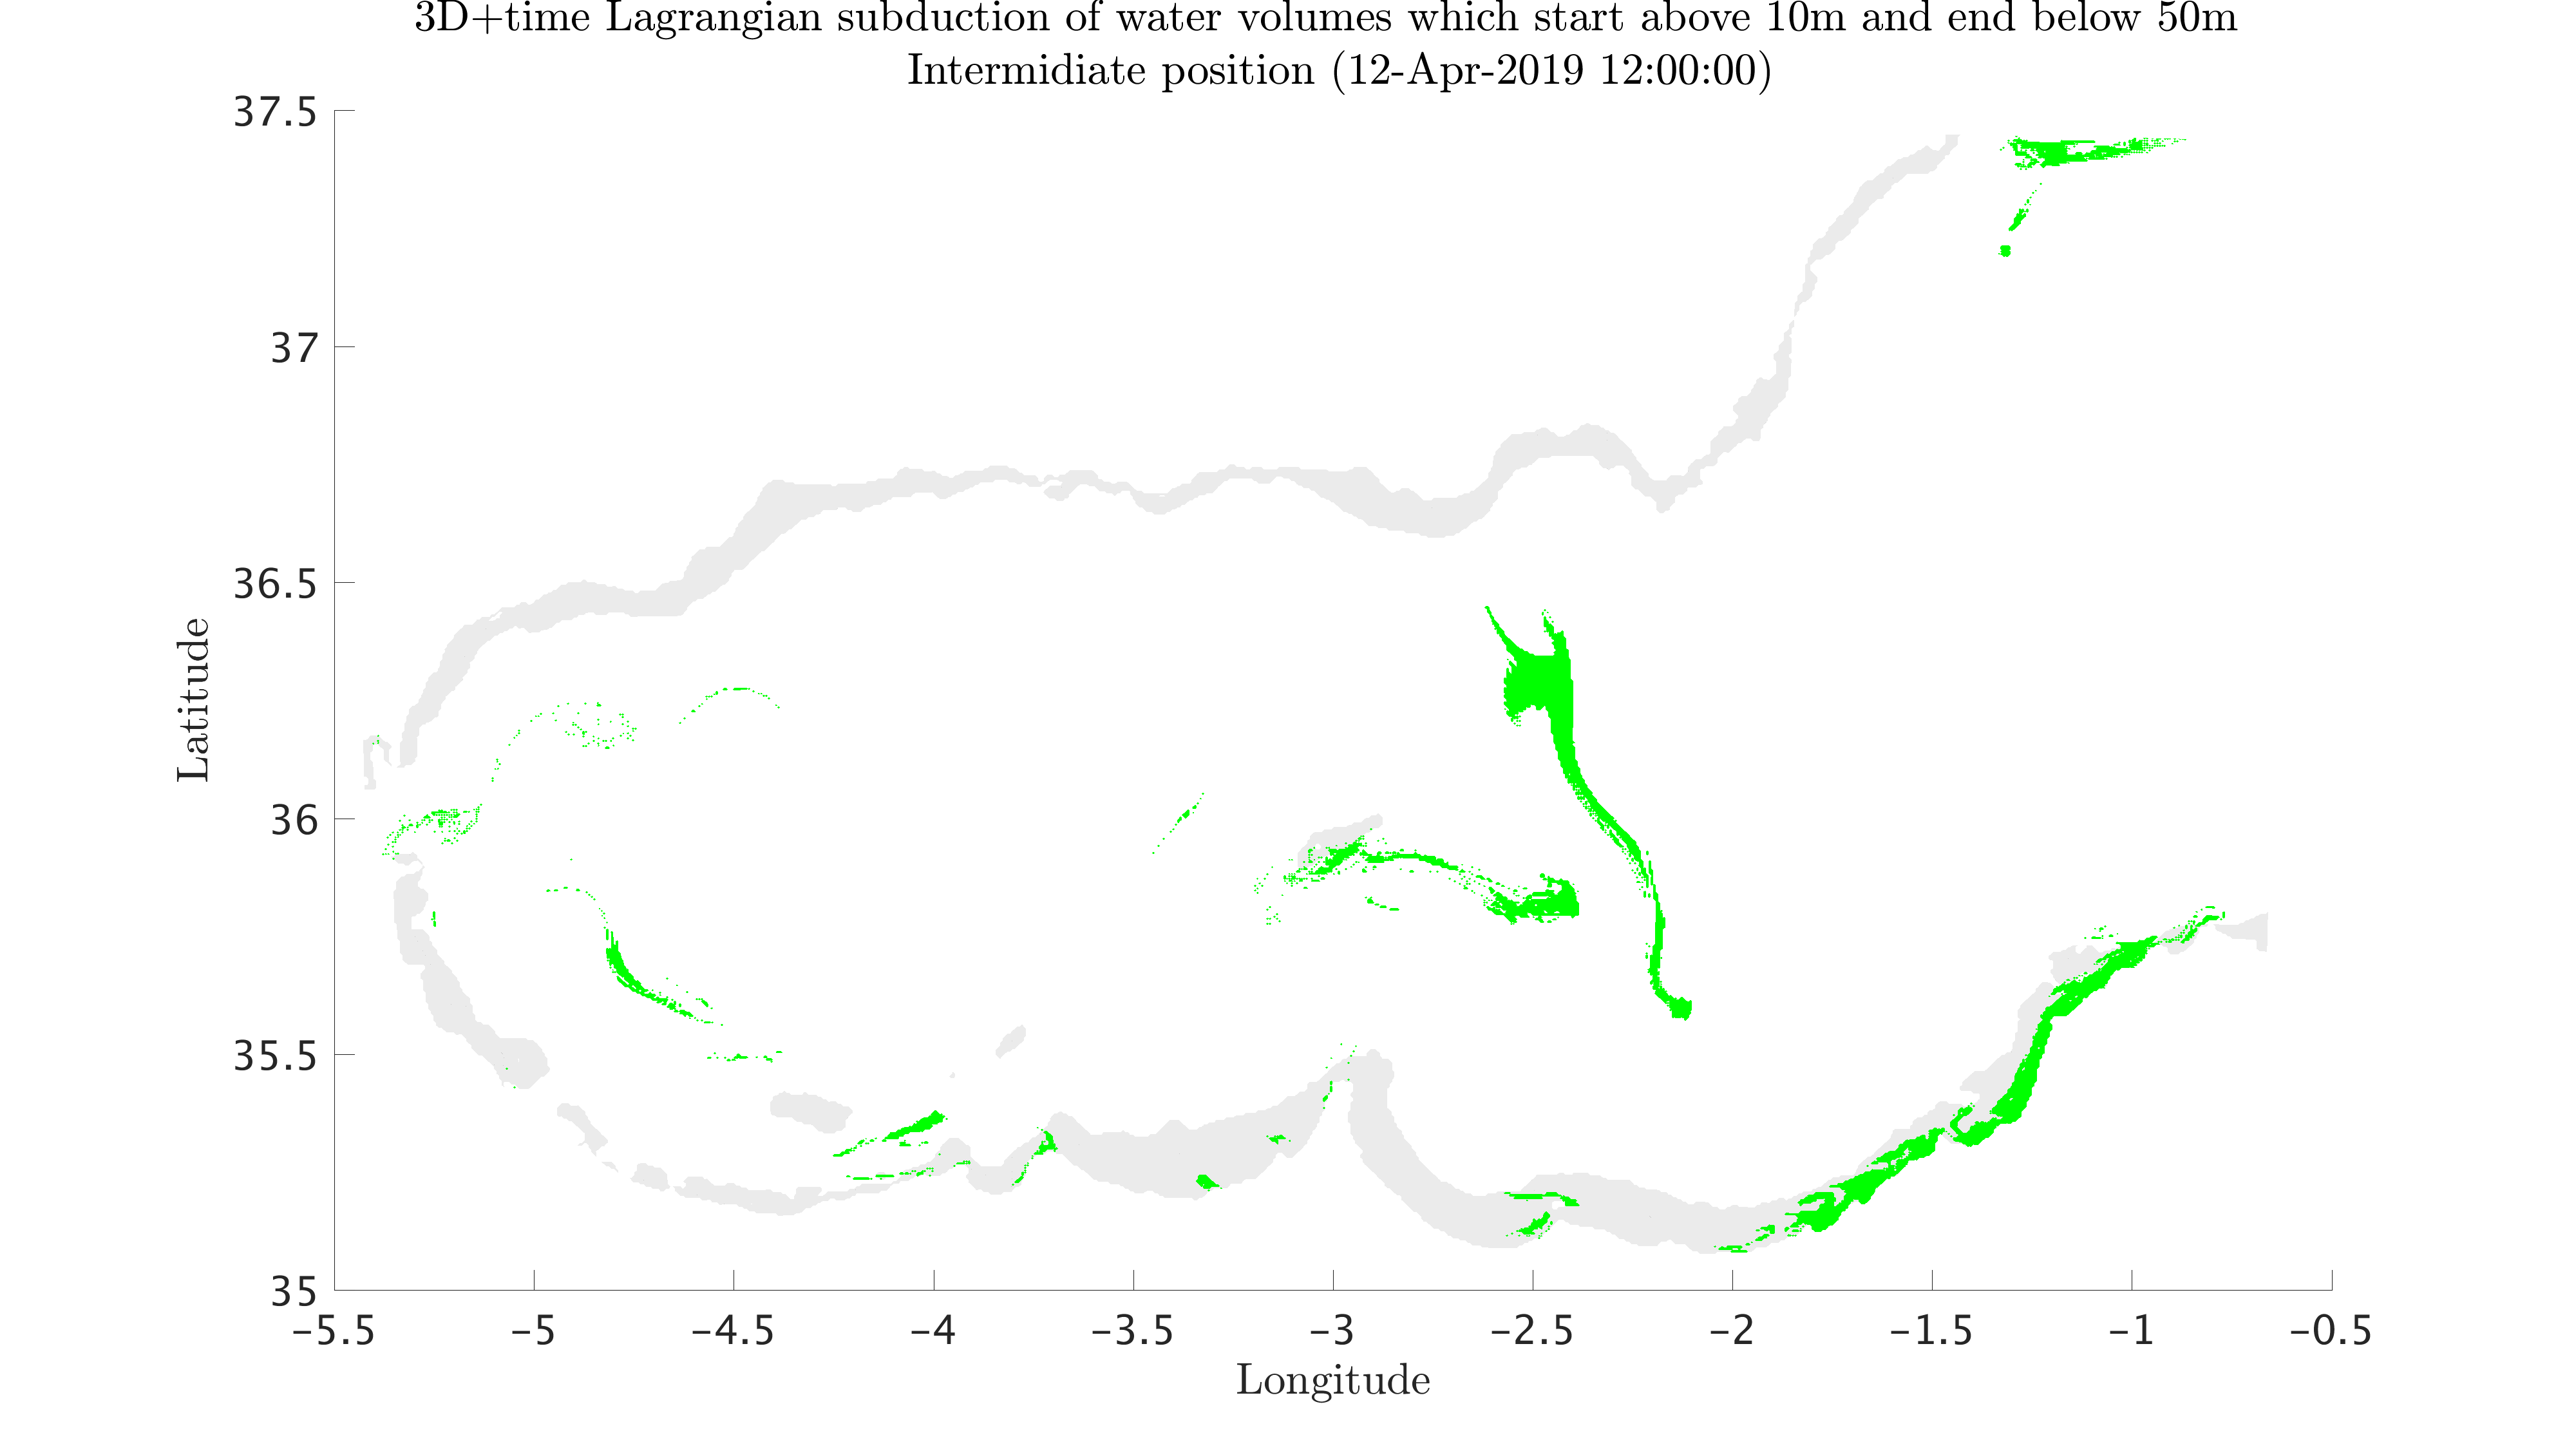
Below, the blue water volumes are the initial positions of these waters that start within 0-to-10 m depths and reach 50m after 4 days. These water volumes are advected using a flowmap-based and composition-based advection scheme, using our MSEAS forecast of the 3D ocean currents (u, v and w). The green water volumes represent the location of the parcels after two days while the red water volumes represent the final location after 4 days. The combined figures in the last row show the 3D water volumes, overlaid, at the 3 different times.
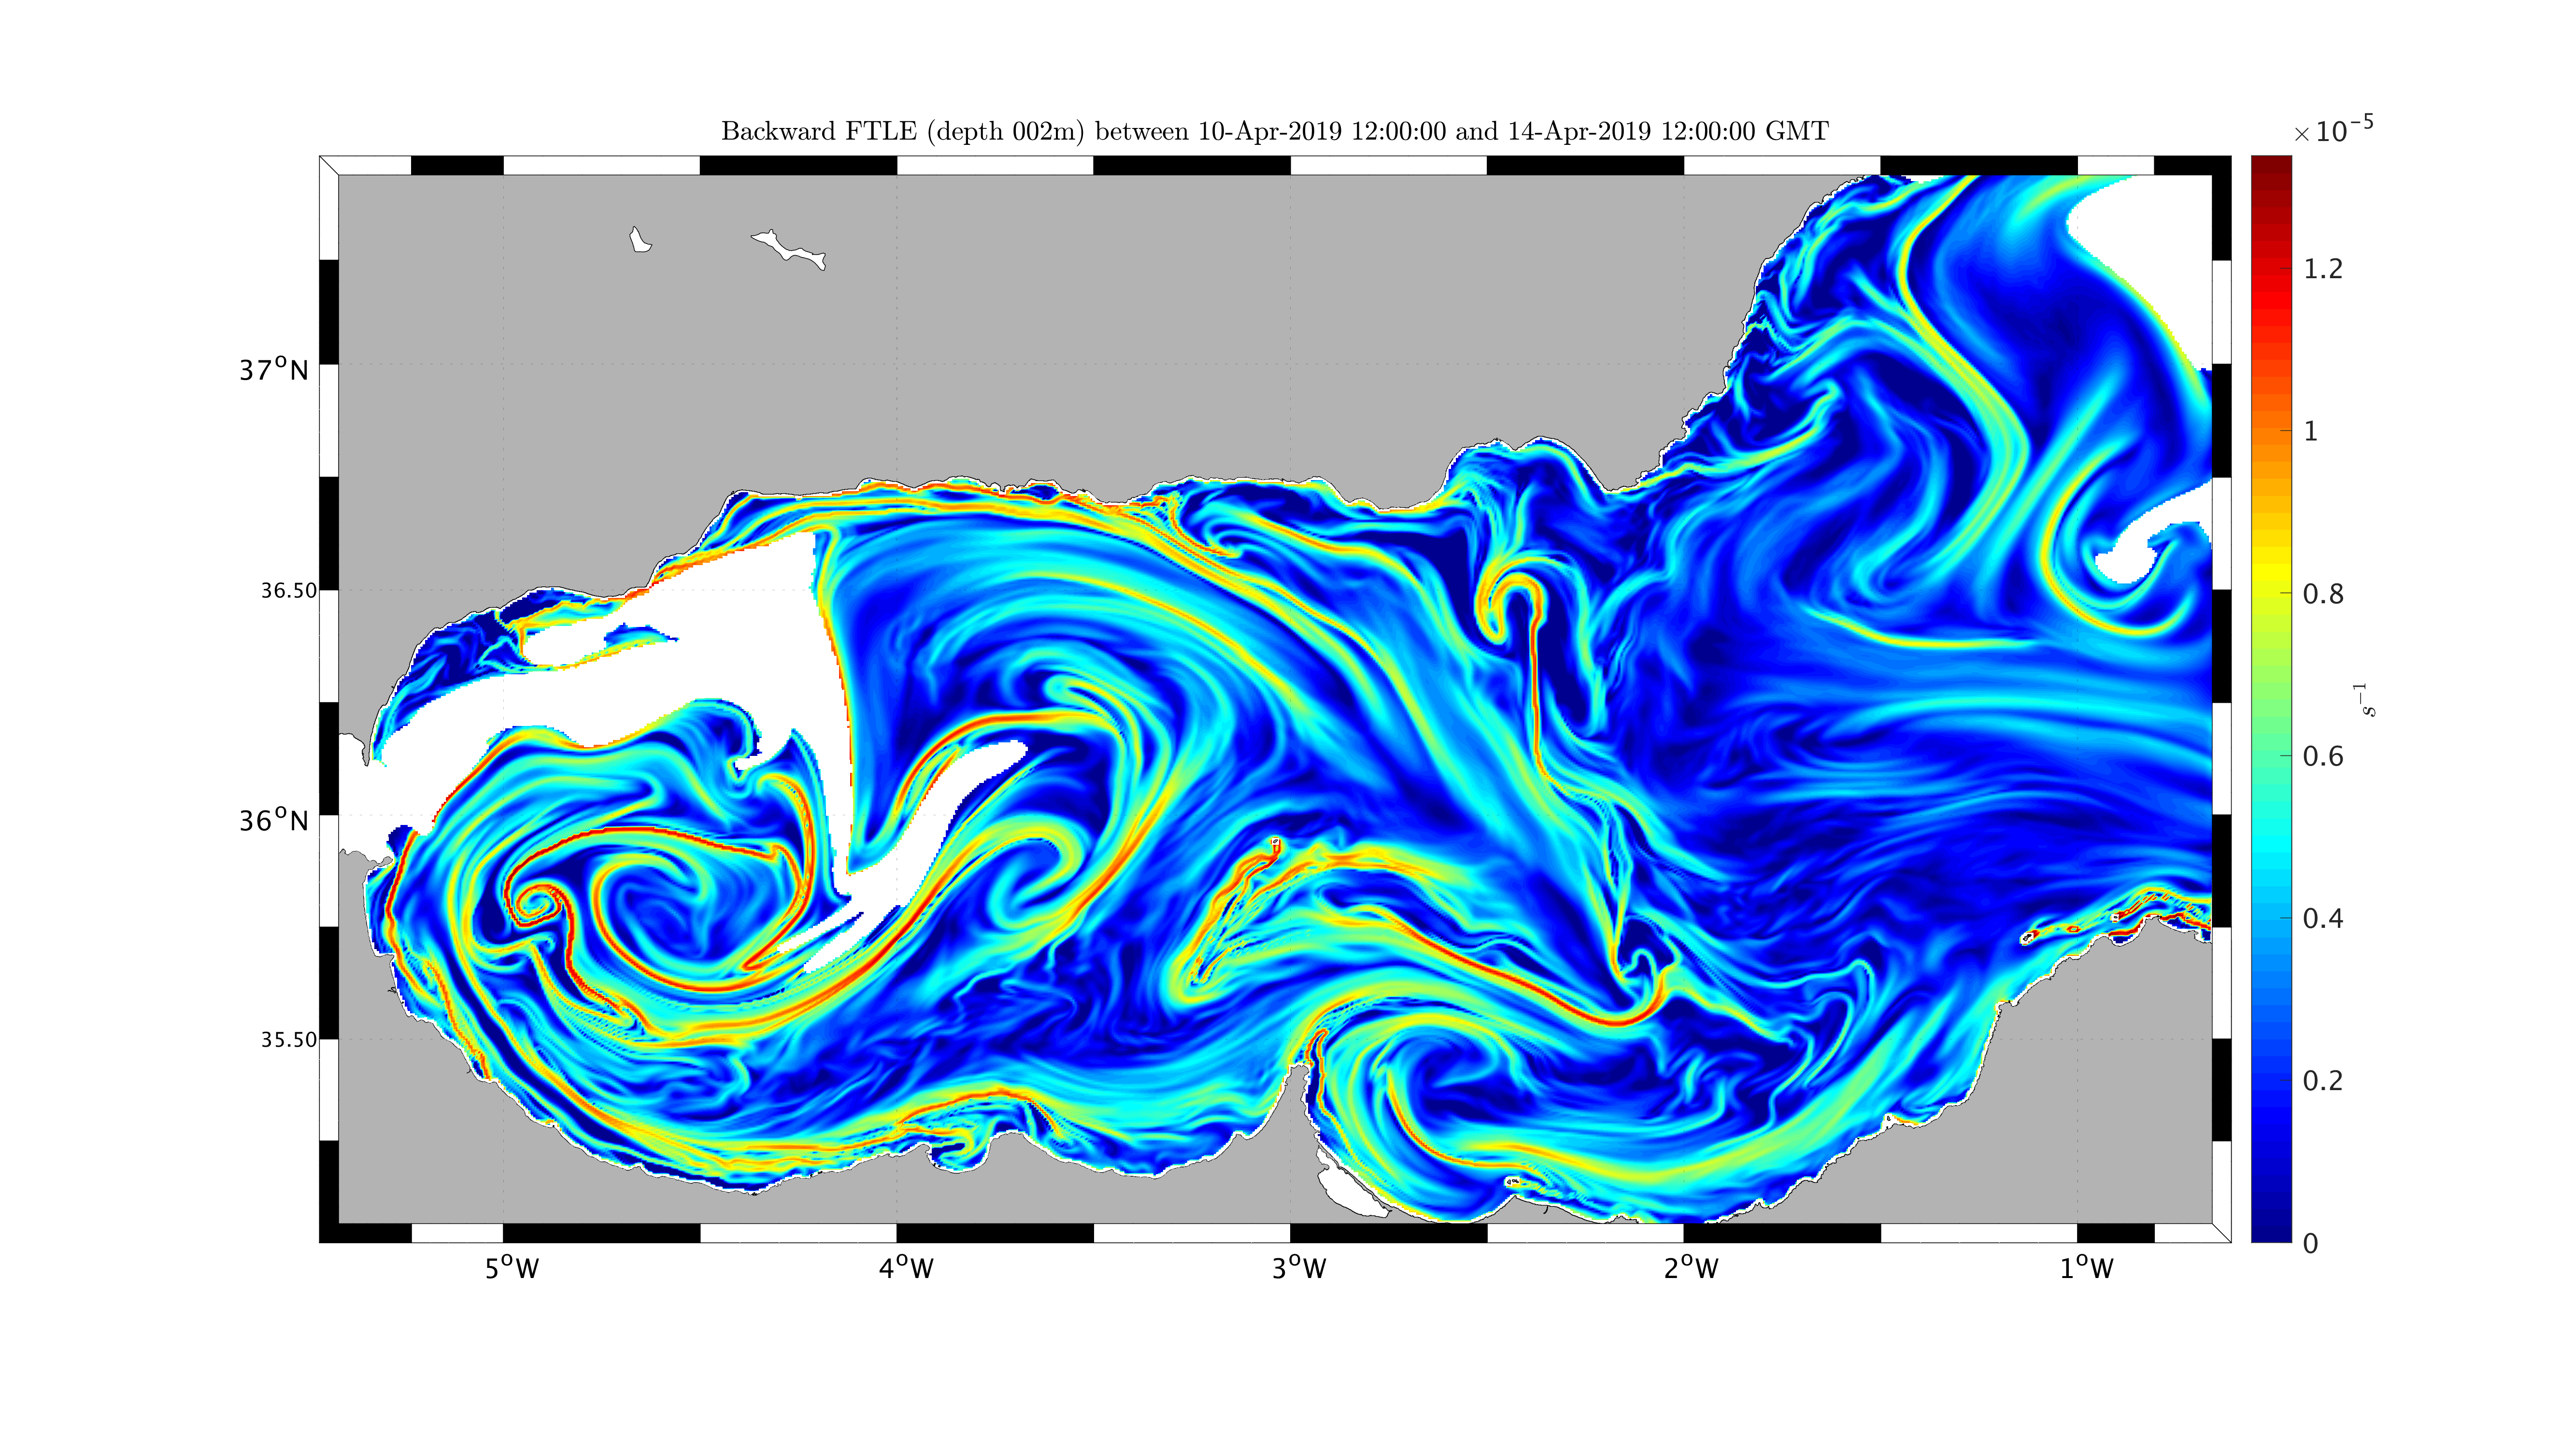
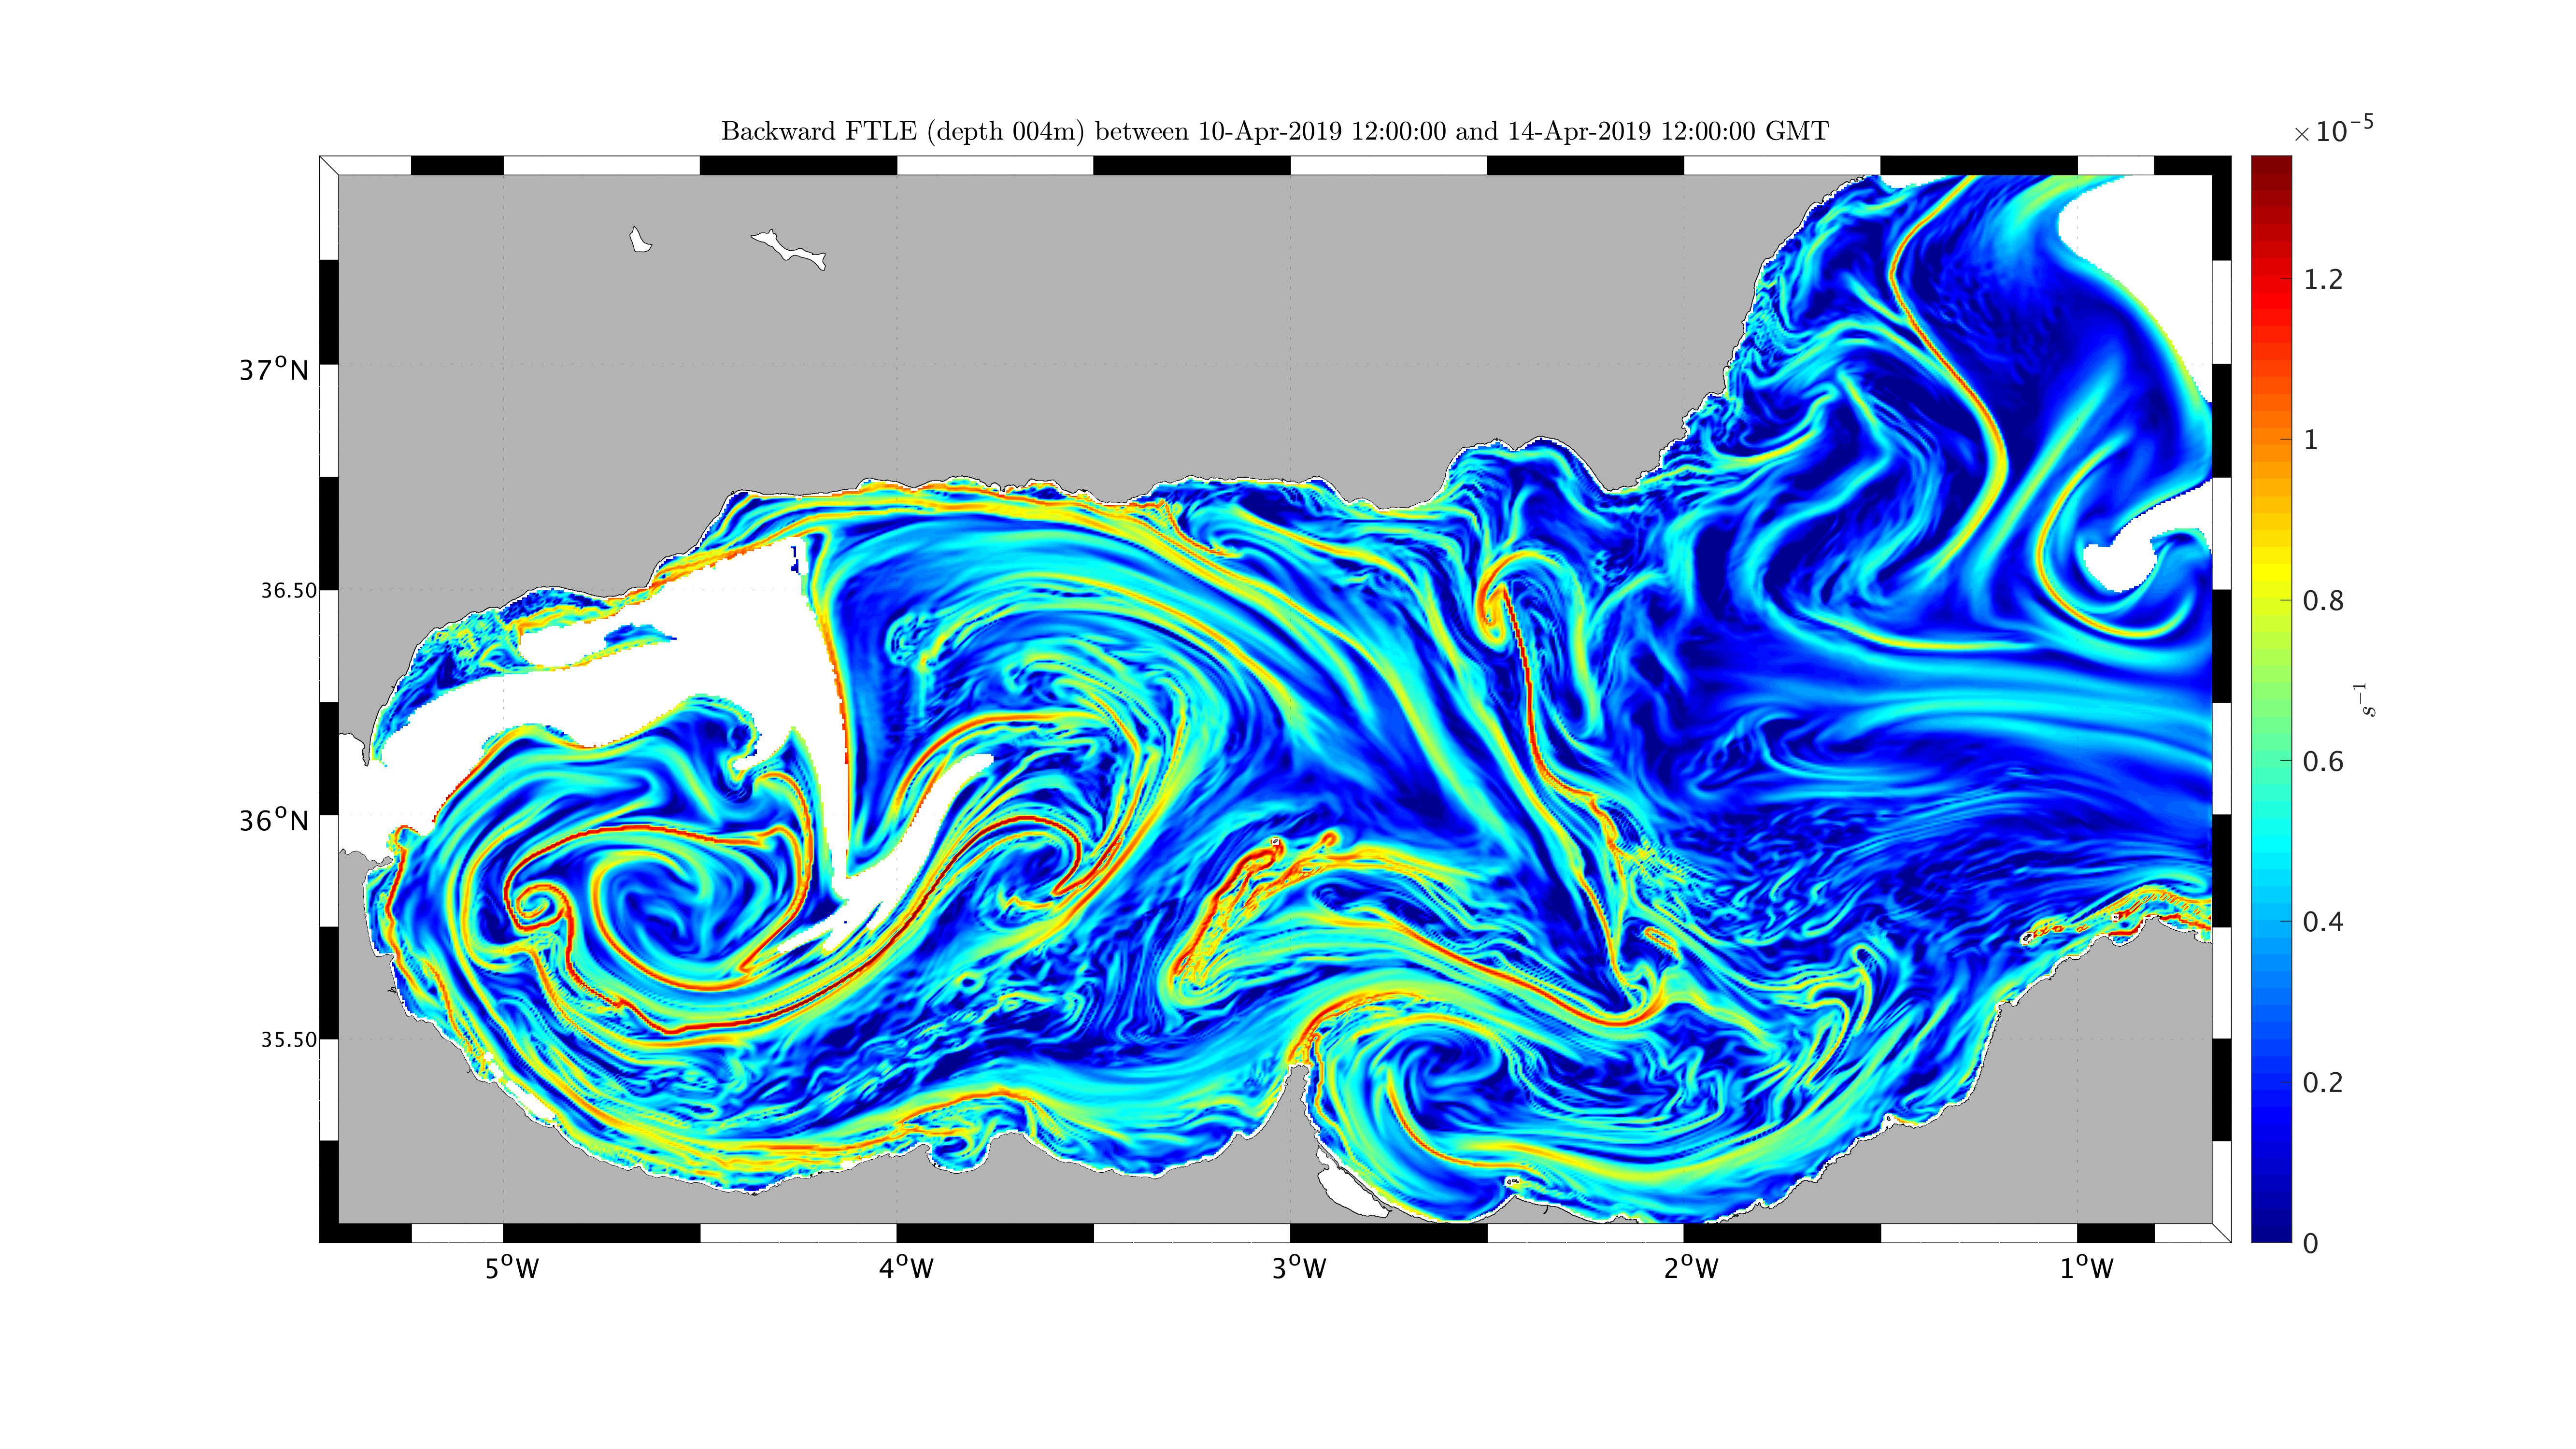
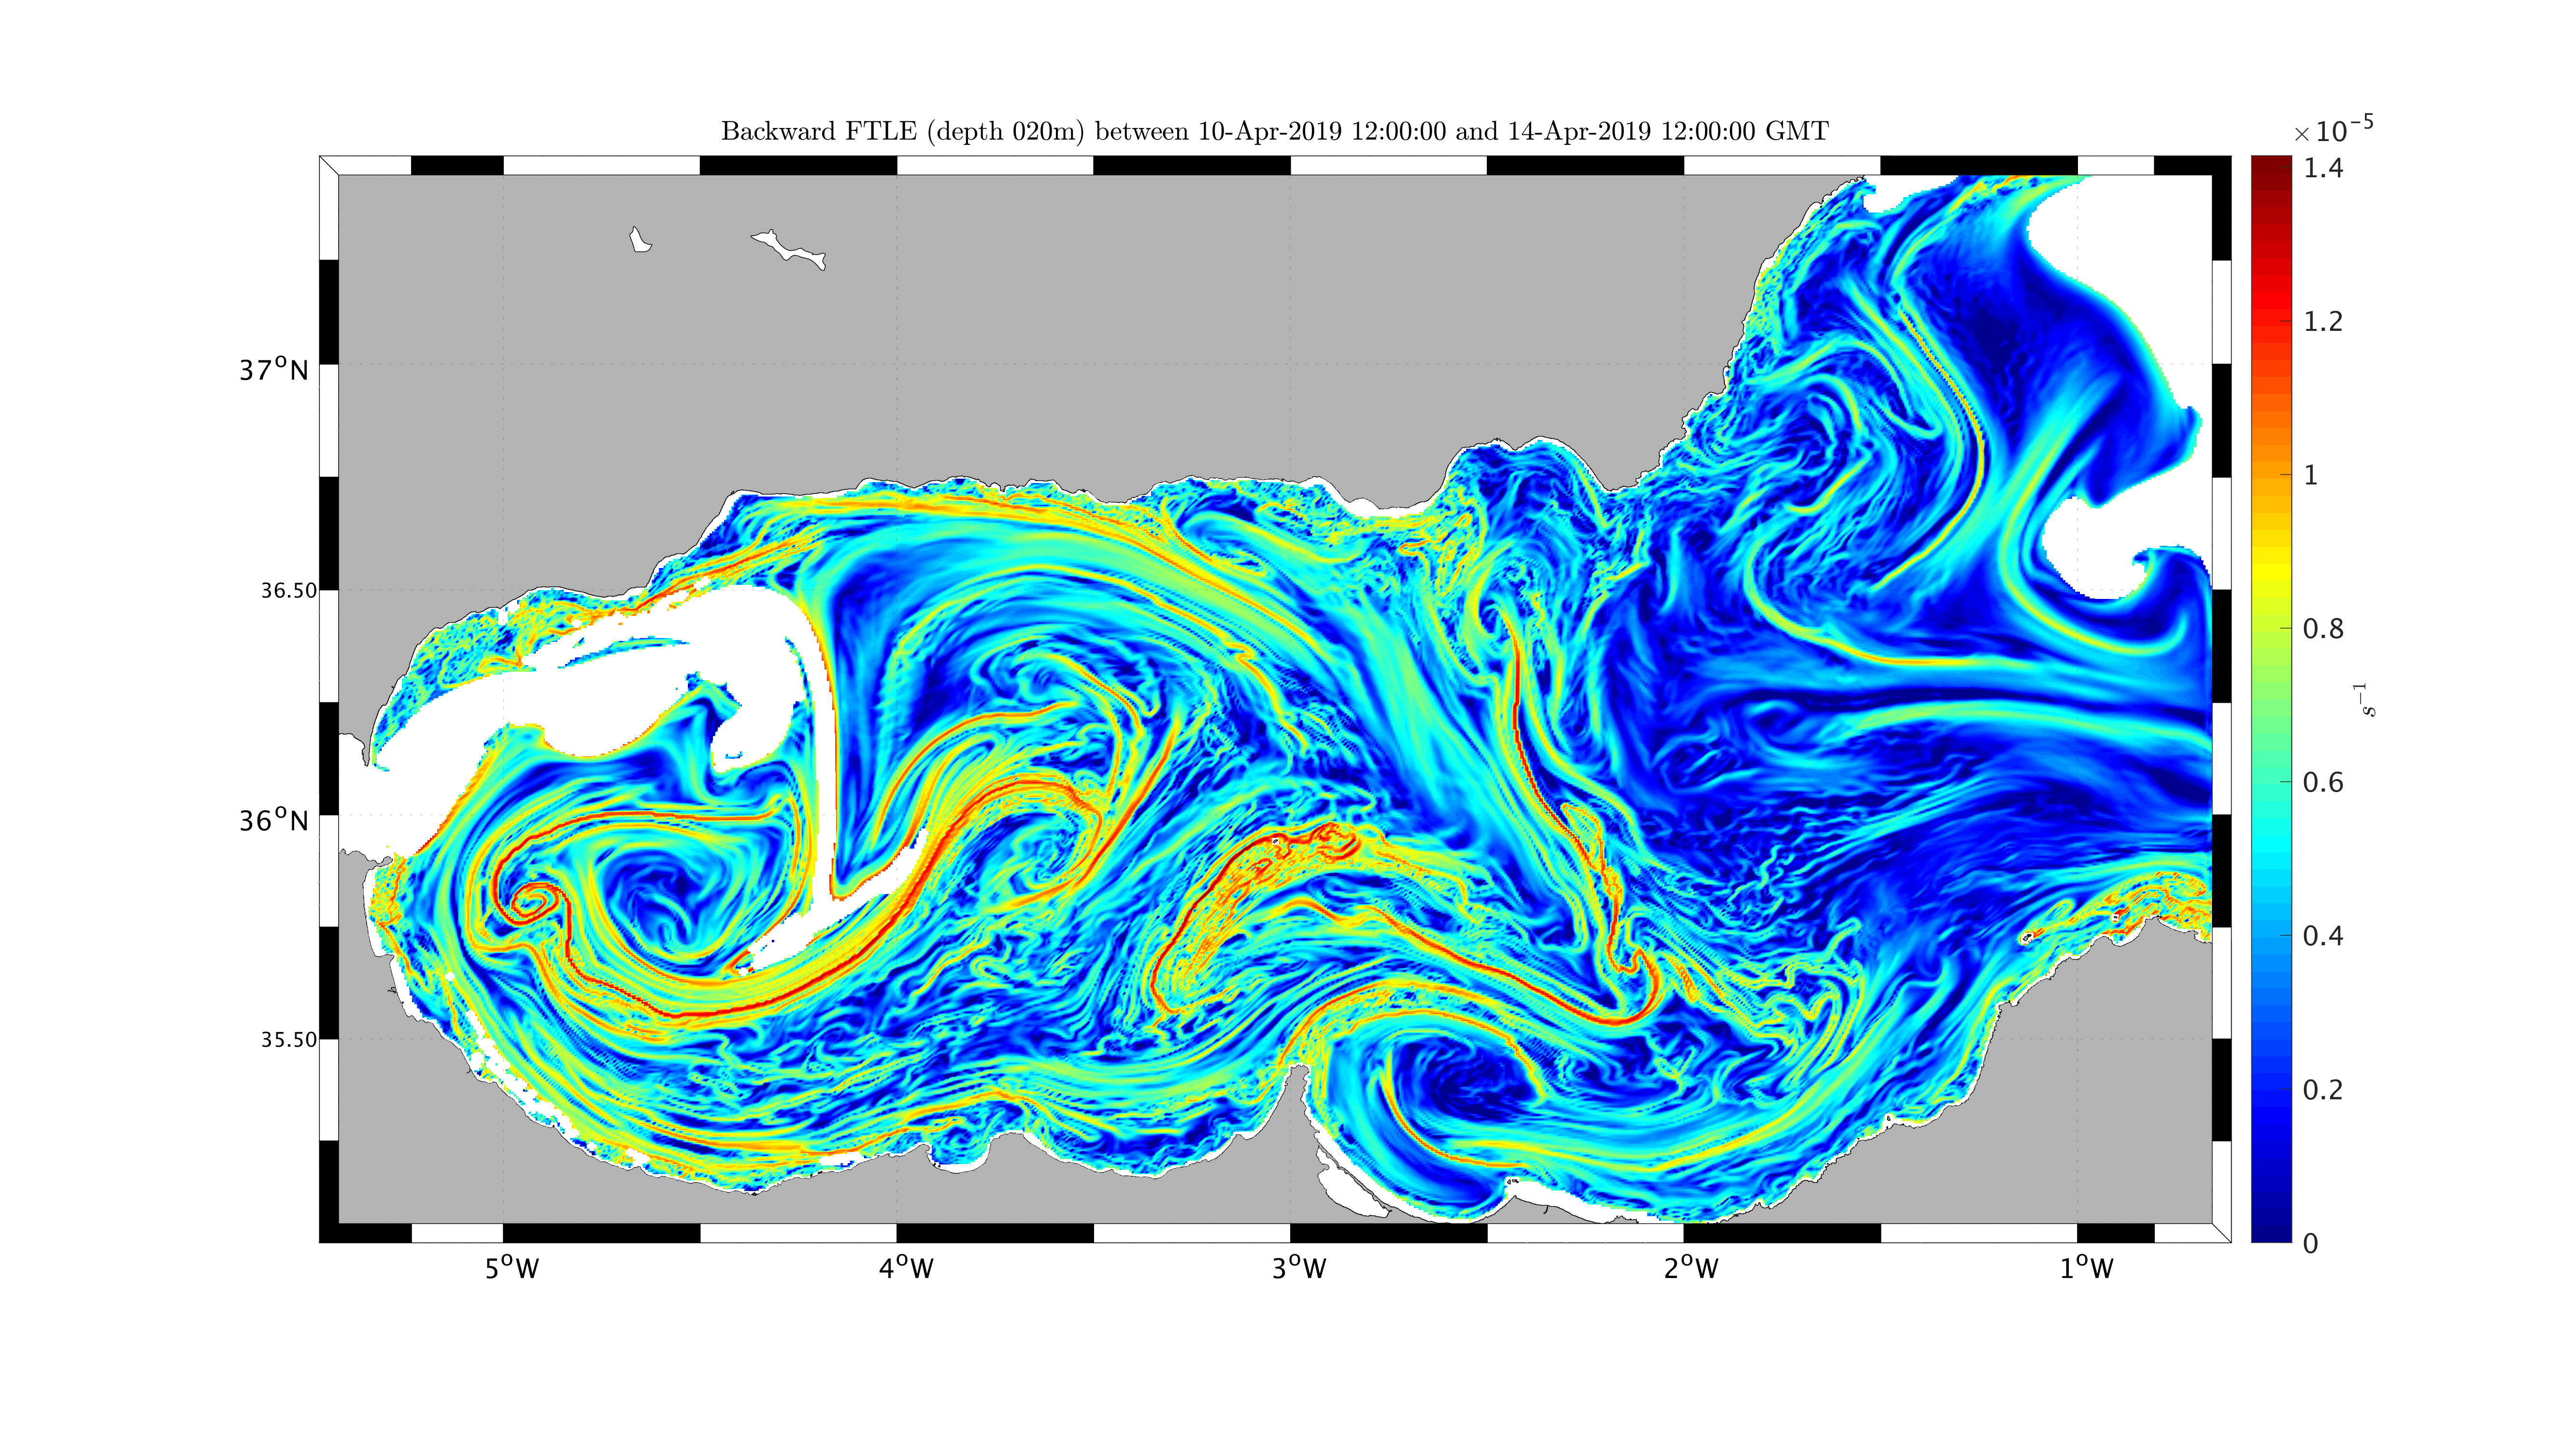
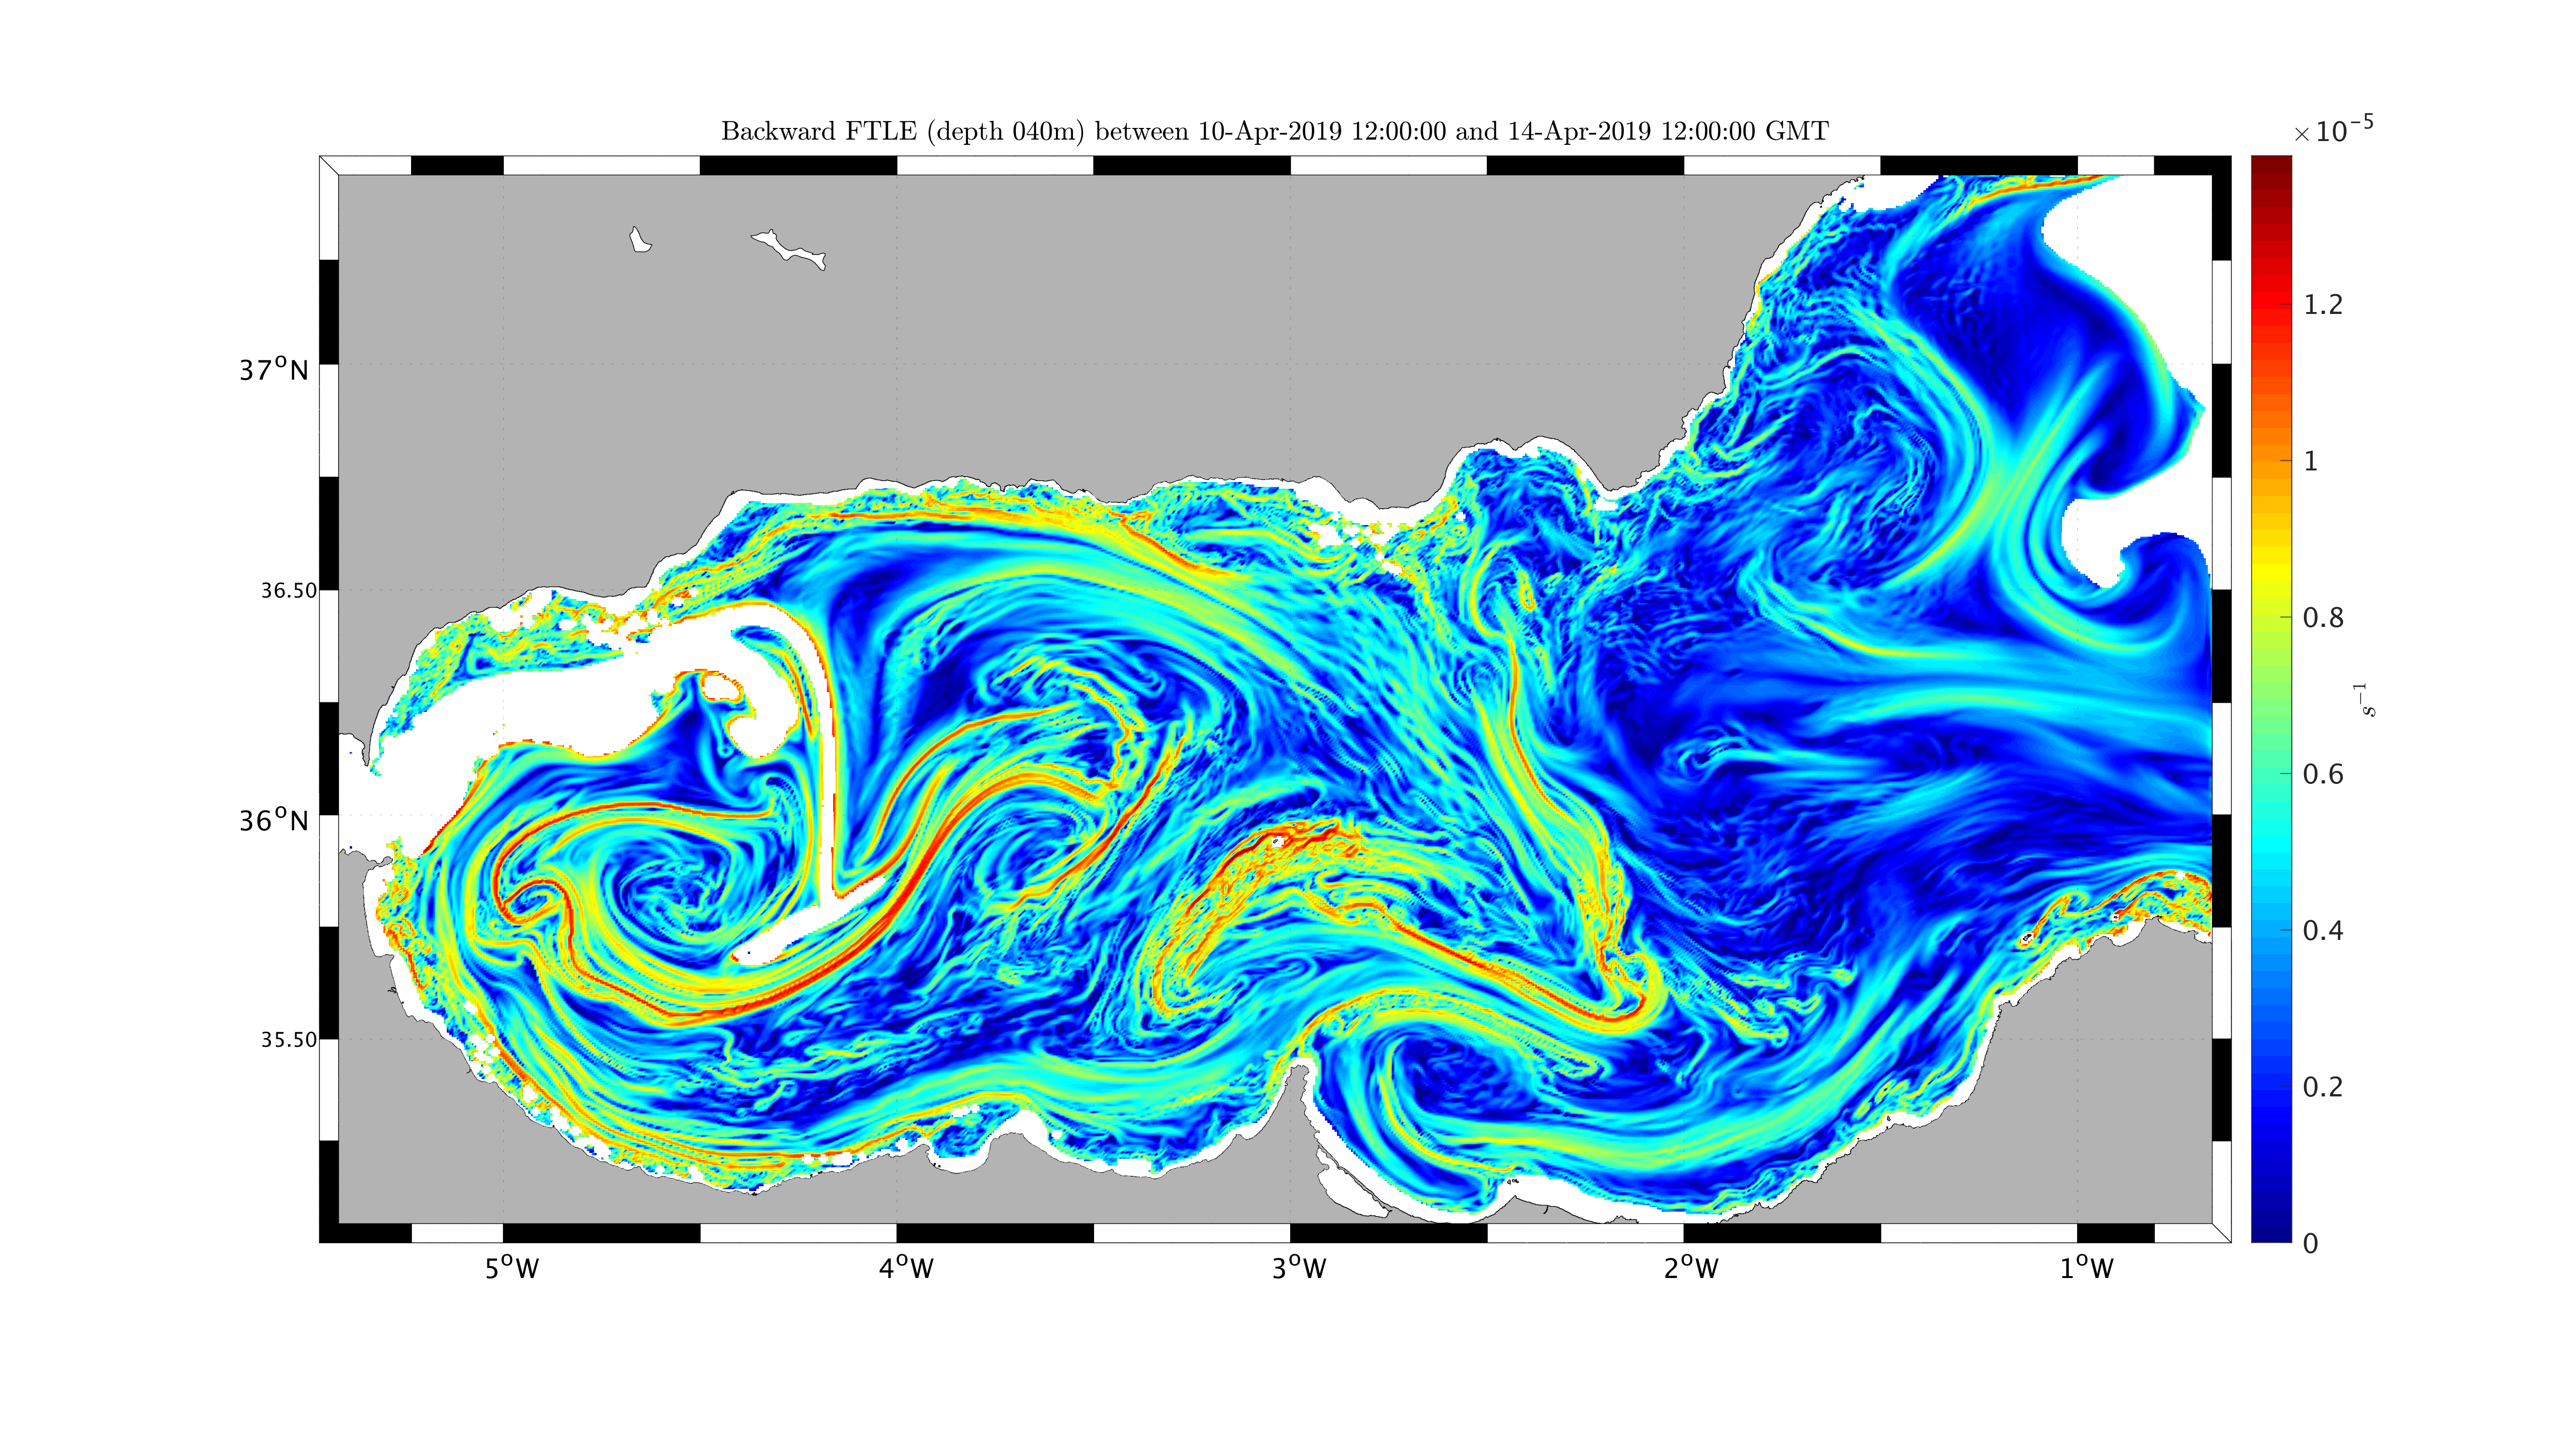
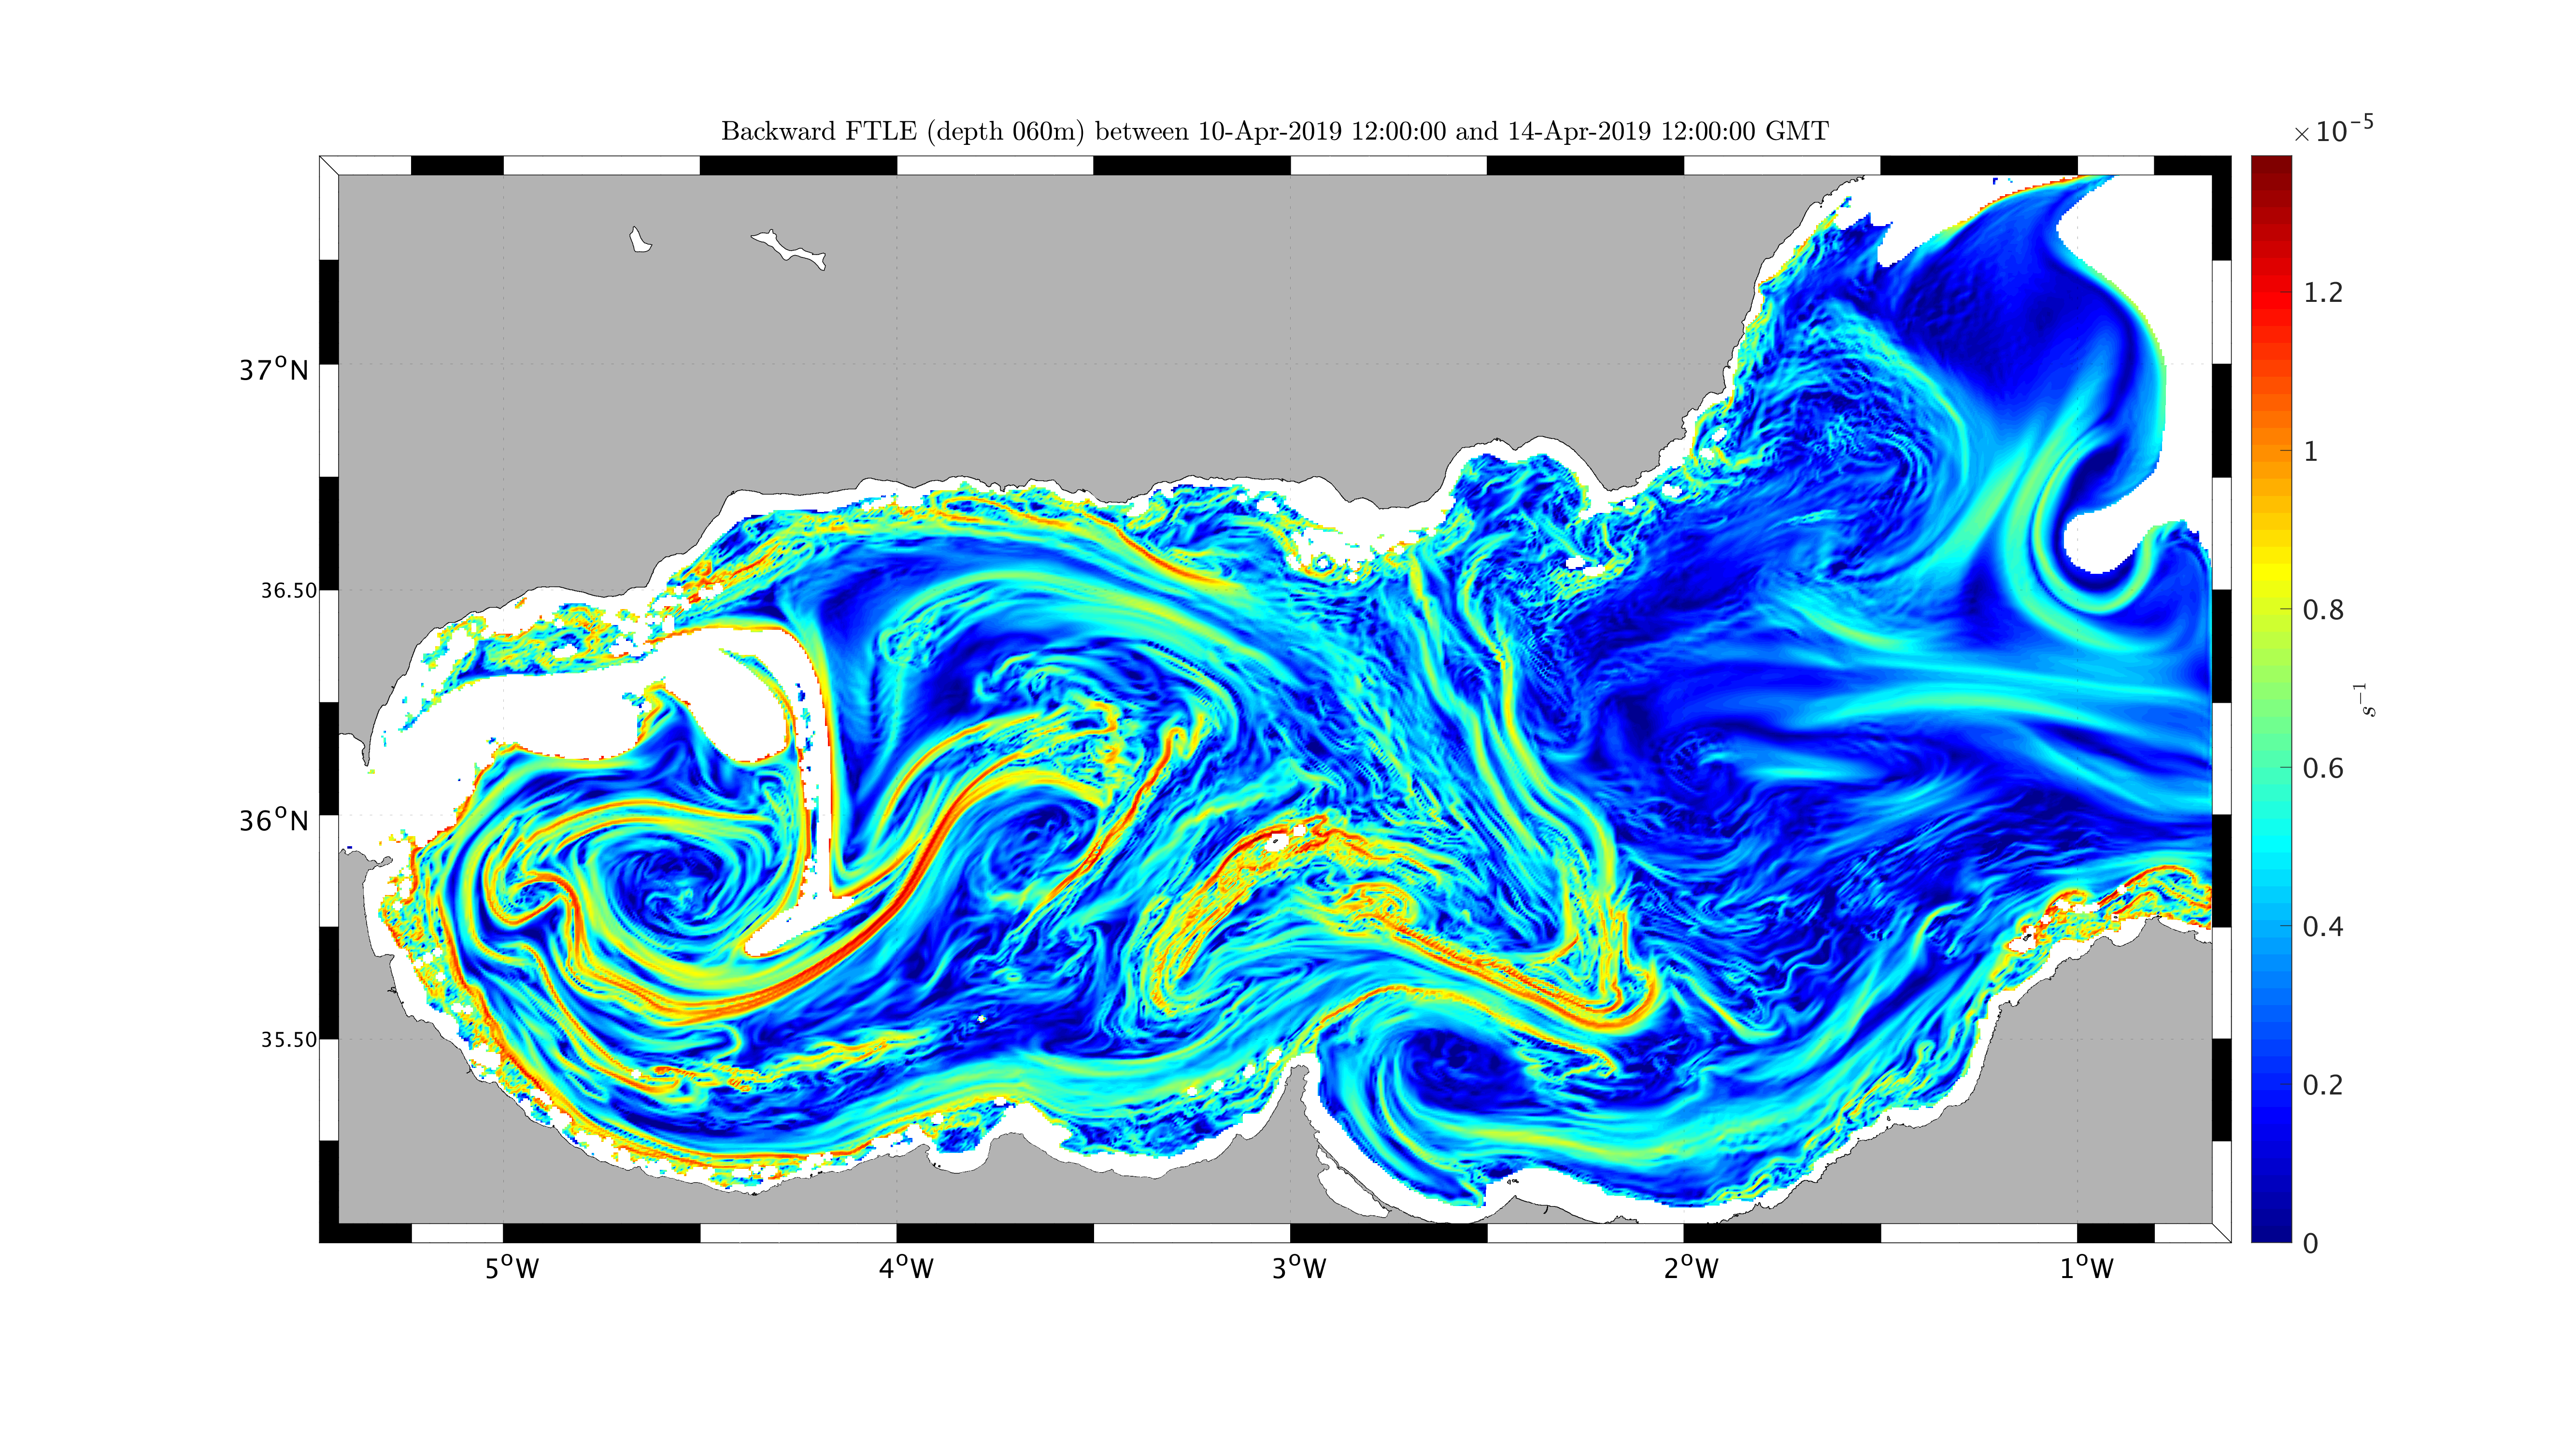
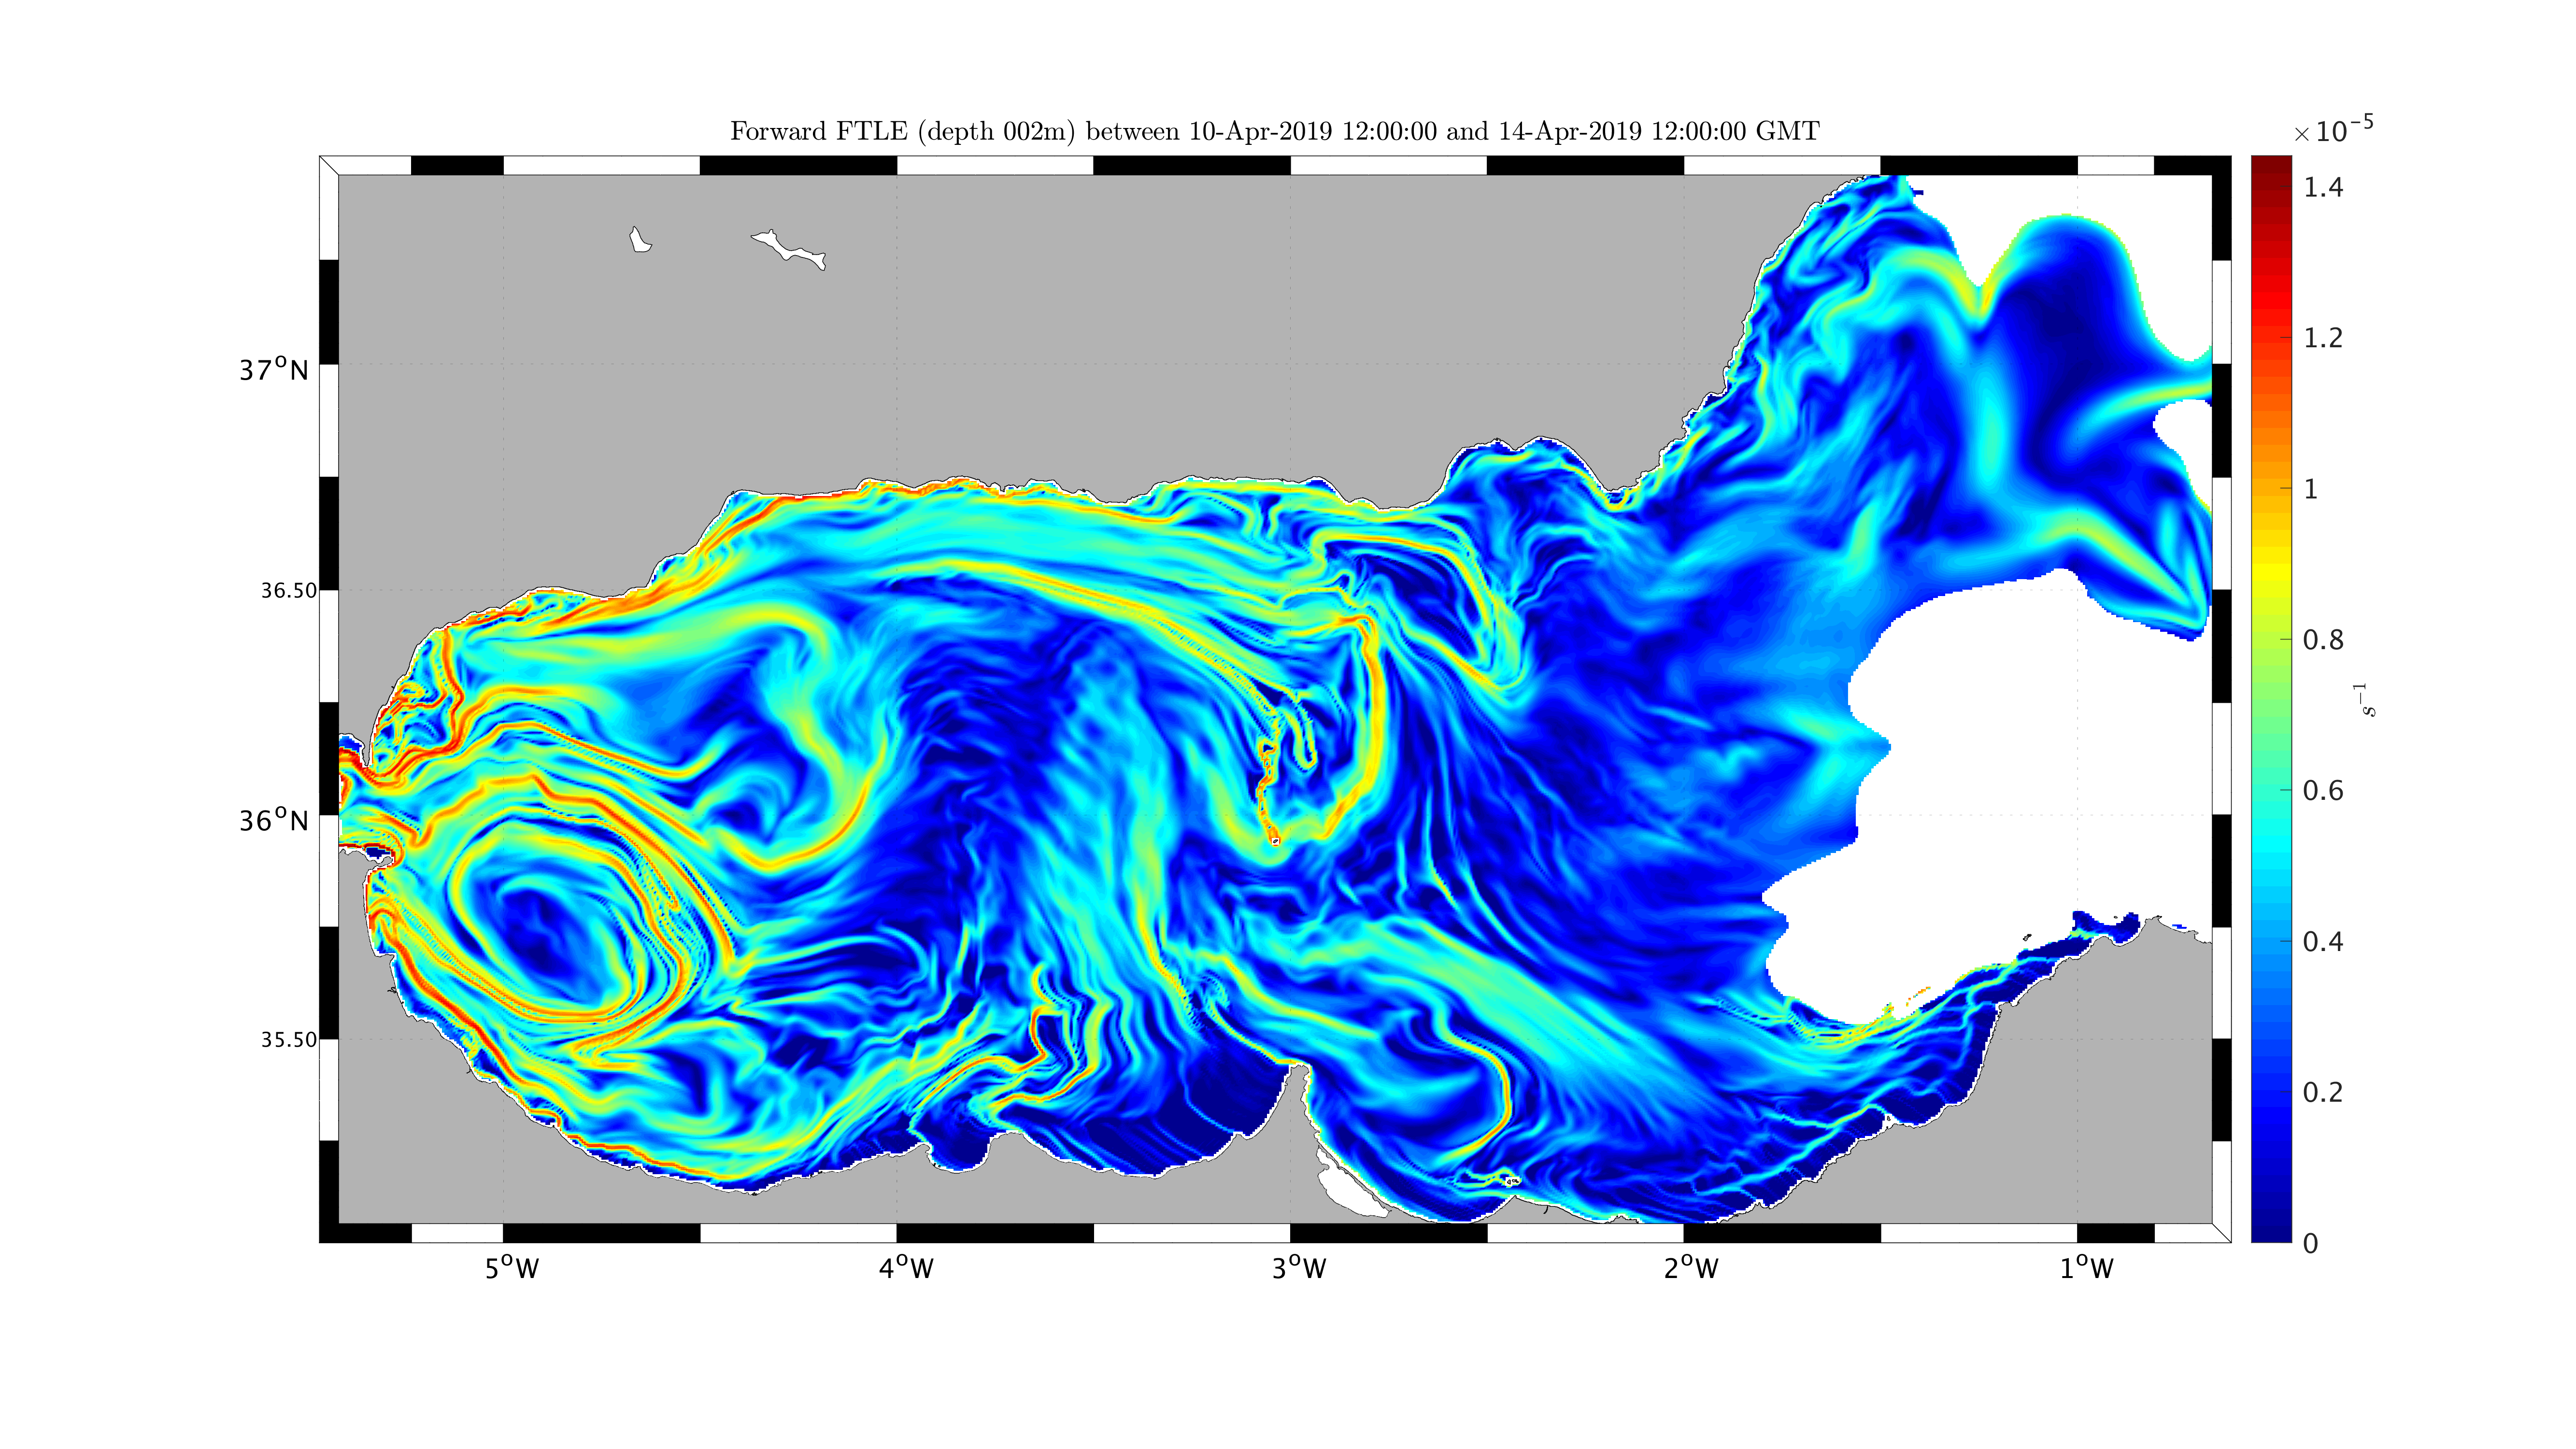
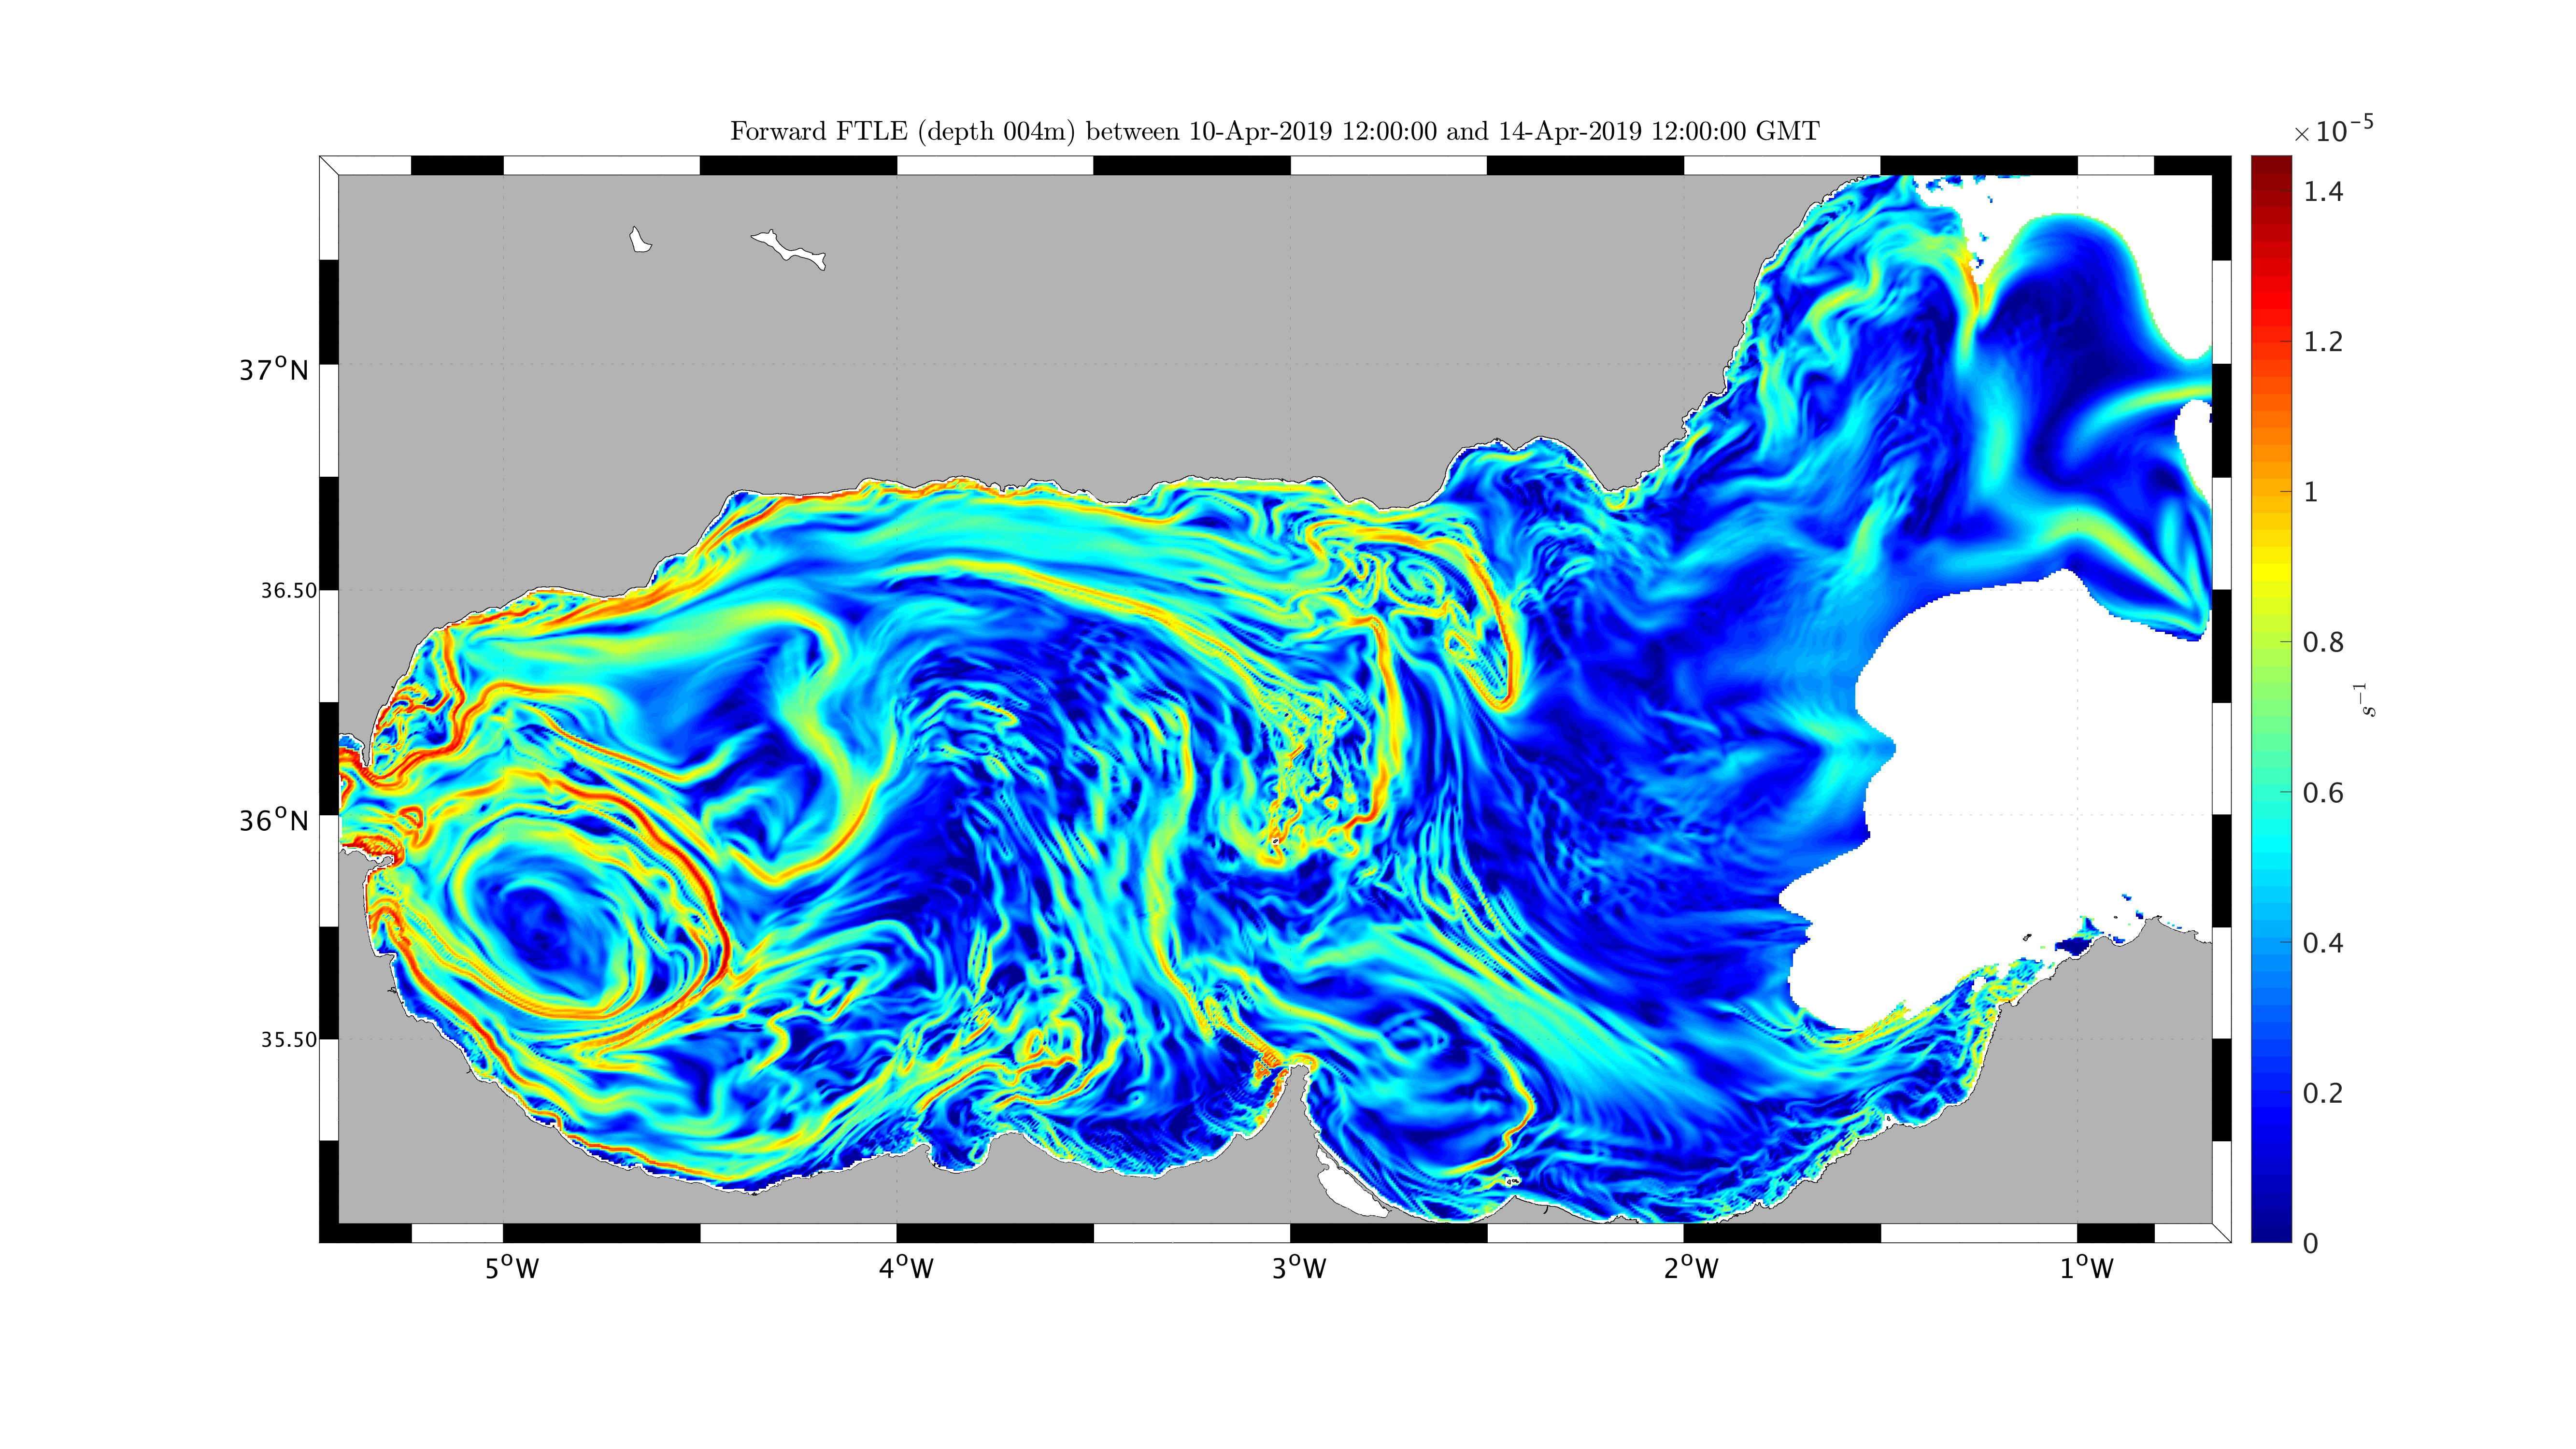
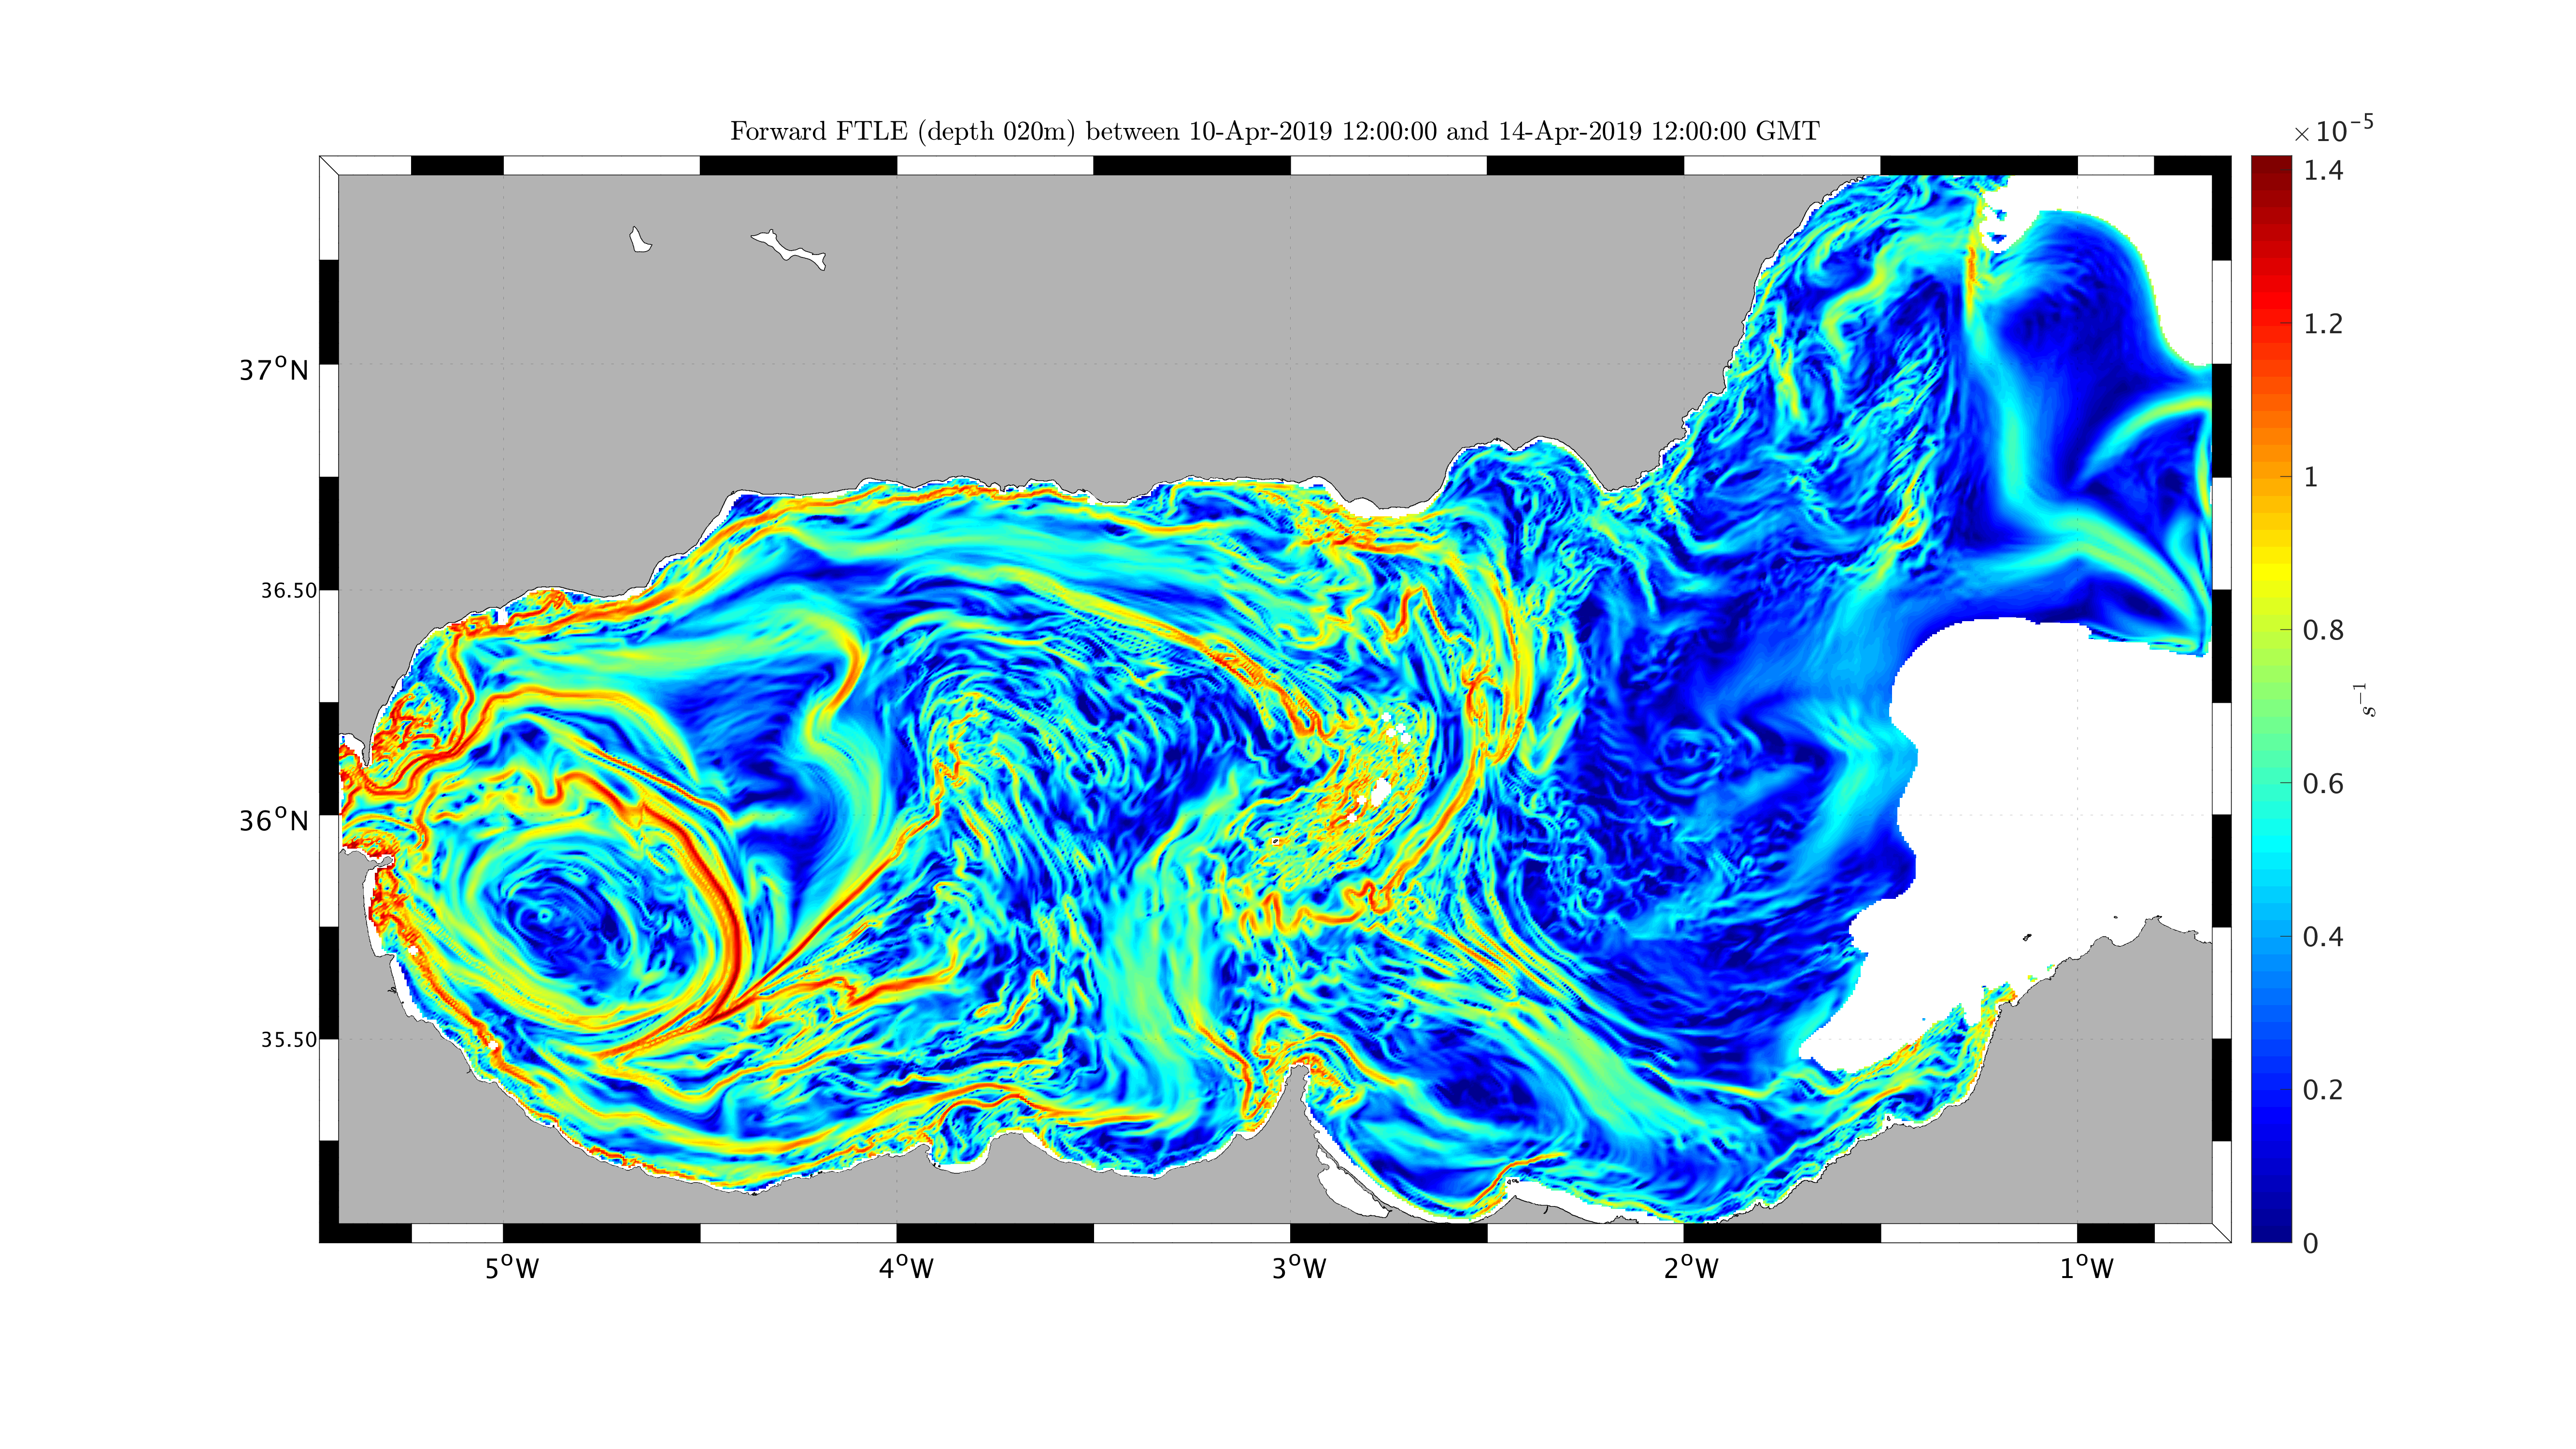
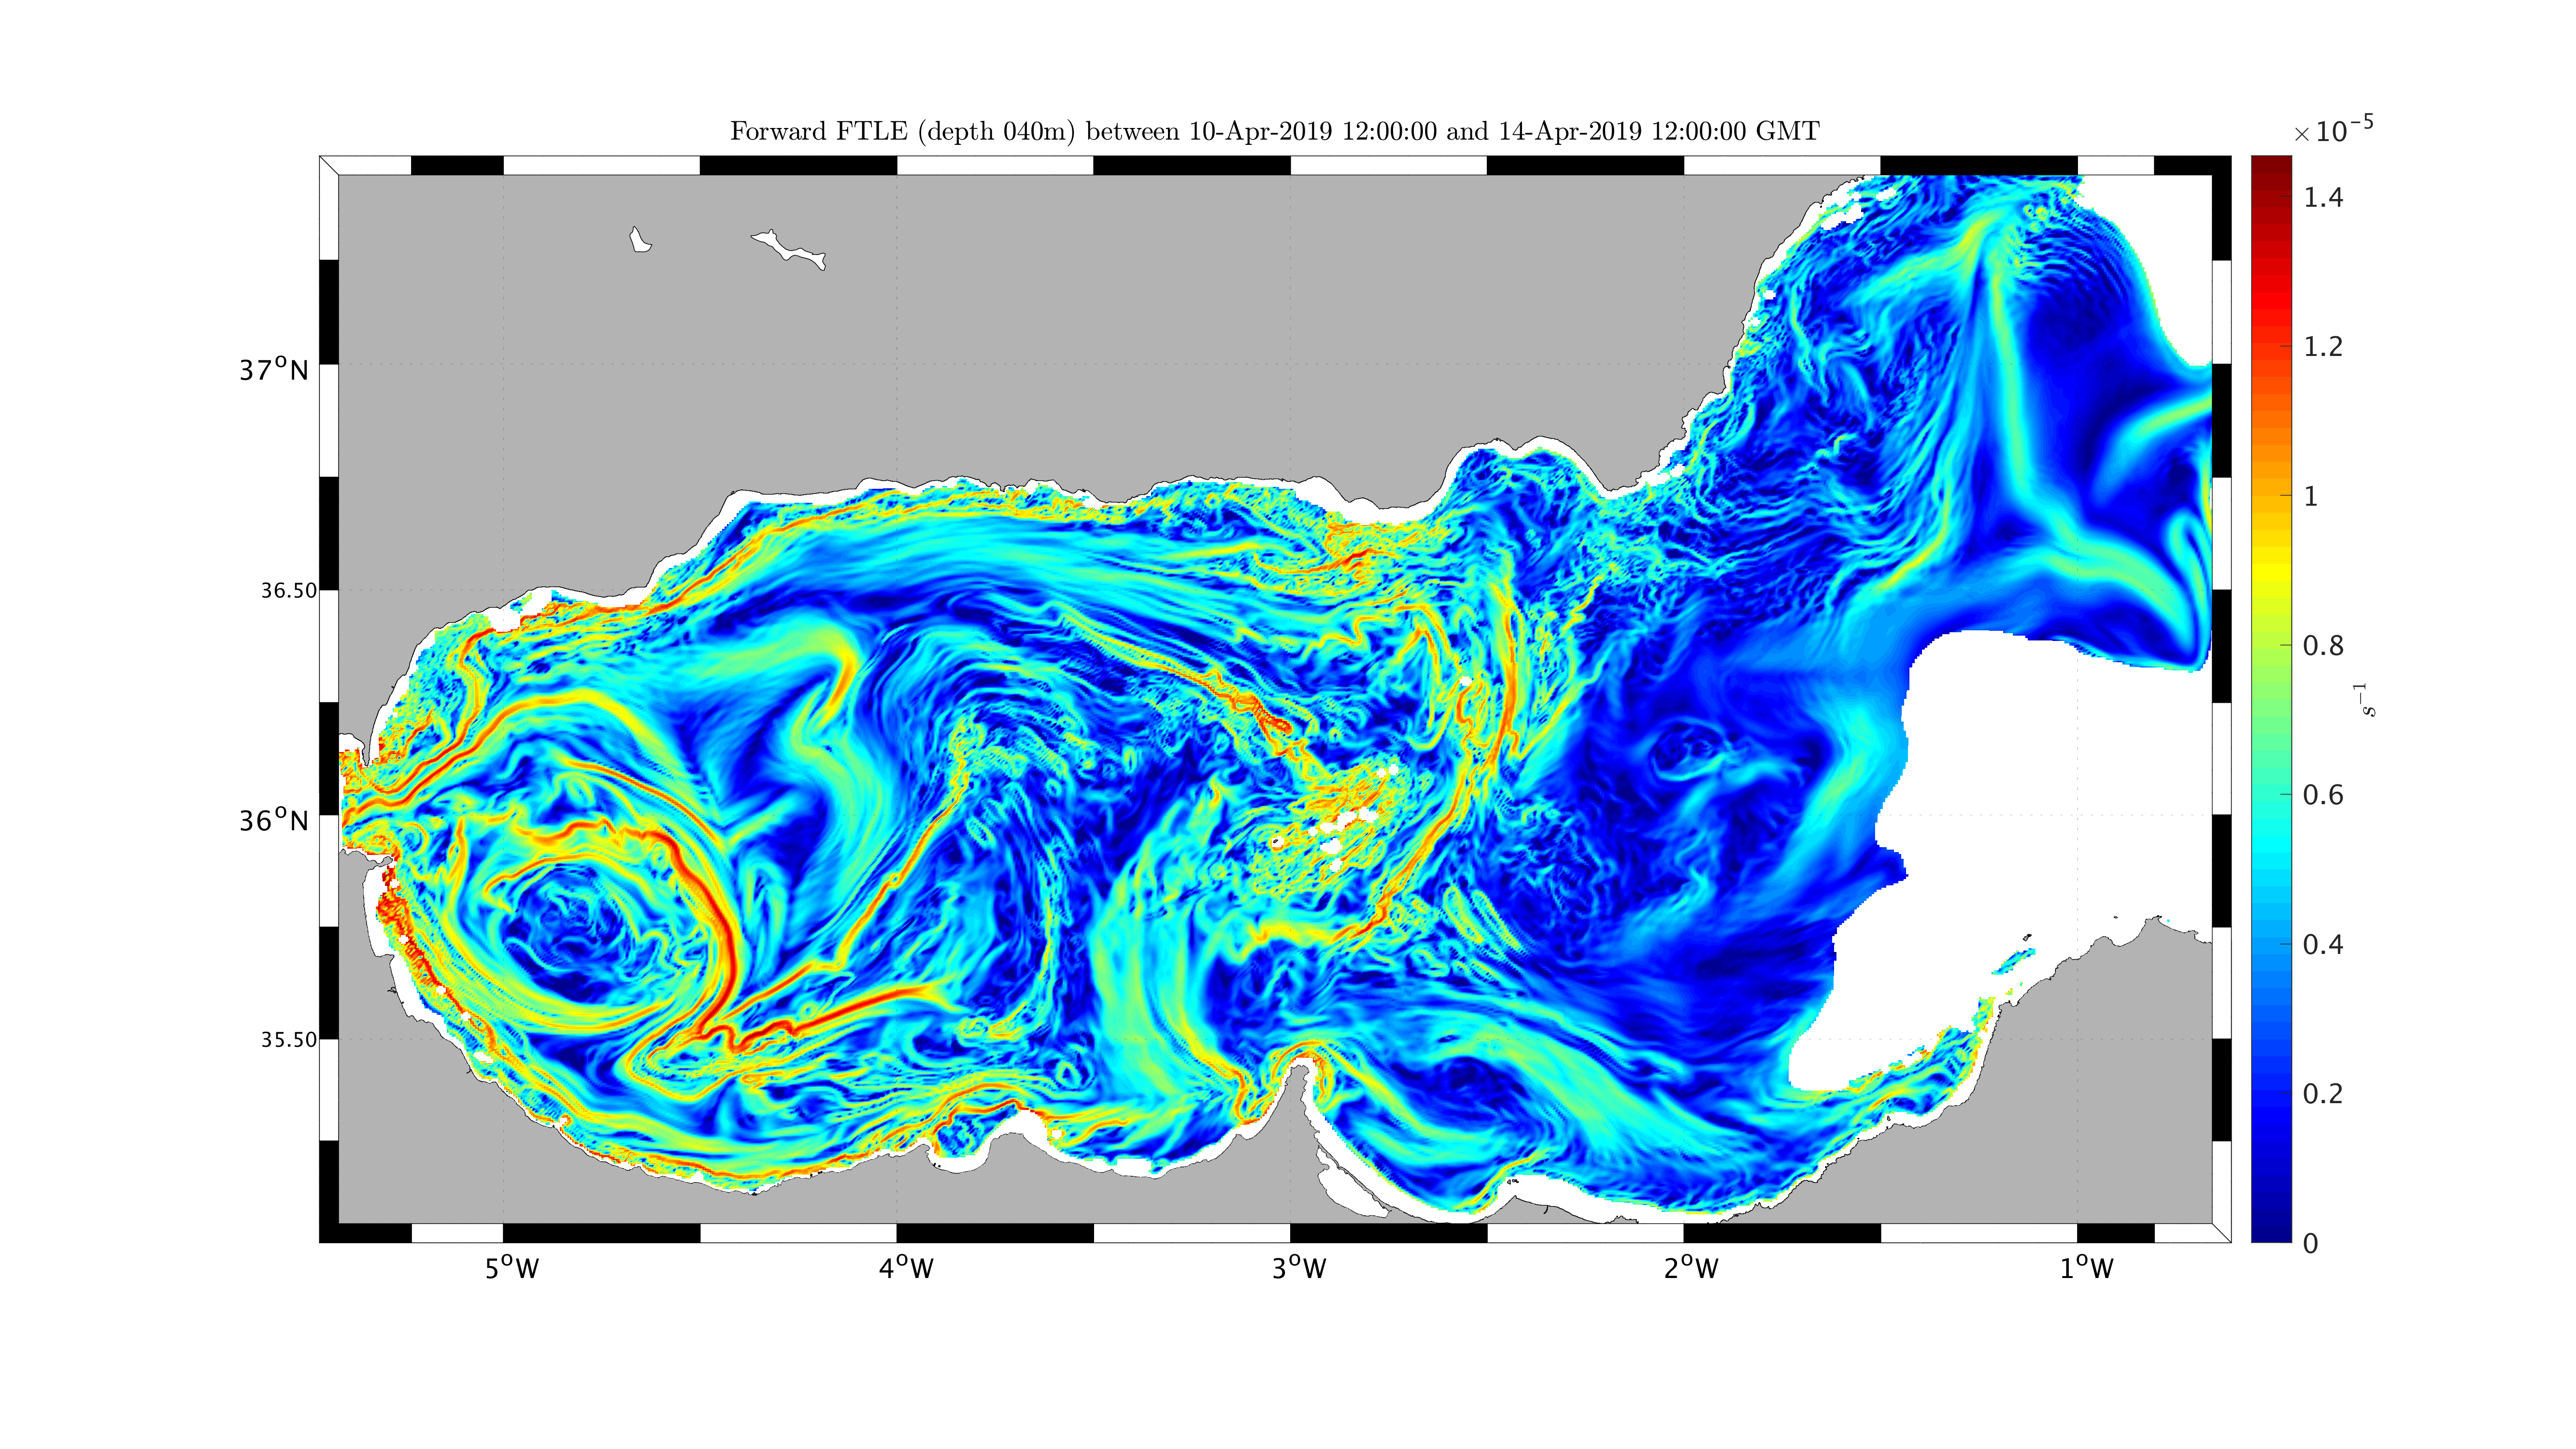
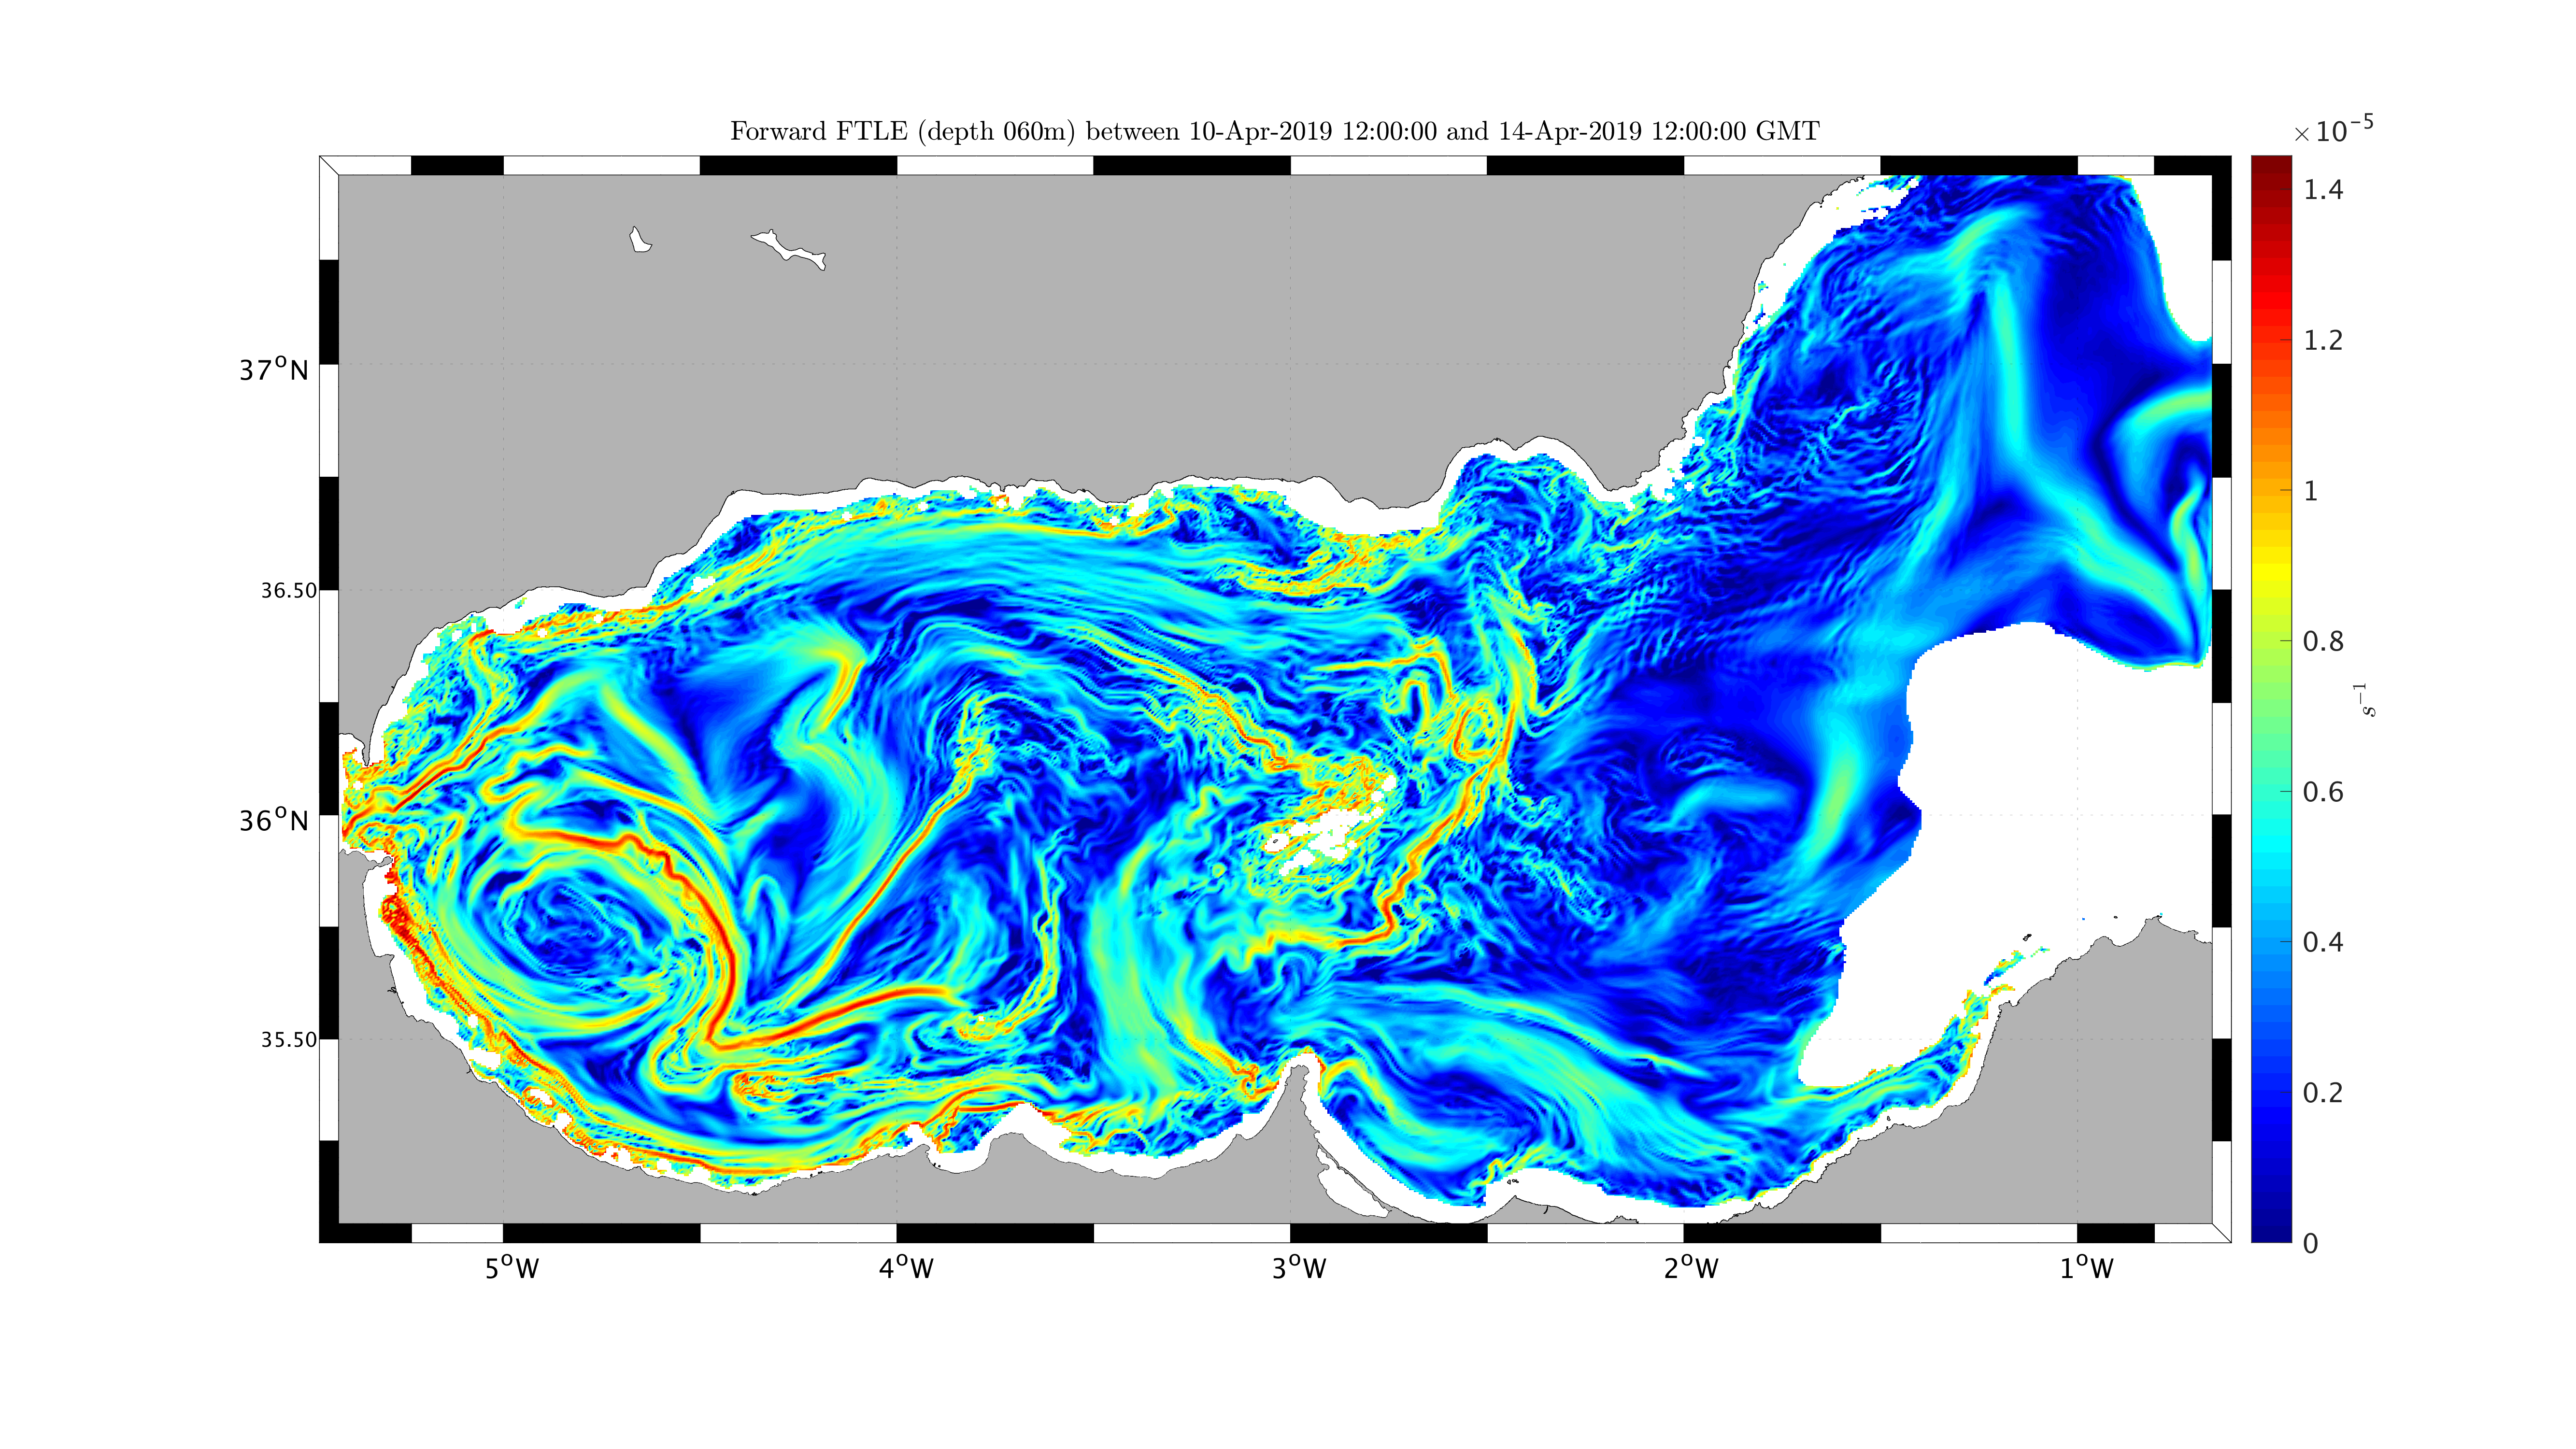
As also shown in the forecast below, the ridges of the forward Finite-Time Lyapunov Exponents (FTLEs) are the repelling FTLE structures: they tend to 'repel' water parcels. Two parcels that are close to each other at t=0 but on different sides of the forward FTLE ridge will advect further away from each other than other parcels. The ridges of the backward FTLEs are the attracting FTLE structures: they tend to 'attract' water parcels.
The figures below illustrate the MSEAS forecast of the dominant 3D subduction pathways (from above 10m depth to deeper than 50m depth) over the period 10 Apr 1200Z to 14 Apr 1200Z 2019. The winds are forecast to remain to the east on average on Apr 10 and part of Apr 11, and of decaying strength. Beyond Apr 11, they are weak. Some limited 3D subduction occurs along frontal structures south of Almeria, as well as on the edges of a weak WAG and of the Atlantic jet (e.g. sinking in thin sheets along convergent/attracting fronts and edges of interacting eddies.). Note there is a direct relation between this 3D subduction (from above 10m depth to deeper than 50m depth) and the 3D attracting Lagrangian Coherent Structures that we forecast (see the maps of the forecast 3D backward FTLE fields).
| Time & Depths | Top View | 3D View | Side View |
|---|---|---|---|
| t0 and upper 10m |
|
|
|
| t0 + 48 hours |
|
|
|
| t0 + 96 hours and water reaching 60m |
|
|
|
Overlaid |
|
|
|
| Depth | 2 m | 4 m | 20 m | 40 m | 60 m |
|---|---|---|---|---|---|
| April 10 - April 14 |
 |
 |
 |
 |
 |
| Depth | 2 m | 4 m | 20 m | 40 m | 60 m |
|---|---|---|---|---|---|
| April 10 - April 14 |
 |
 |
 |
 |
 |
| Return to the MSEAS: | ||
| CALYPSO real-time web page | CALYPSO web page | Home page |