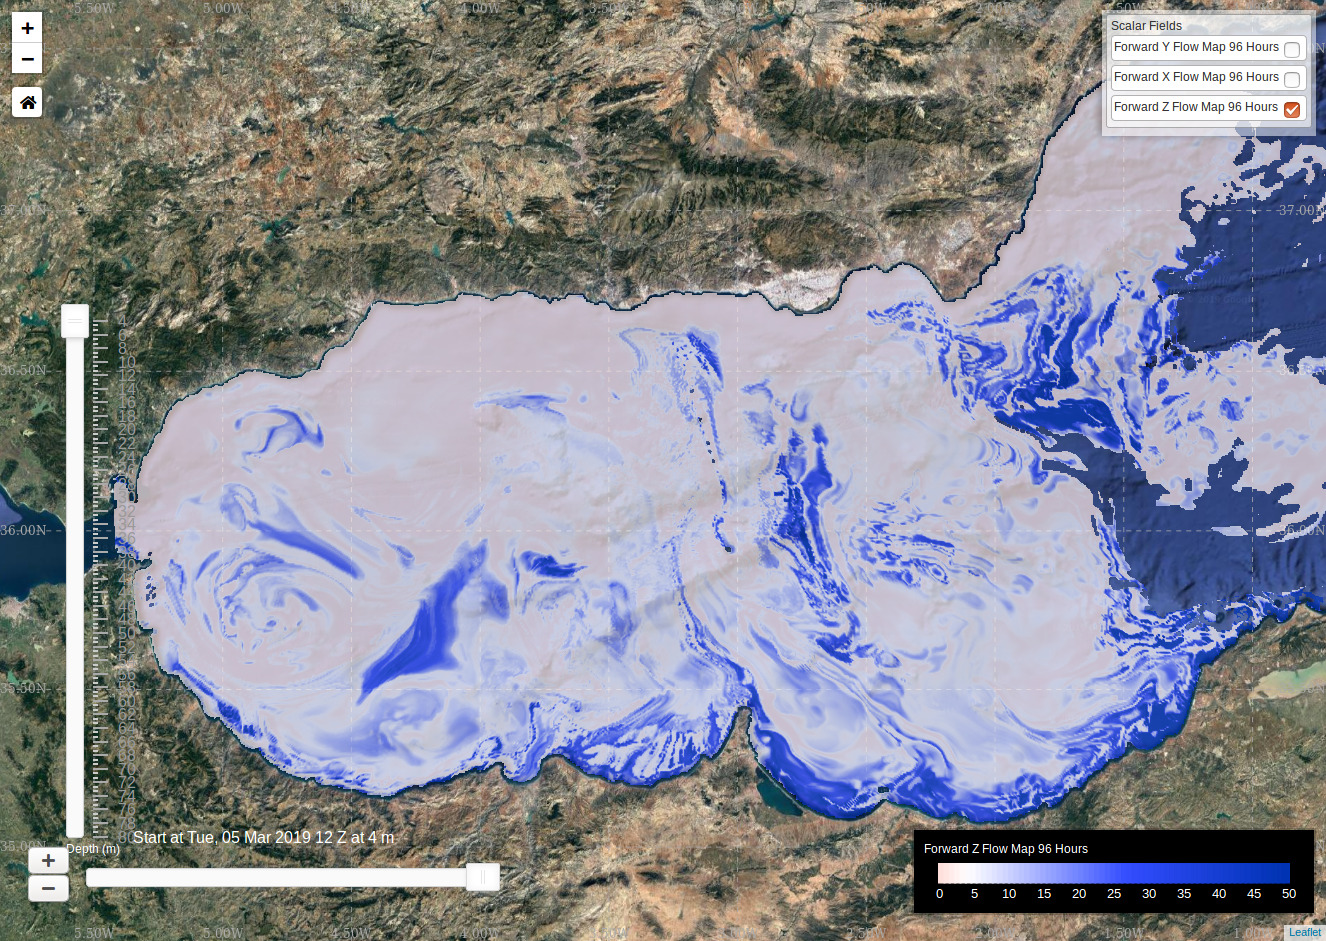
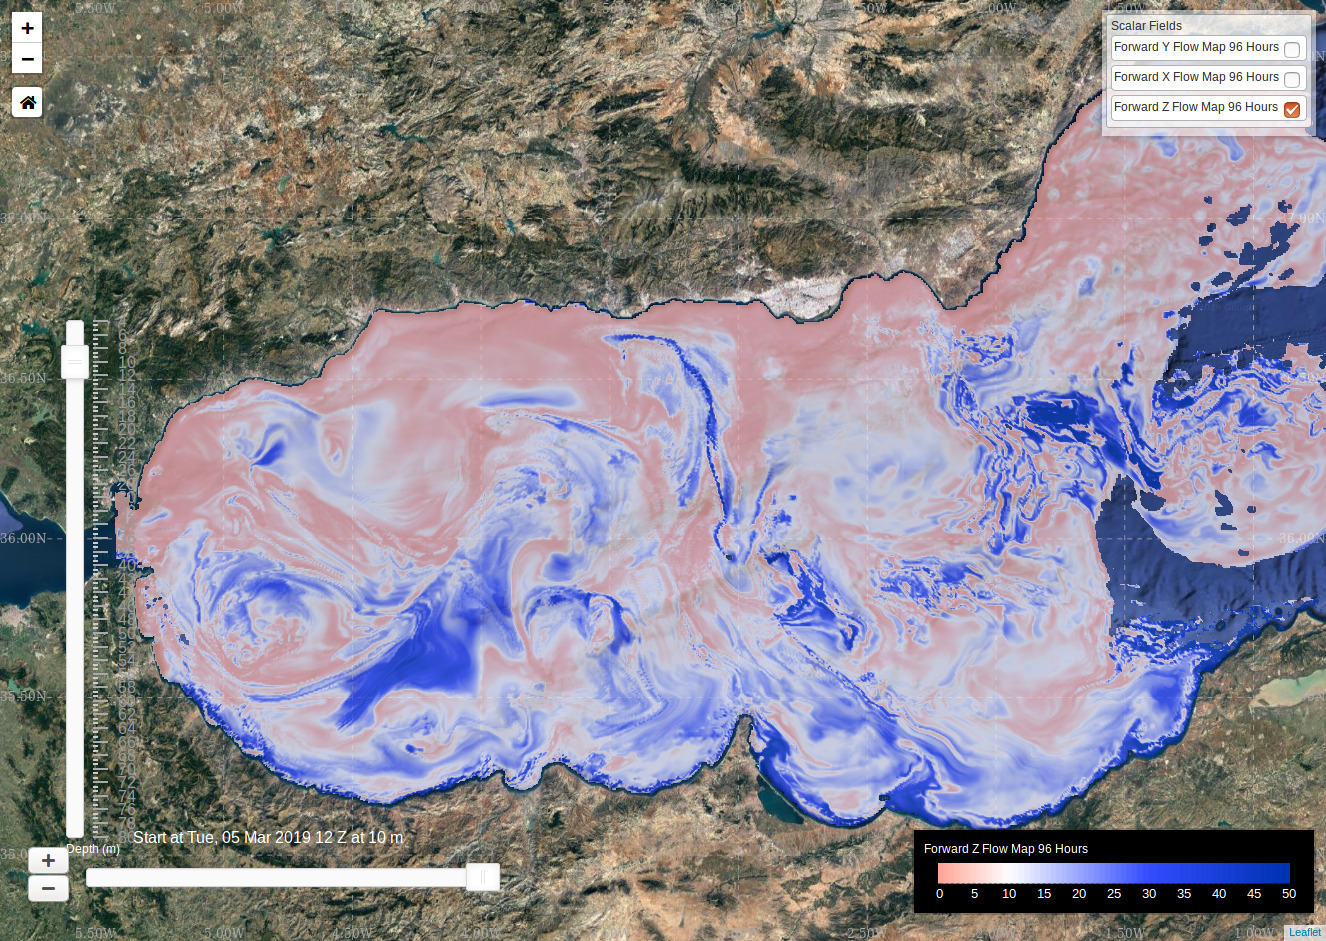
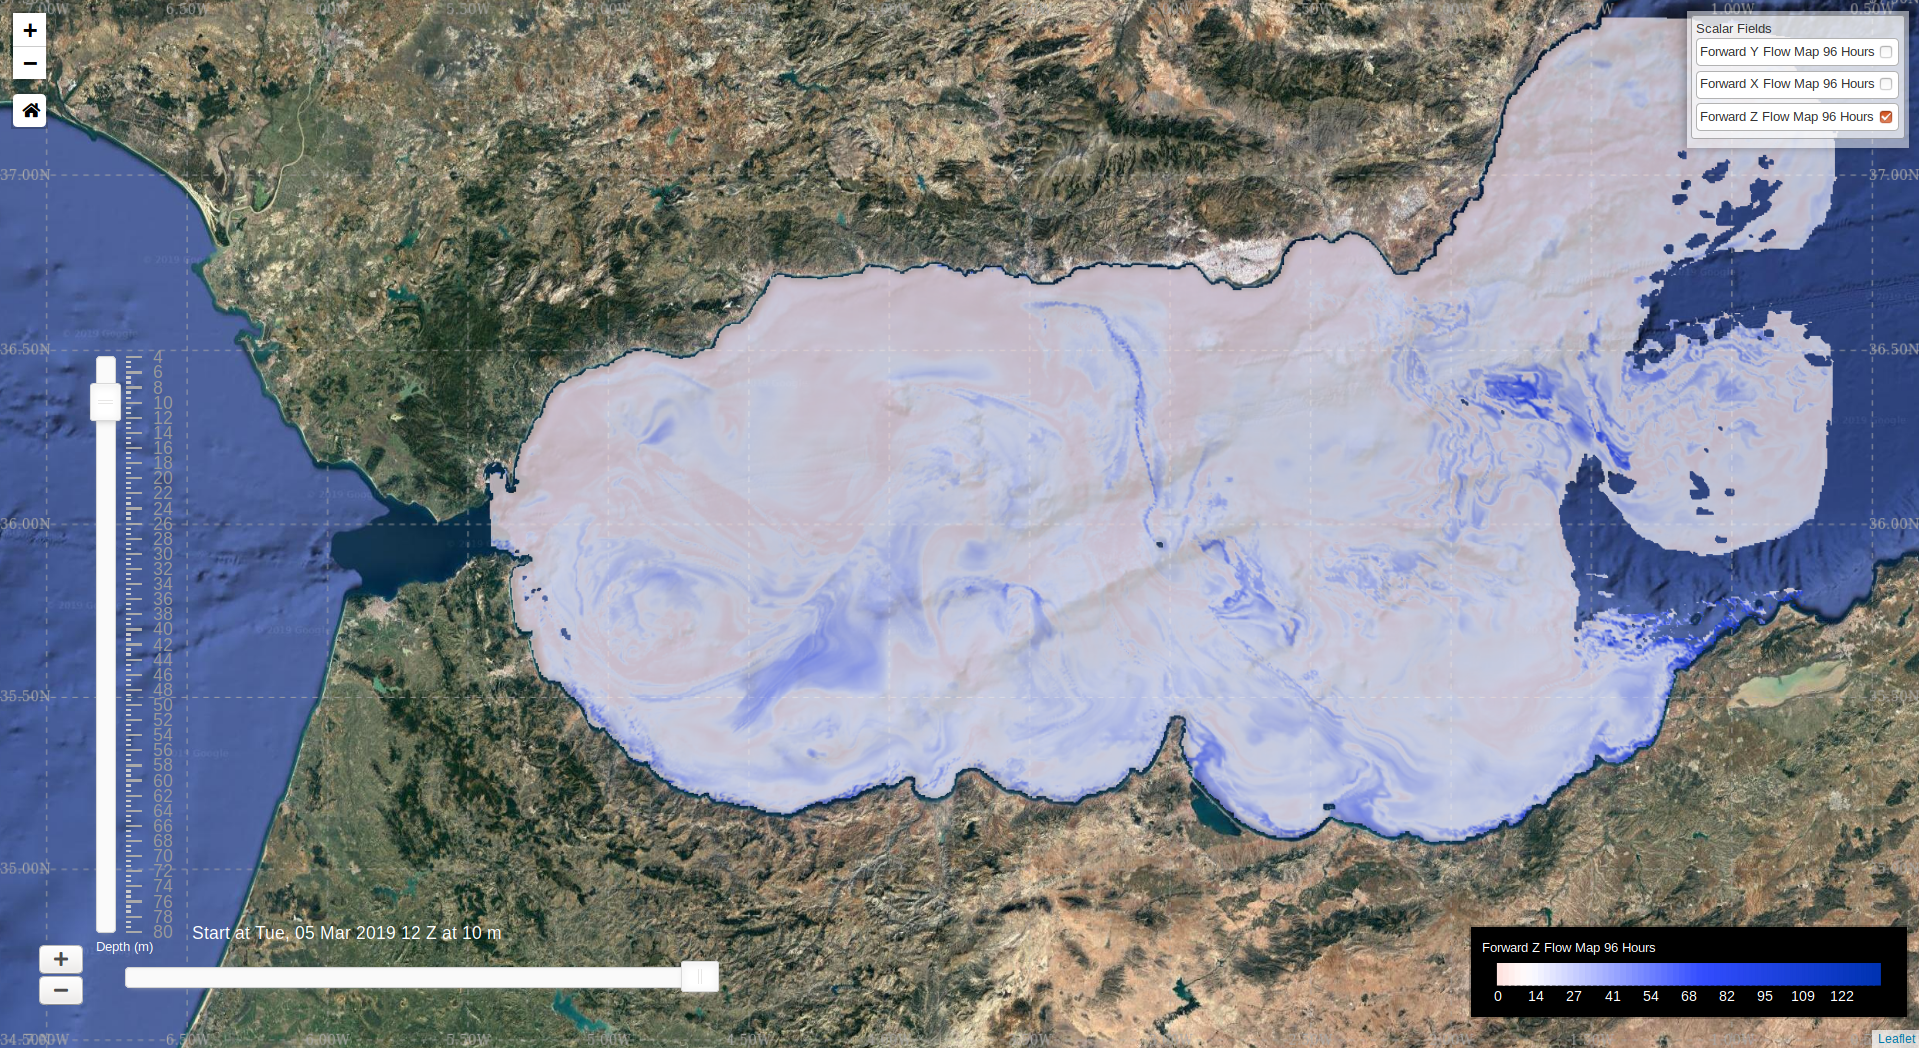
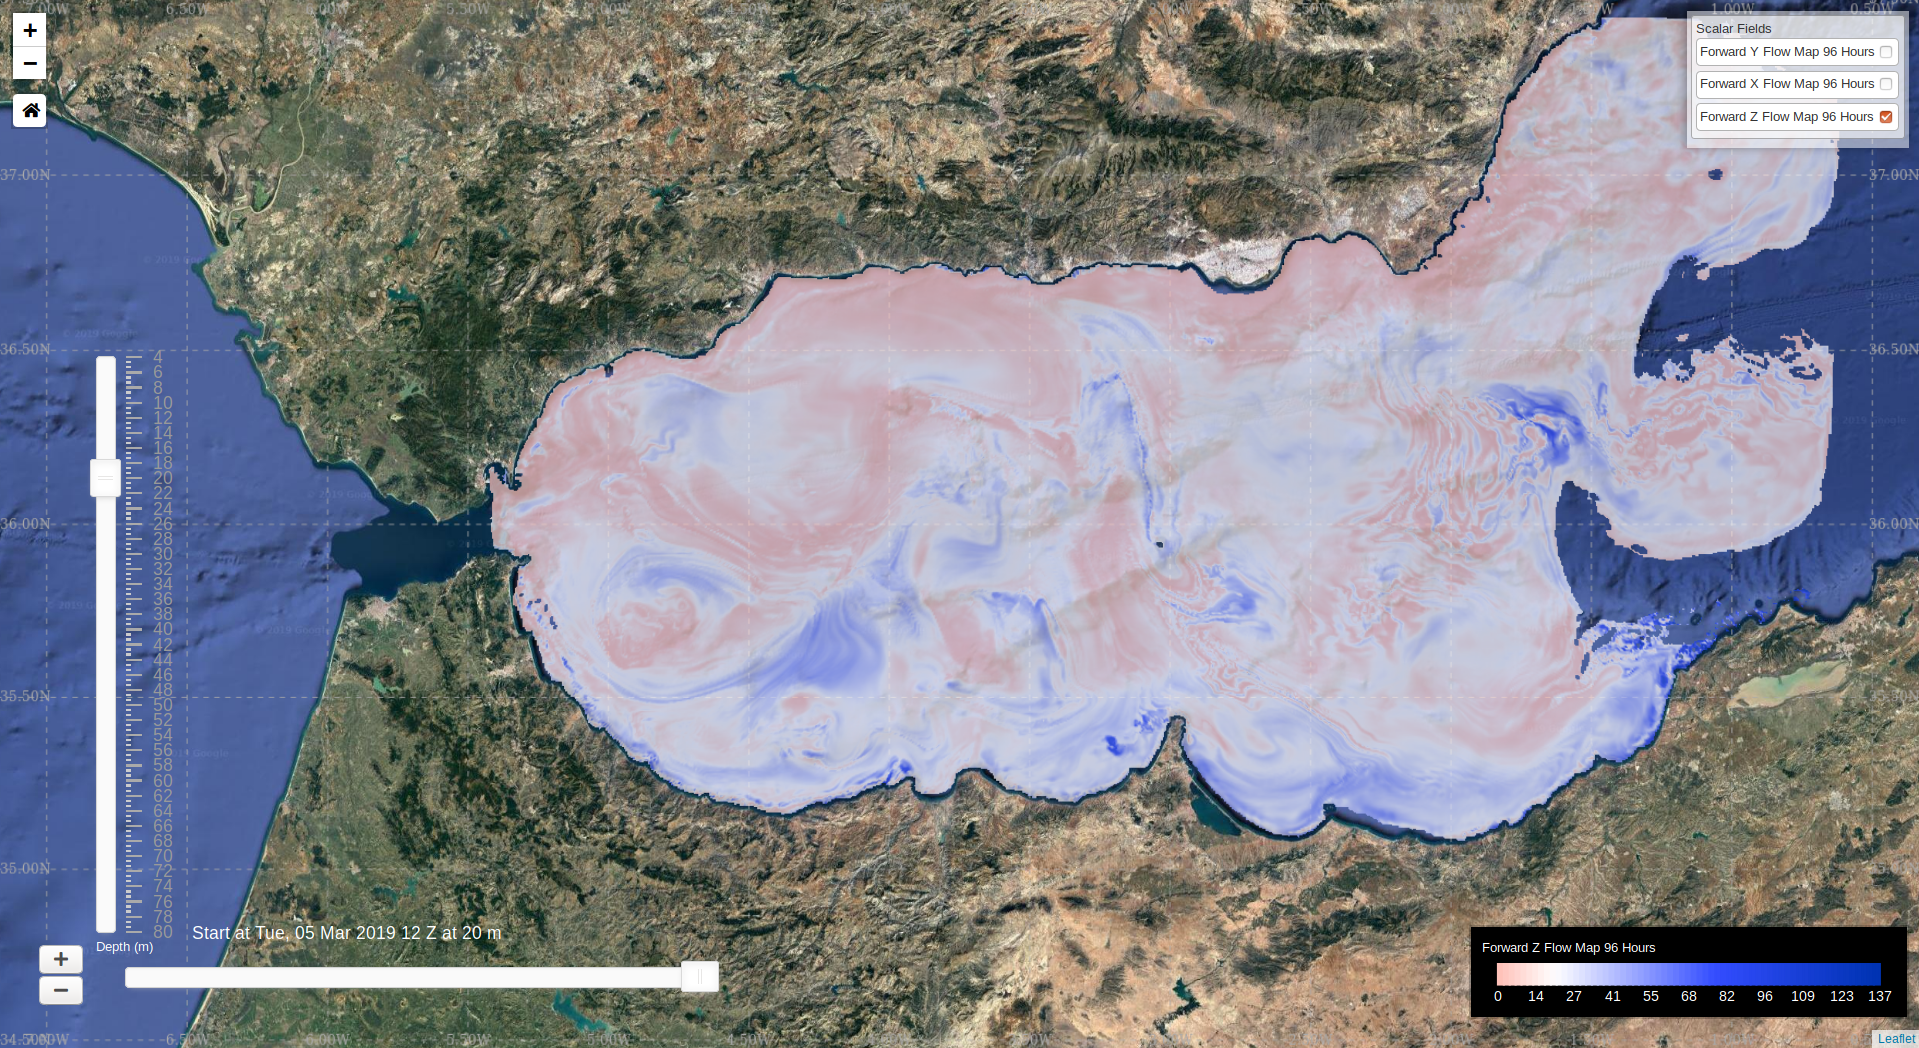
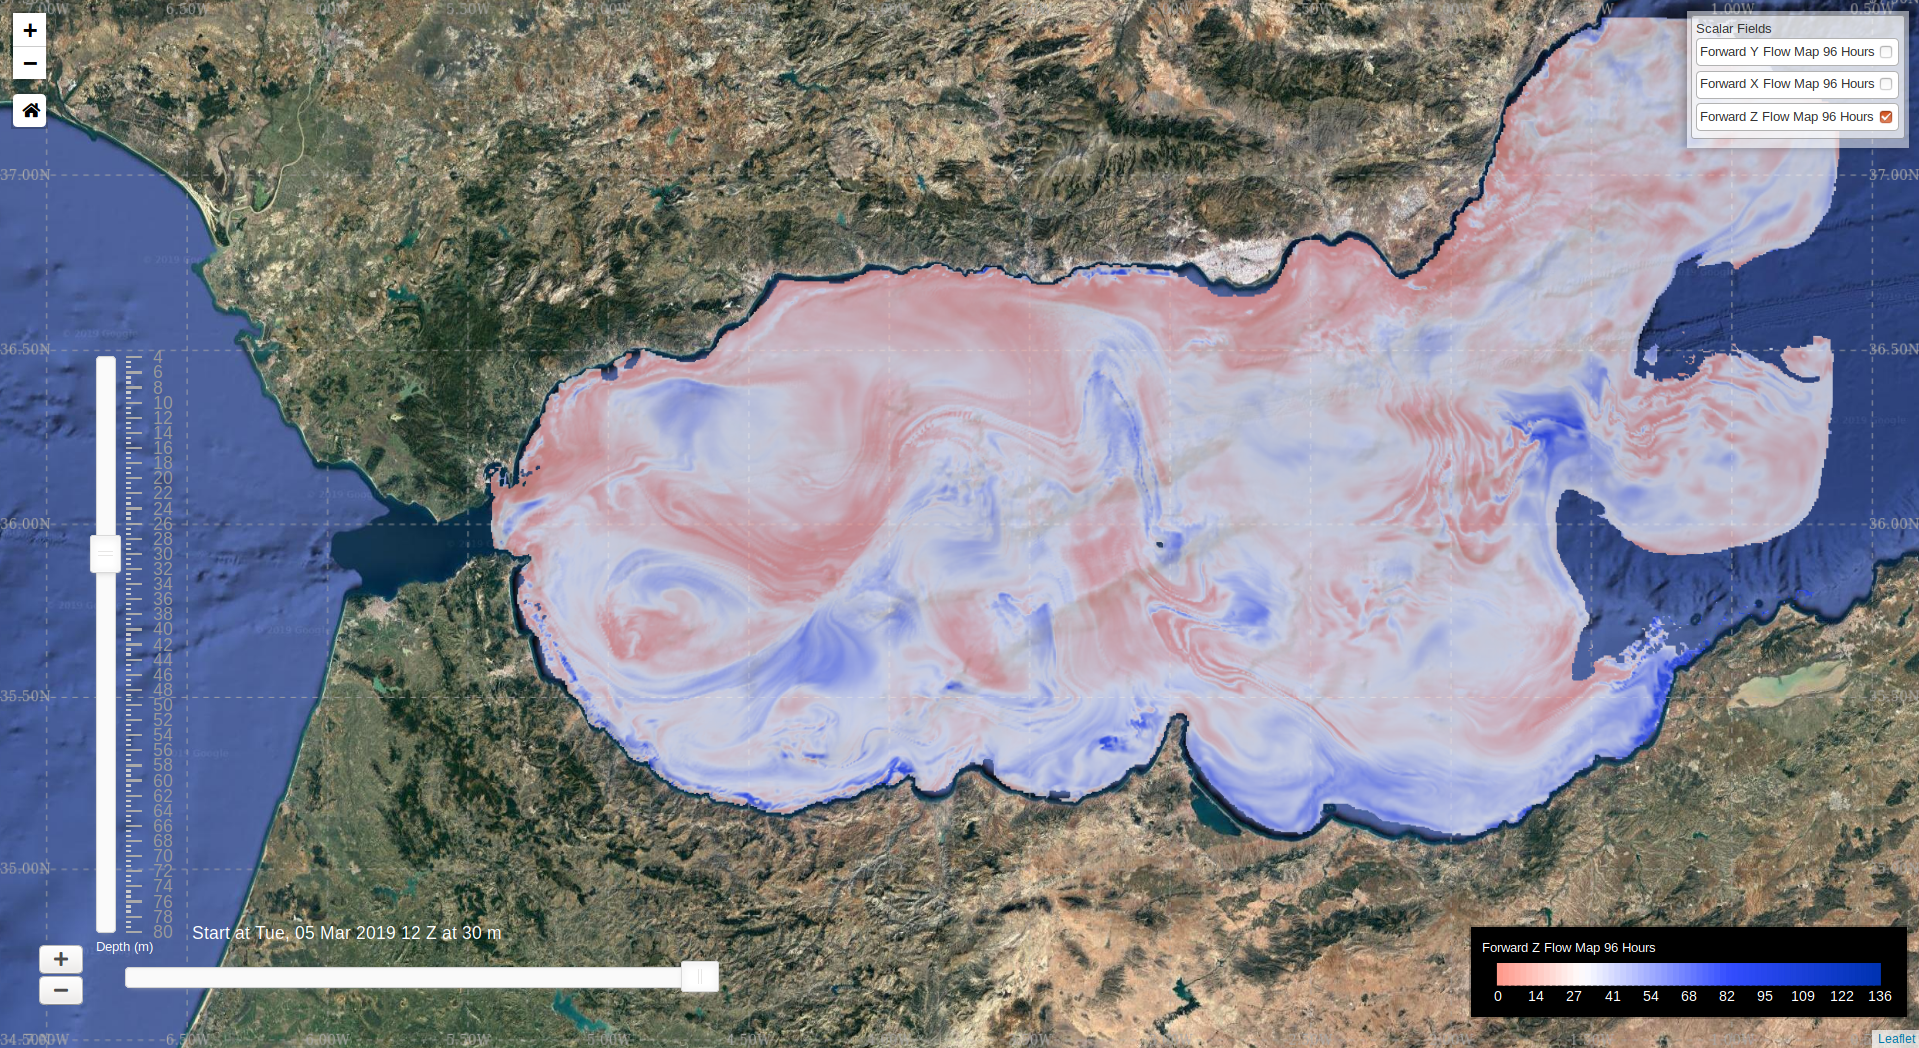
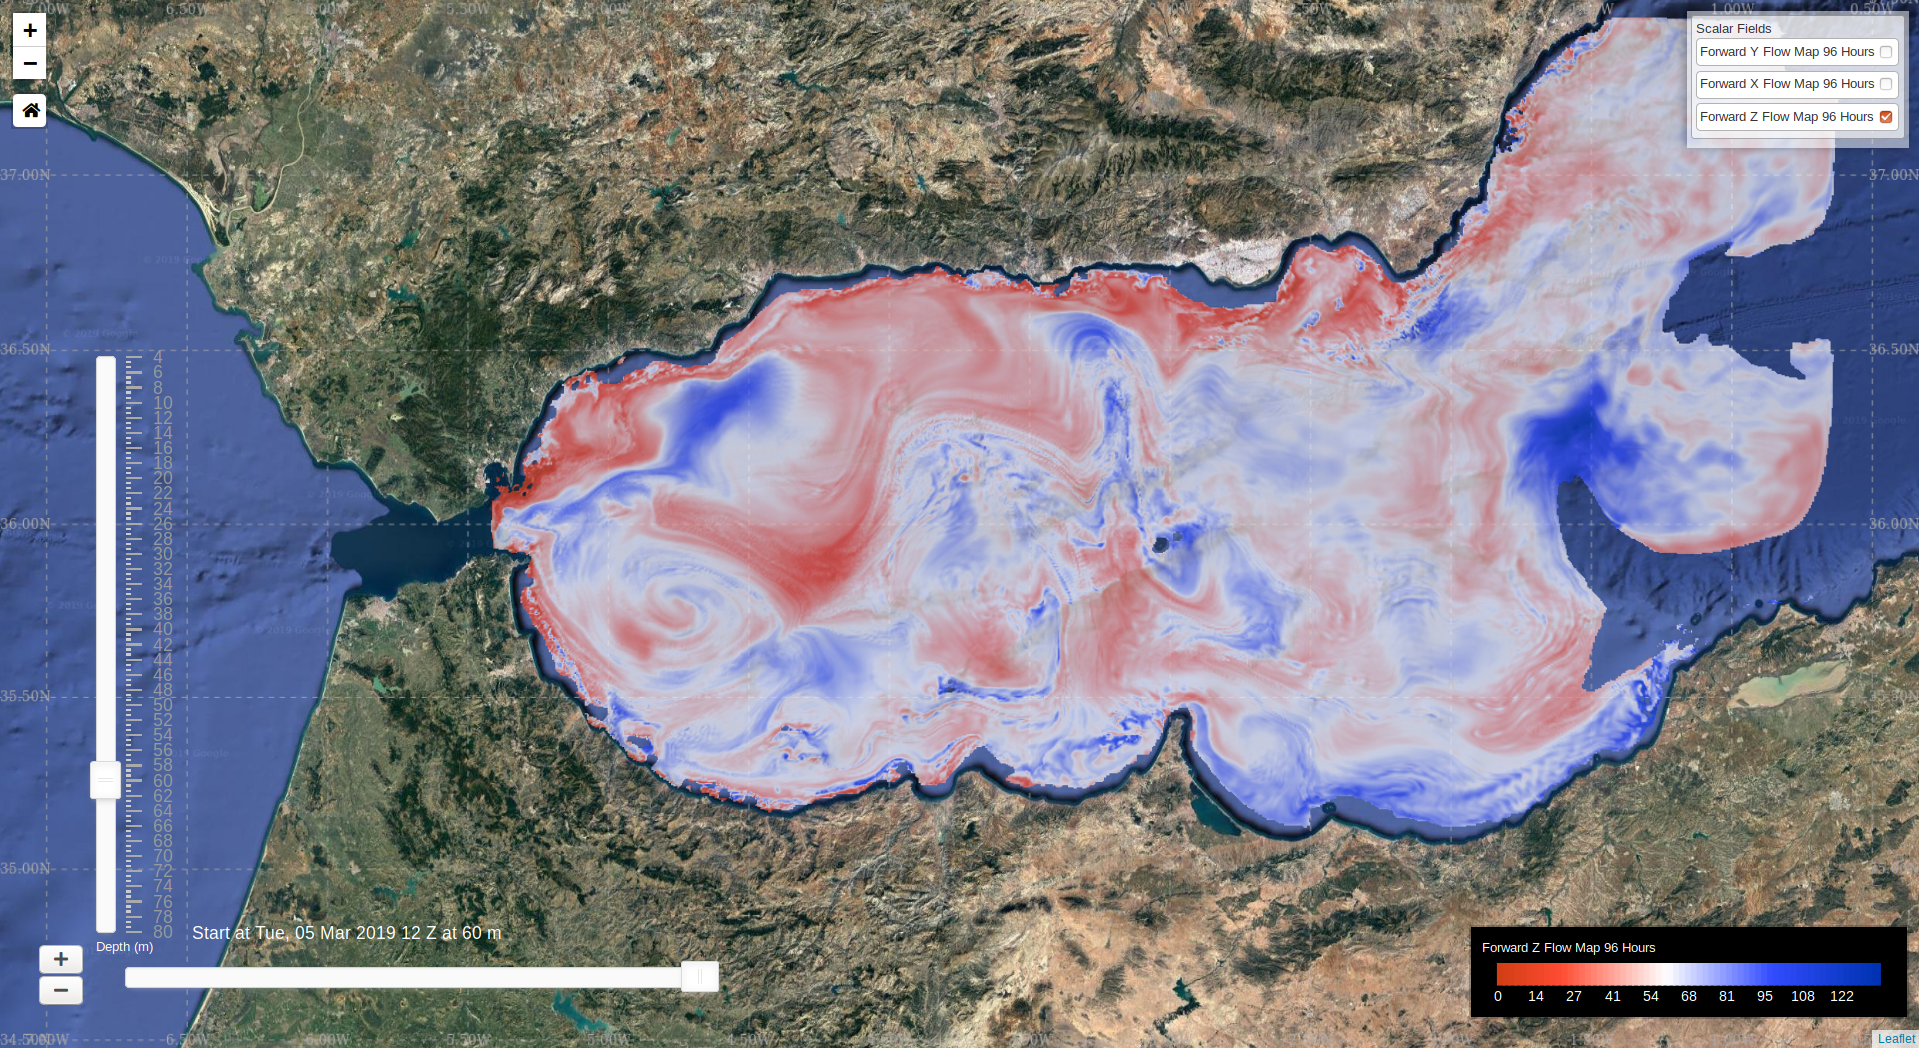
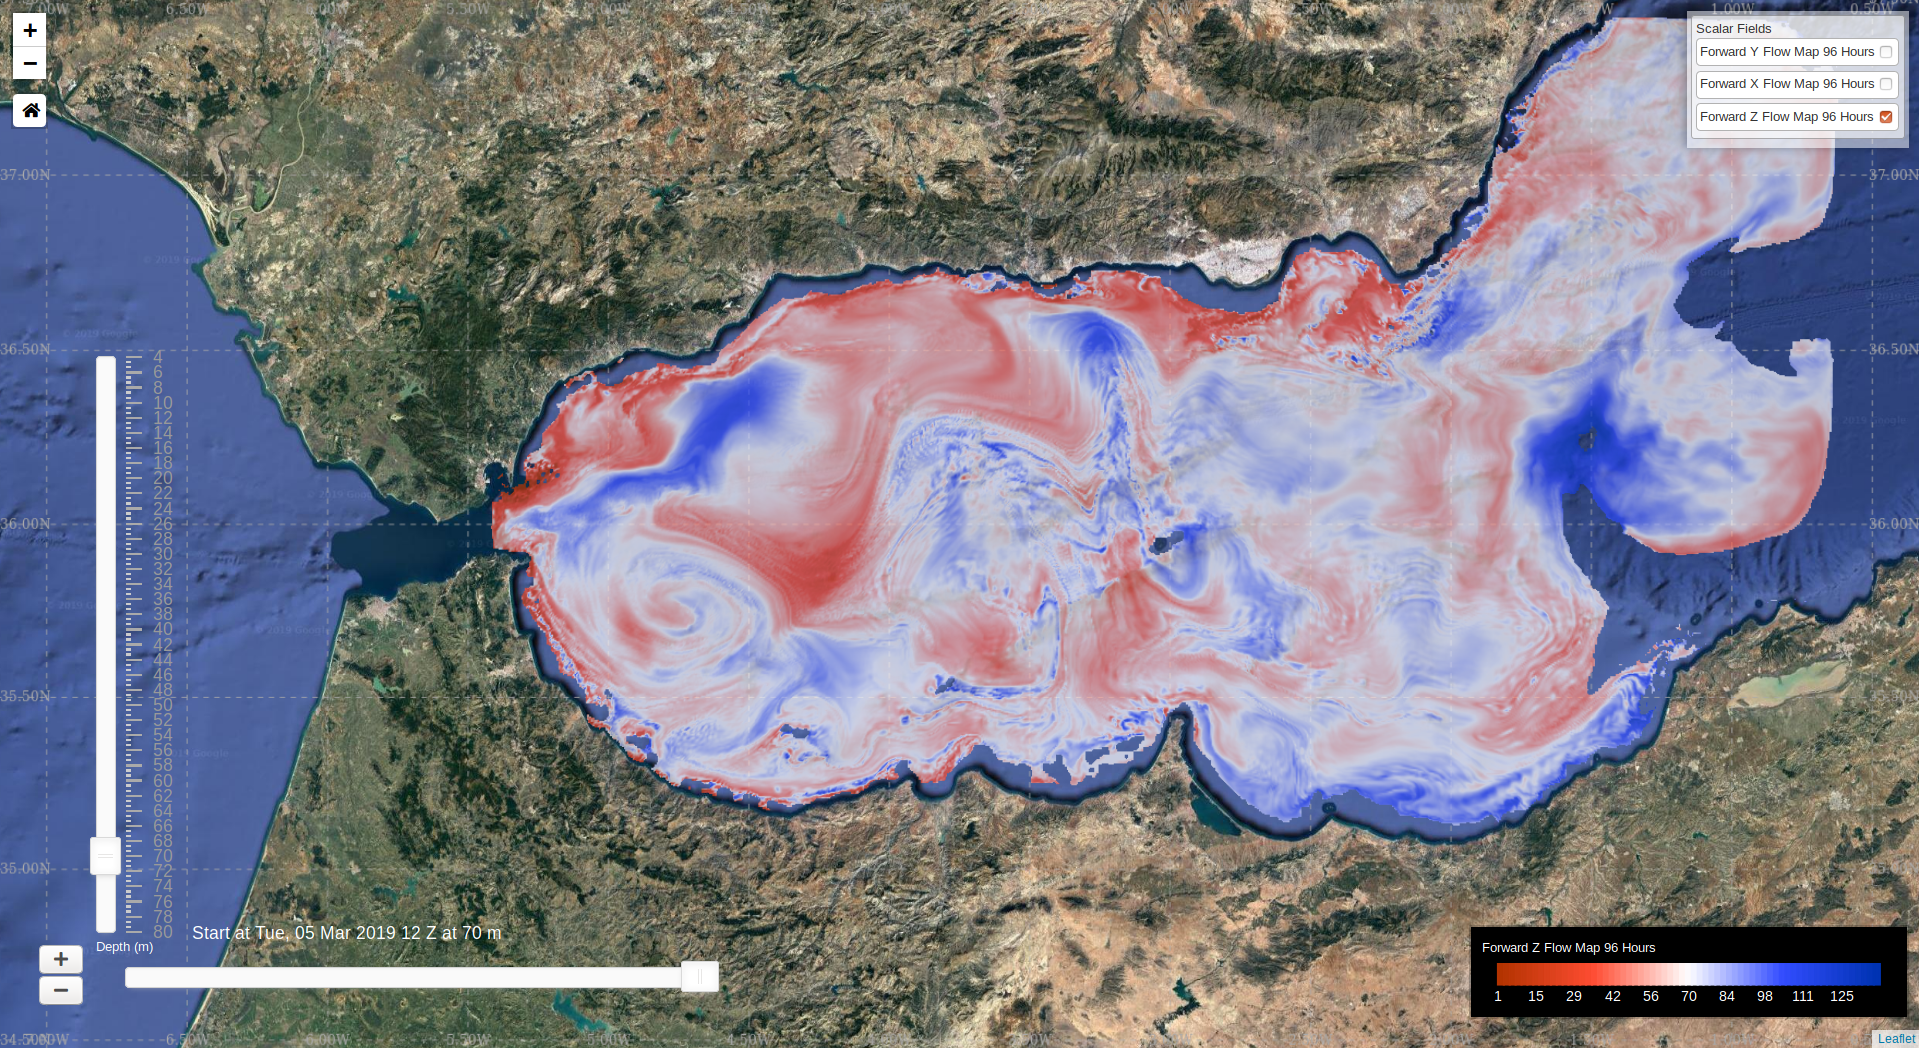
Here is an example of our MSEAS forecast of vertical transport of waters starting at 4m, 10m, 20m, 30m, 40m, 50m, 60m, 70m and 80m. The forecast is for 12Z Mar 5 - 12Z Mar 9, 2019. What is plotted is the depth at which the water parcel will end up starting from 12Z Mar 5 at that location (i.e., it does not show where the parcel ends up horizontally).
| 4m | 10m |
|---|---|
|
|
|
| 10m | 20m | 30m | 40m |
|---|---|---|---|
 |
 |
 |
 |
| 50m | 60m | 70m | 80m |
 |
 |
 |
 |