Go to Feb/Mar 2022 issue date:
| 14 | 15 | 16 | 17 | 18 | 19 | 20 | 21 | 22 | 23 | 24 | 25 | 26 | 27 | 28 | 1 | 2 | 3 | 4 | 5 | 6 | 7 | 8 | 9 | 10 |
| Product | 3D View | Top View | Side View |
|---|---|---|---|
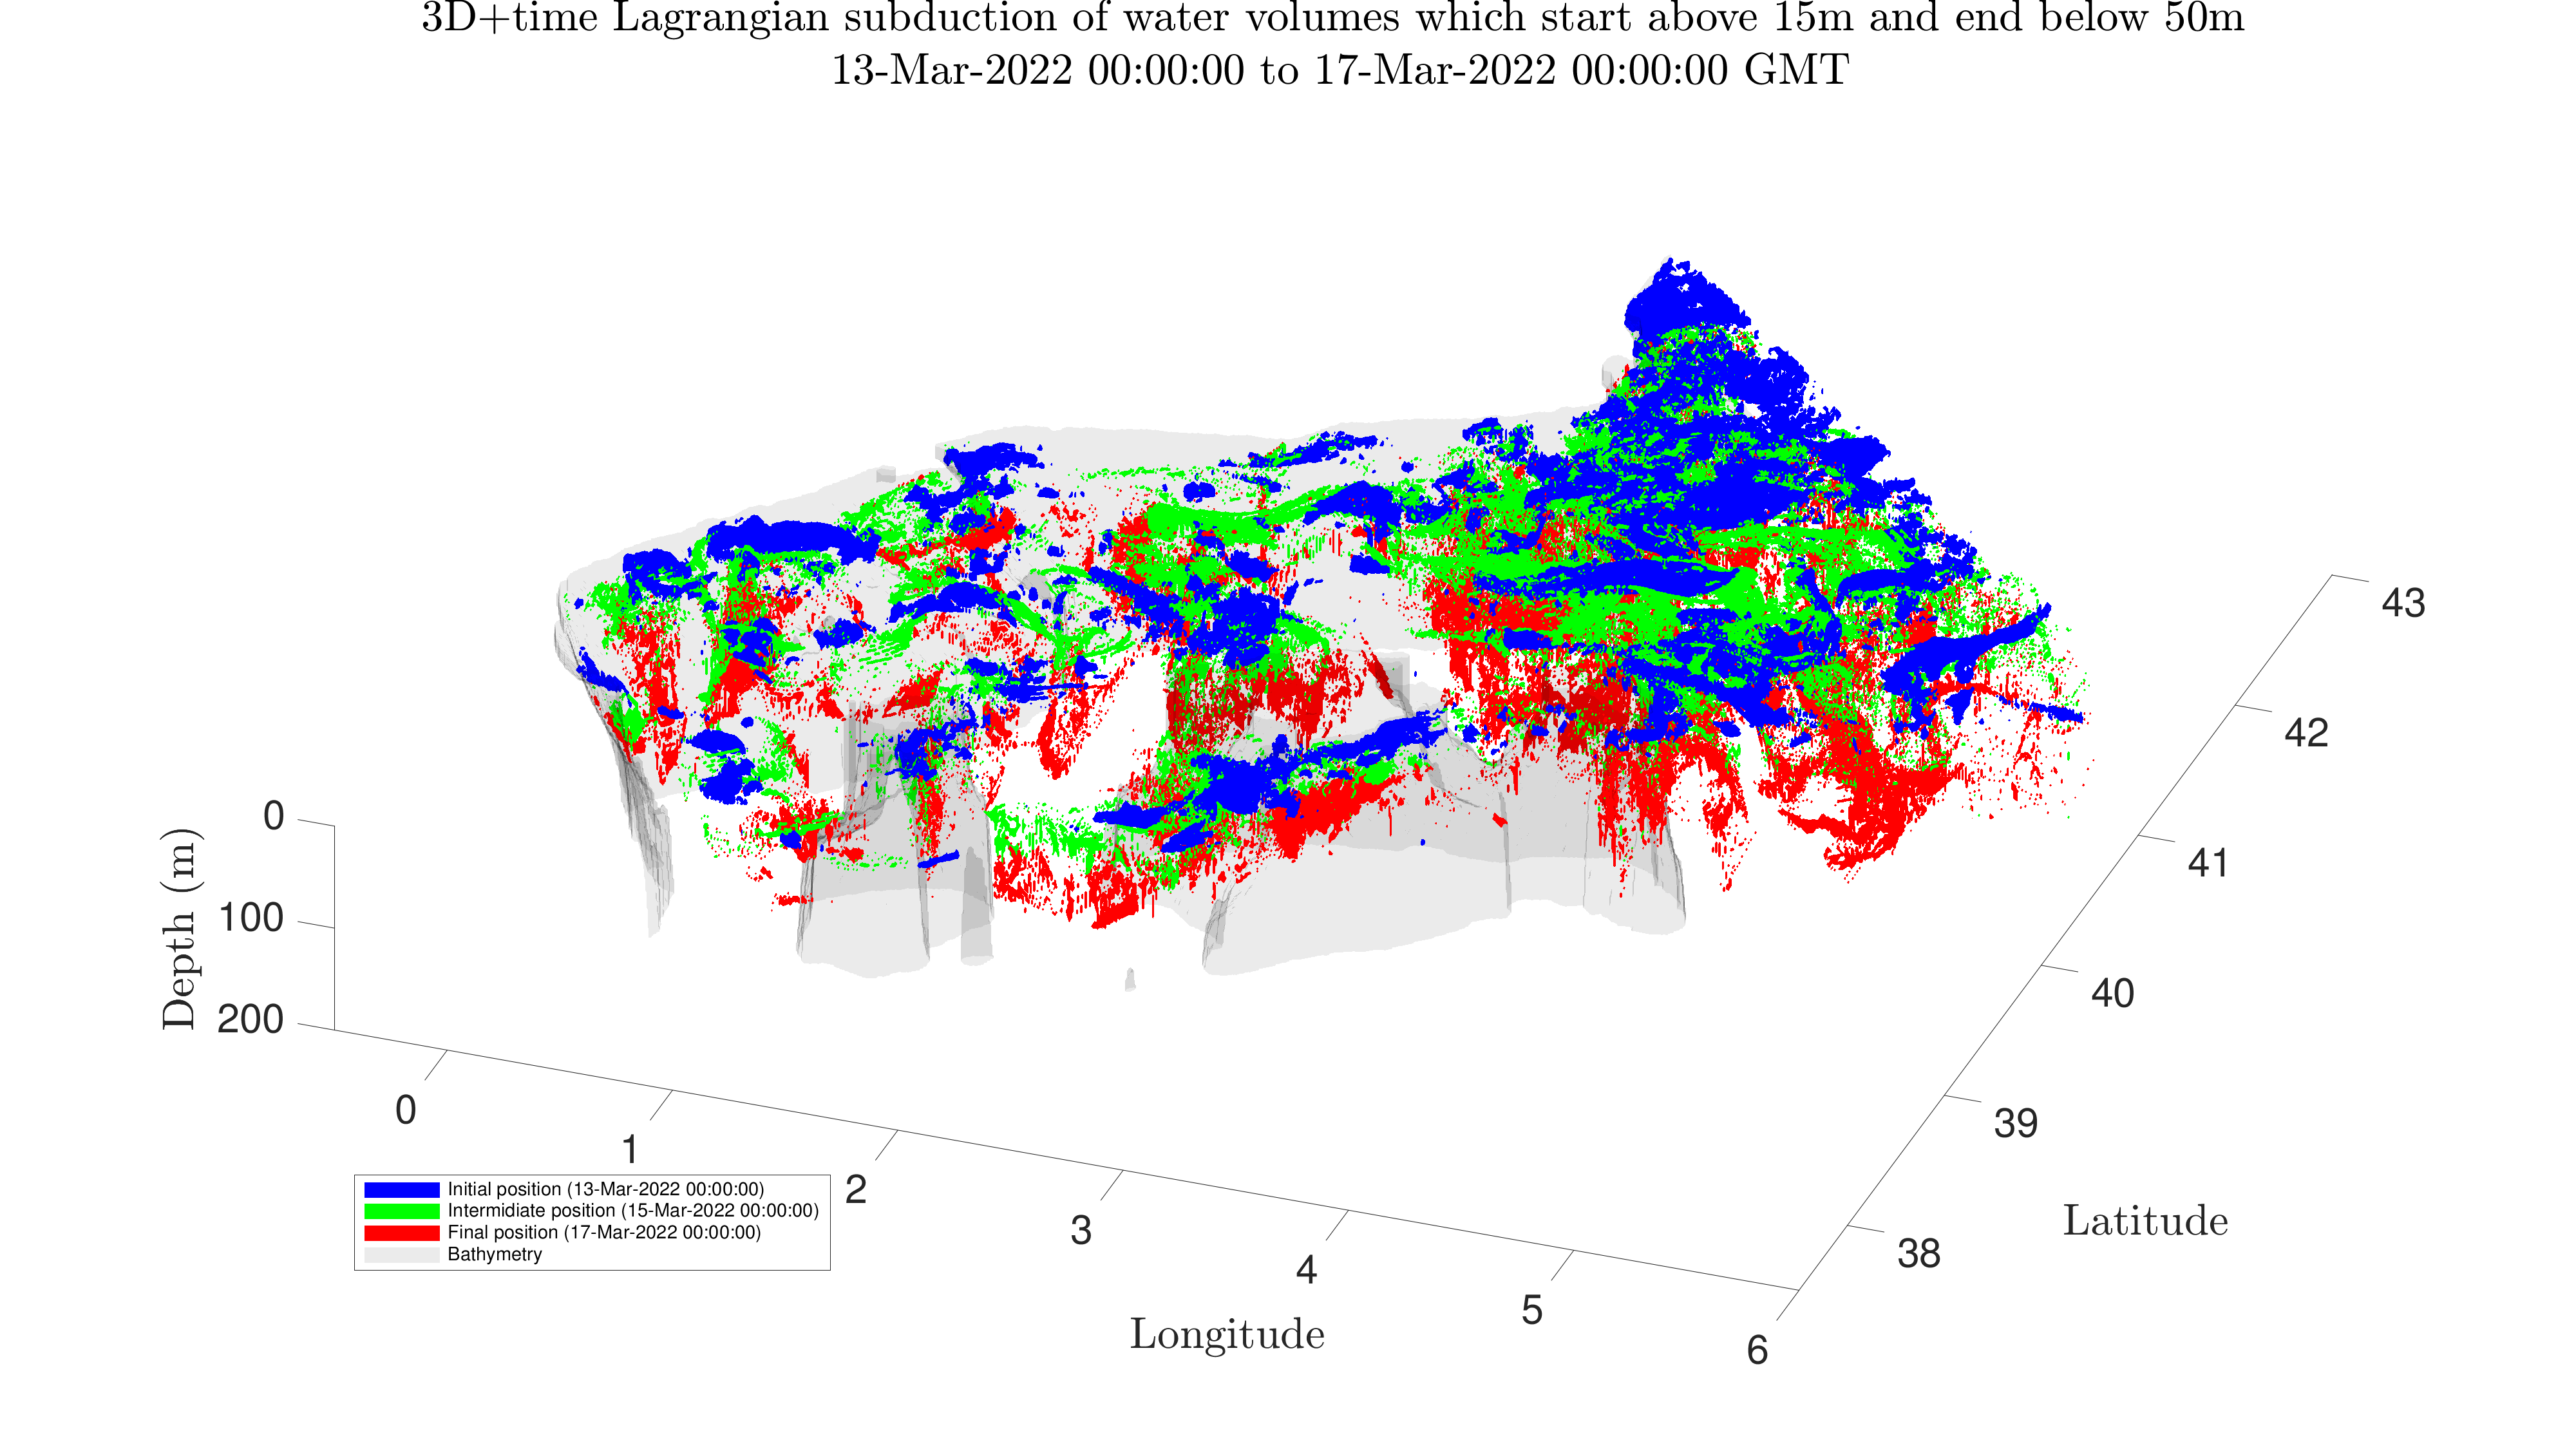
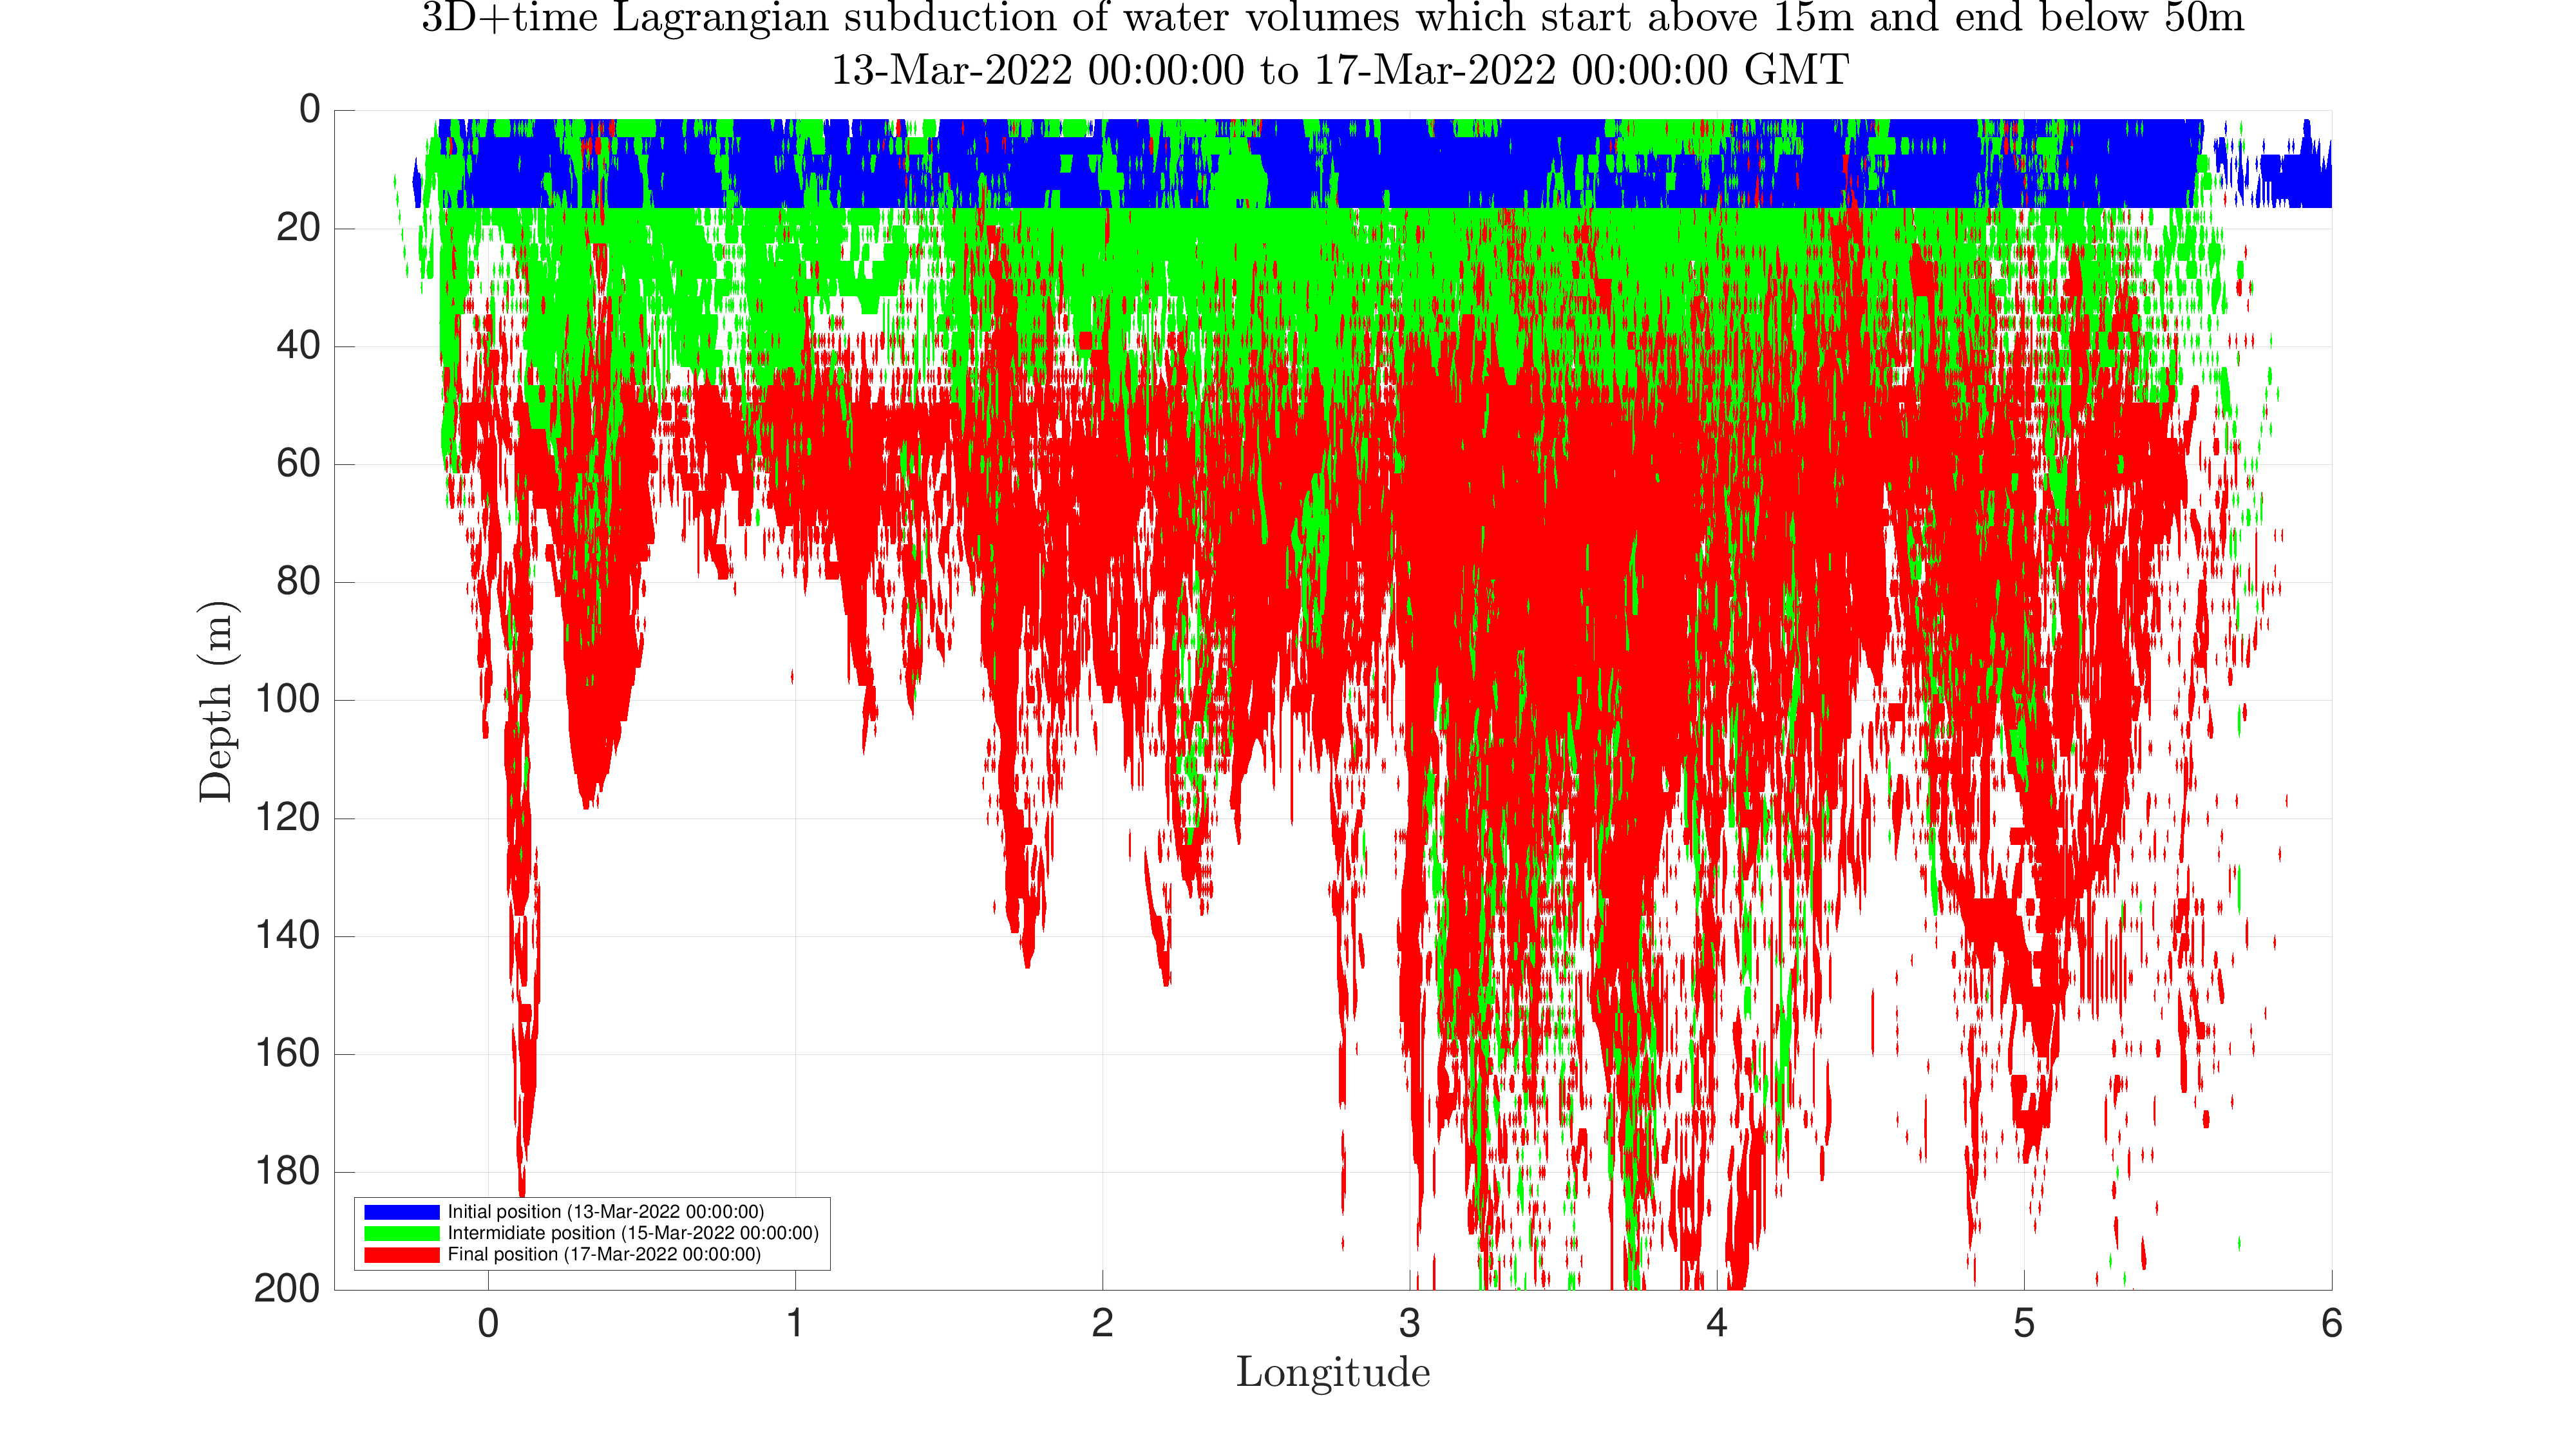
| 96-hour 3D Subduction Map (advection only) |
 |
 |
 |
| 96-hour Forward Vertical Flow Map (MSEAS 2D SeaVizKit) |

96-hour Backward Flow Map Description Backward flowmaps display at the final location of a water parcel the initial position of that water parcel as it is advected over a specified time window. For instance, if the value of the 96 hour backward z-flowmap at 102 m at a given (x, y) location is 0m, the initial depth of that parcel was 0m and after 96 hours of being advected in the 3D flow it ends up at that location at 102m. Hence, the z-flowmap for example does not indicate where the water parcel goes down nor where it ends up.
|
||
| Product | Forecast for 1200Z Mar 12 | Forecast for 1200Z Mar 13 | Forecast for 1200Z Mar 14 |
| Sigma-T Along Section 4 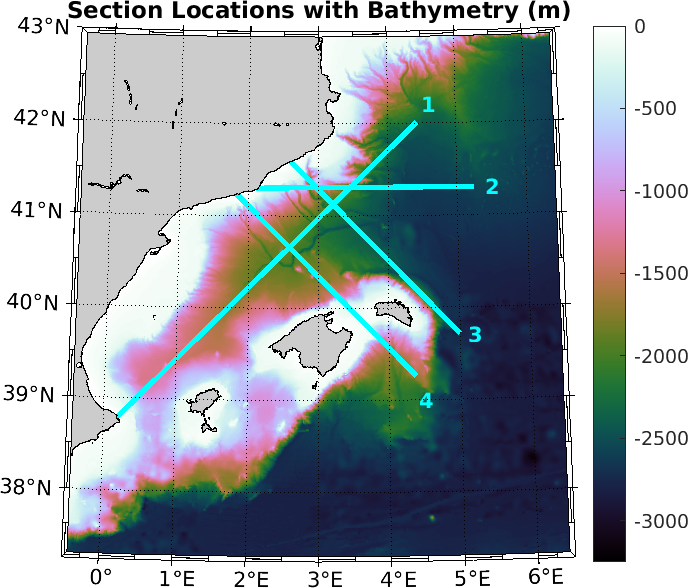
|
 |
 |
 |
| Ertel PV Along Section 4 |
 |
 |
 |
| 0m Sigma-T |
 |
 |
 |
| 2m Vorticity |
 |
 |
 |
More information and products can be found on the MSEAS CALYPSO 2022 Sea Exercise Main Page.