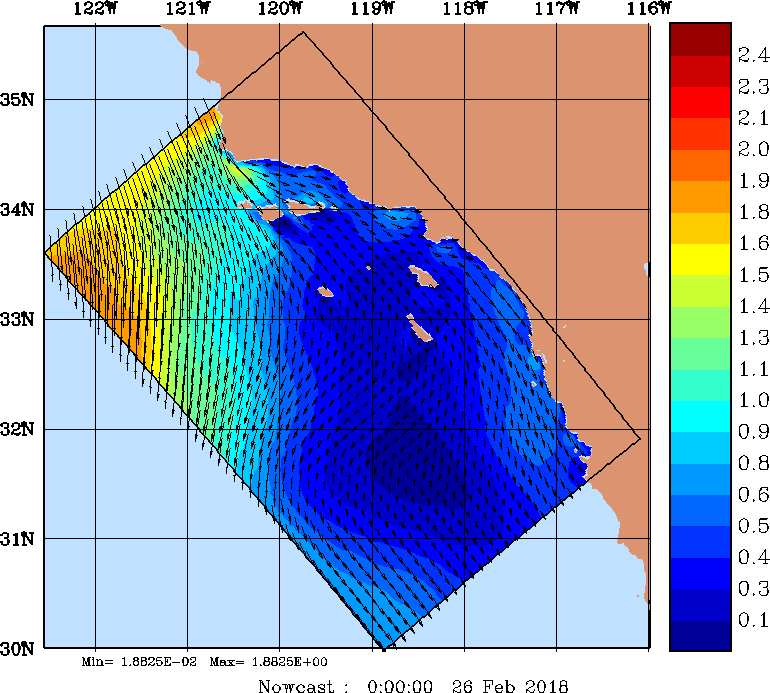
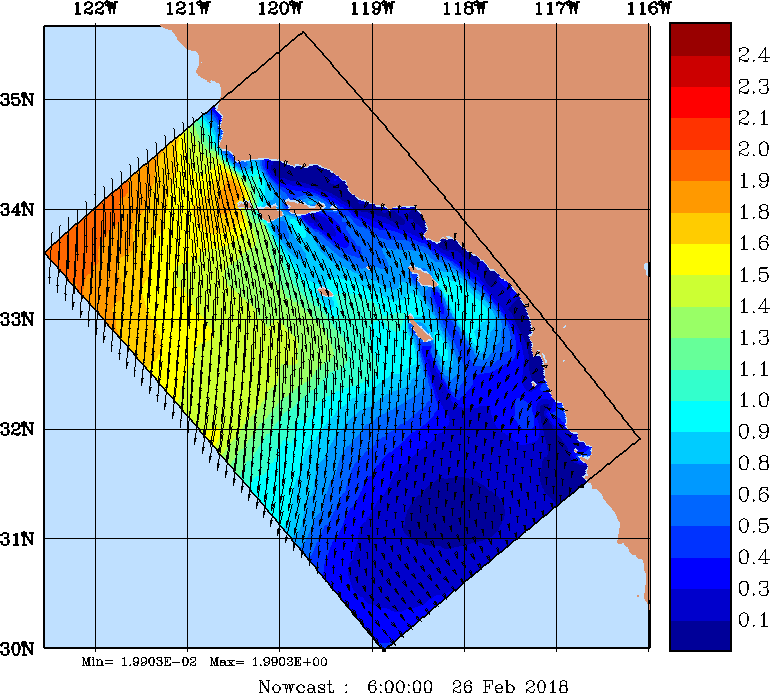
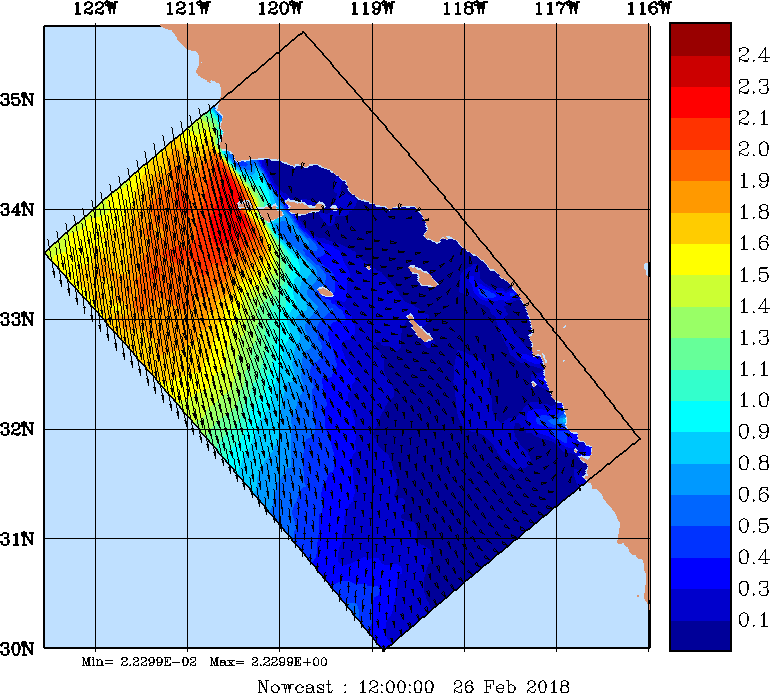
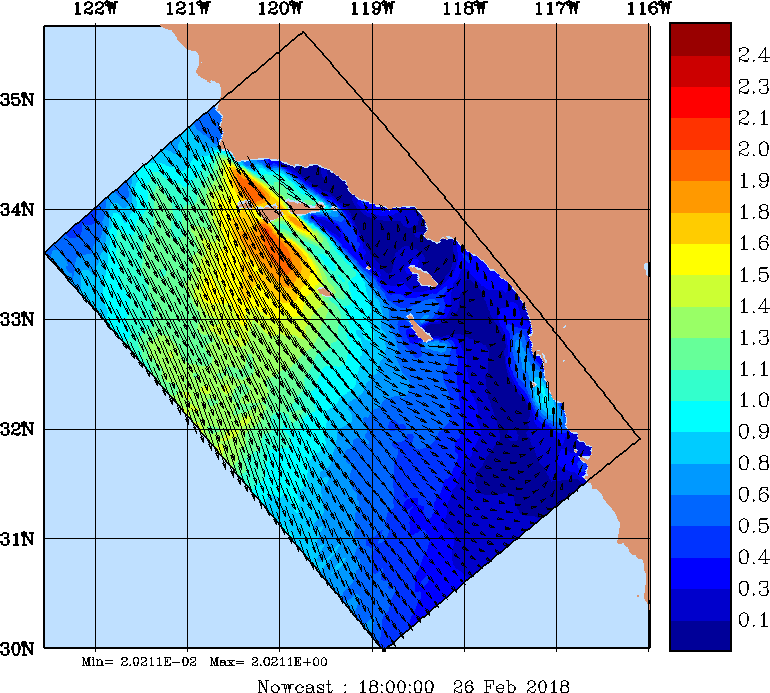

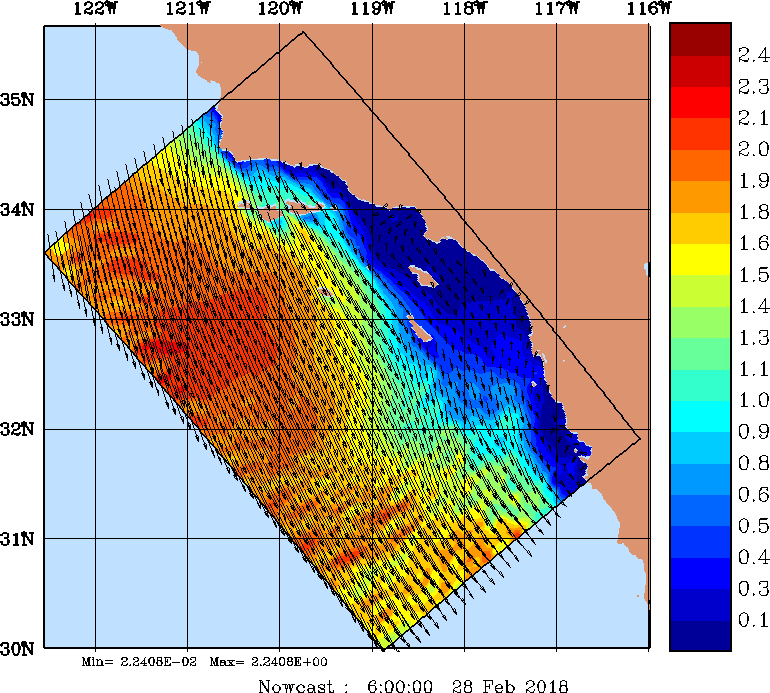
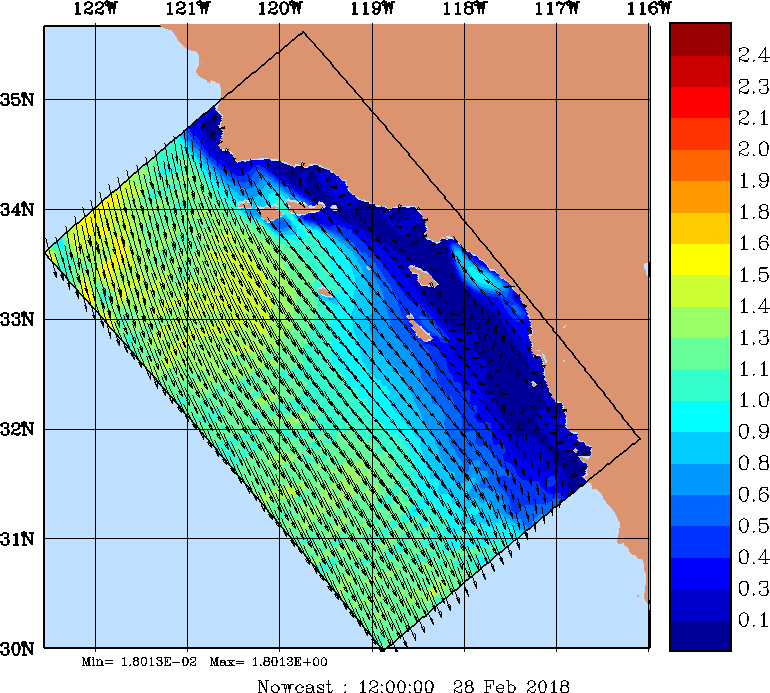


Note: 1 N/m2 = 10 dyne/cm2
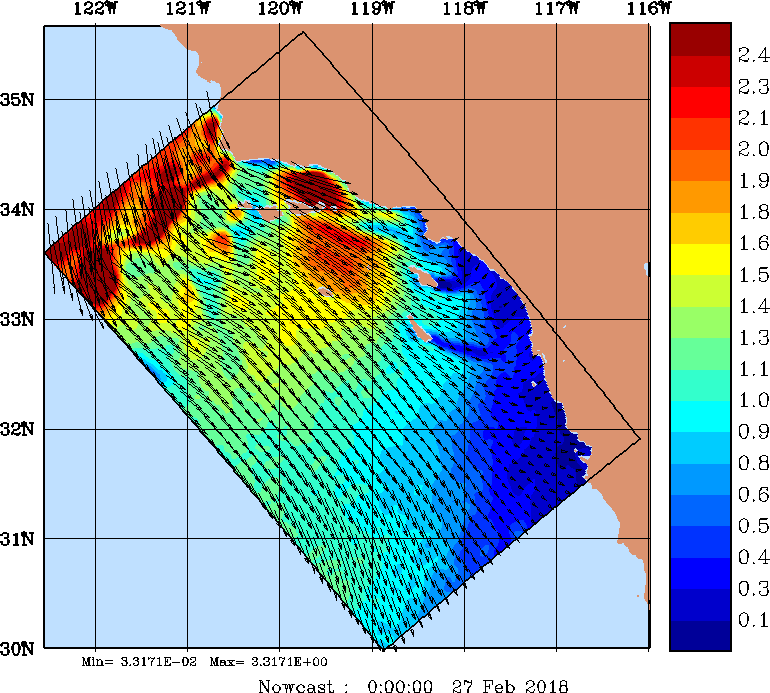
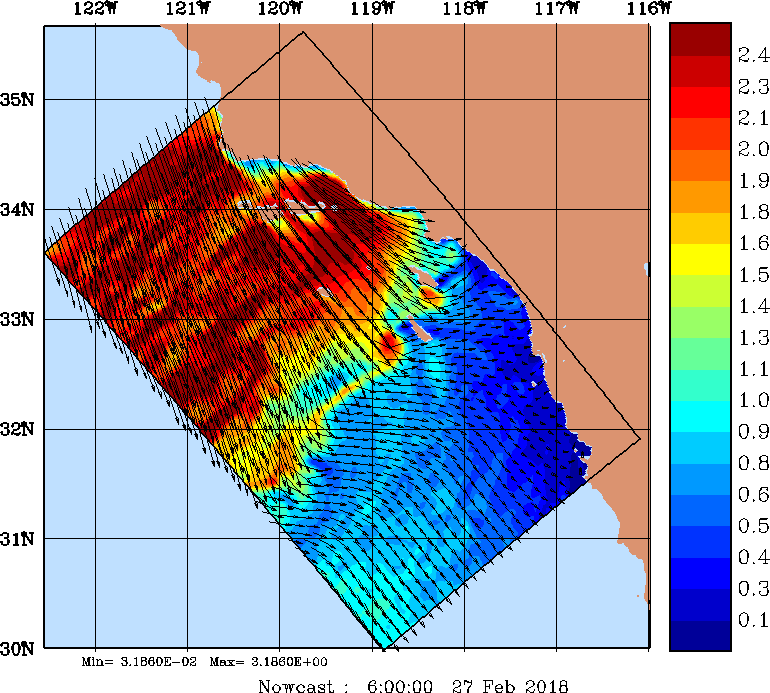
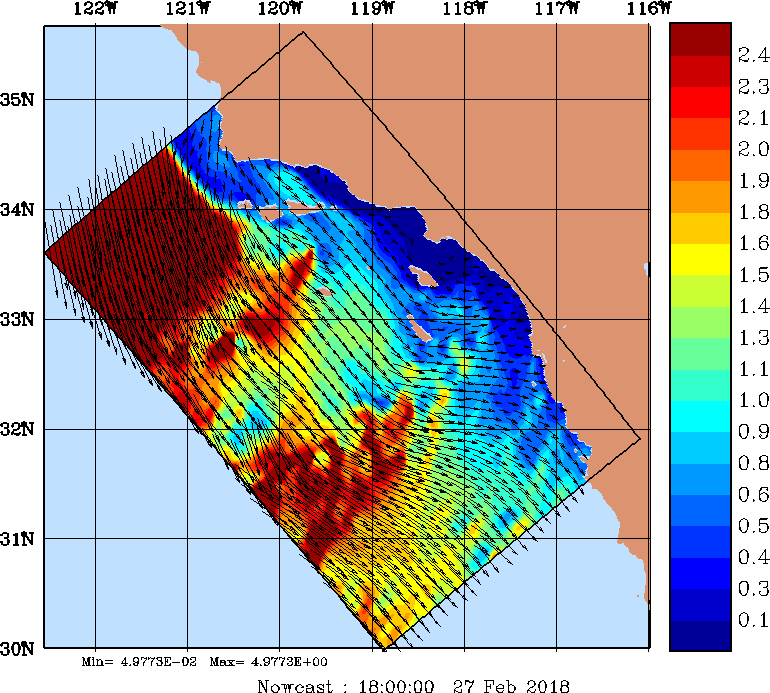
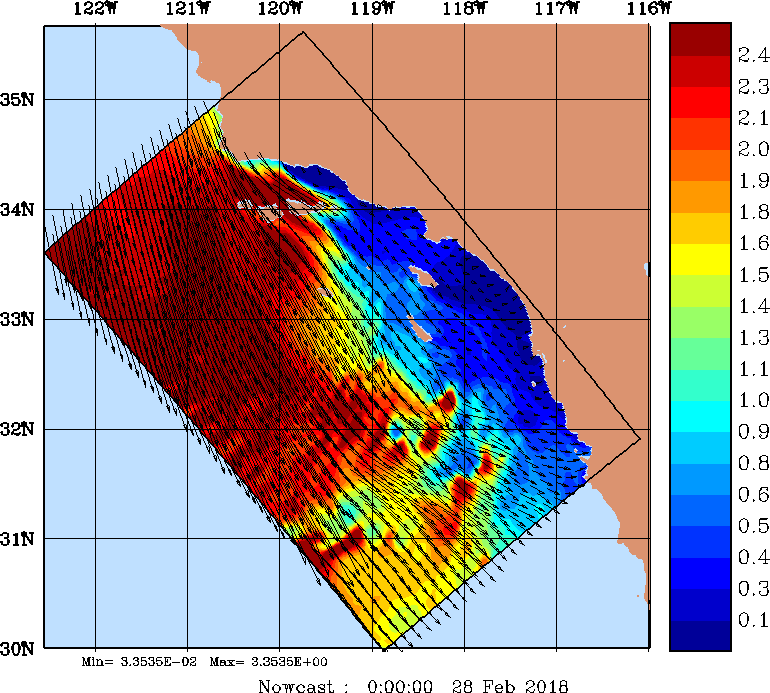
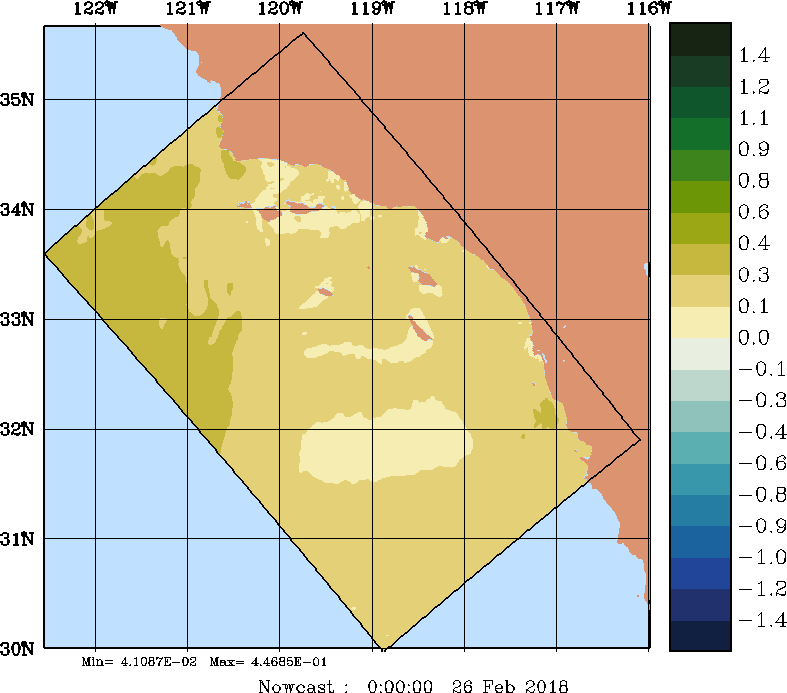
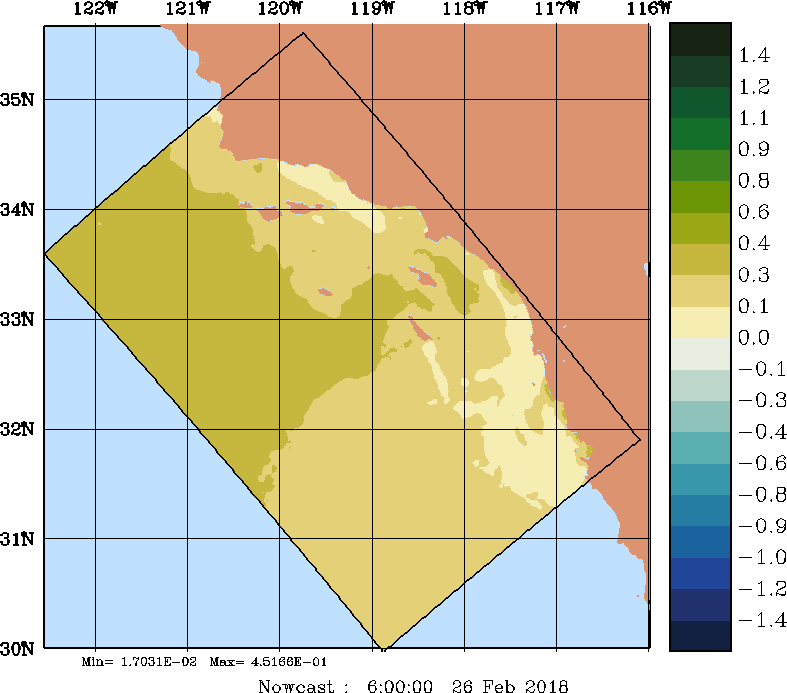
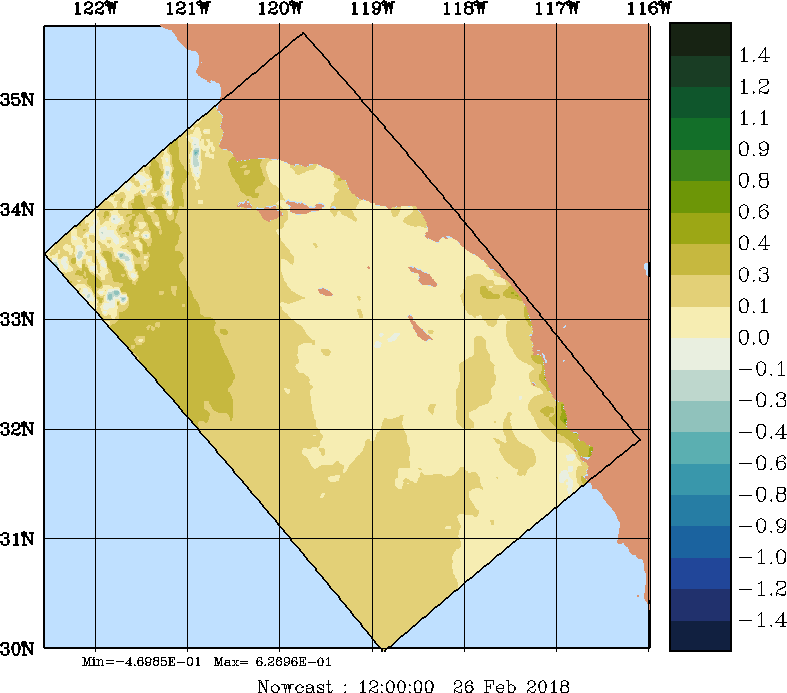
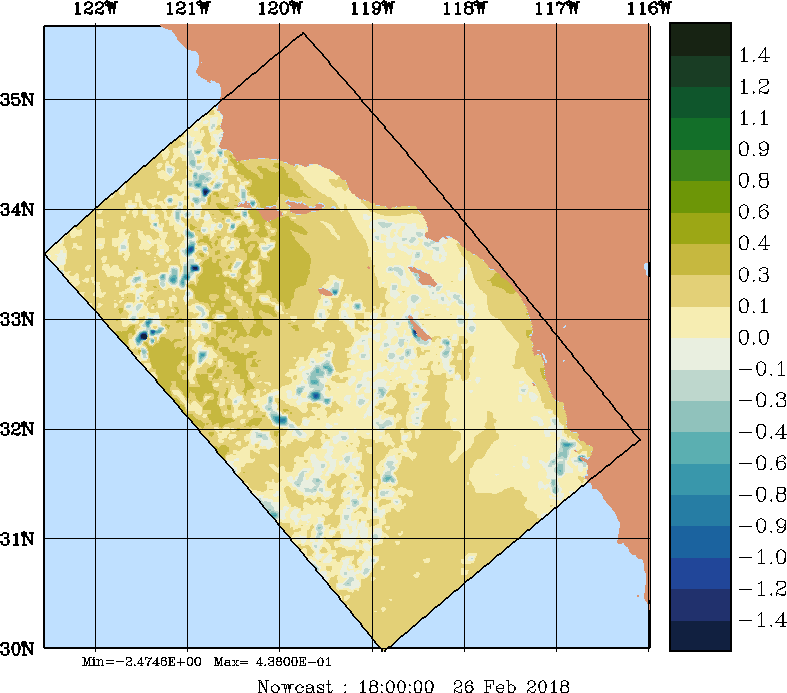
| Wind Stress Snapshots (dynes/cm2); processed by MSEAS from NCEP NAM fields | ||||||||||
| 2018 Feb 26 | 2018 Feb 27 | 2018 Feb 28 | ||||||||
| 00Z | 06Z | 12Z | 18Z | 00Z | 06Z | 12Z | 18Z | 00Z | 06Z | 12Z |
|
|
|
|
|
|
|
|
|
|
|
|
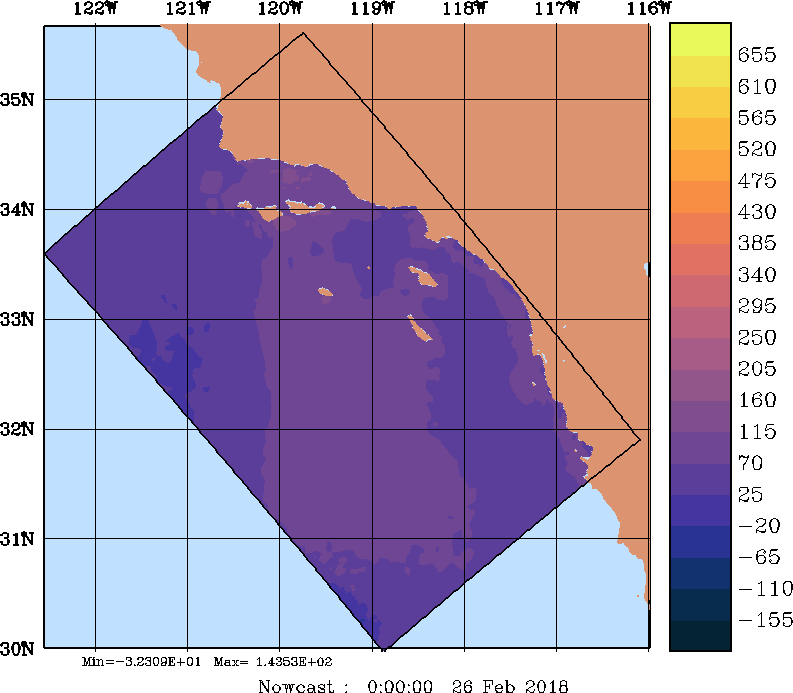
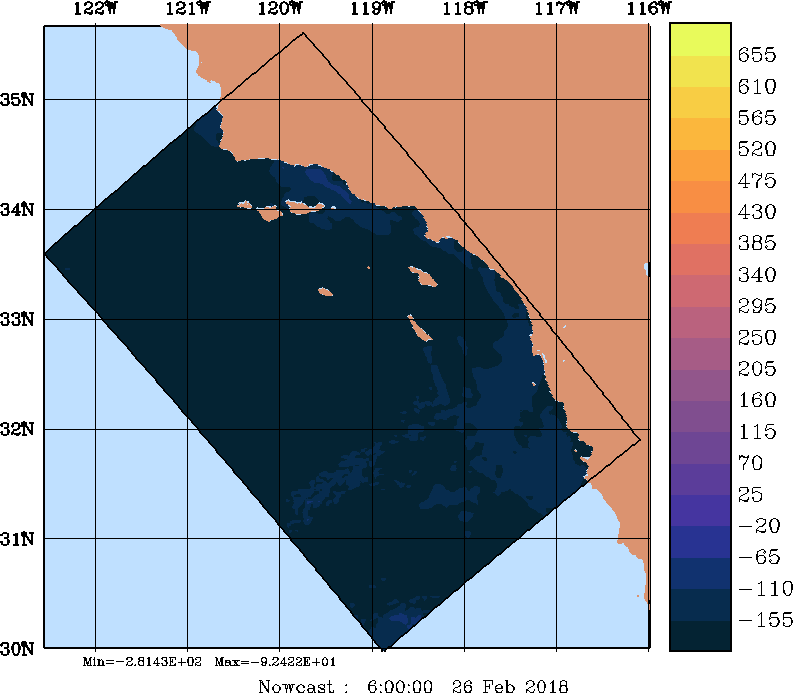
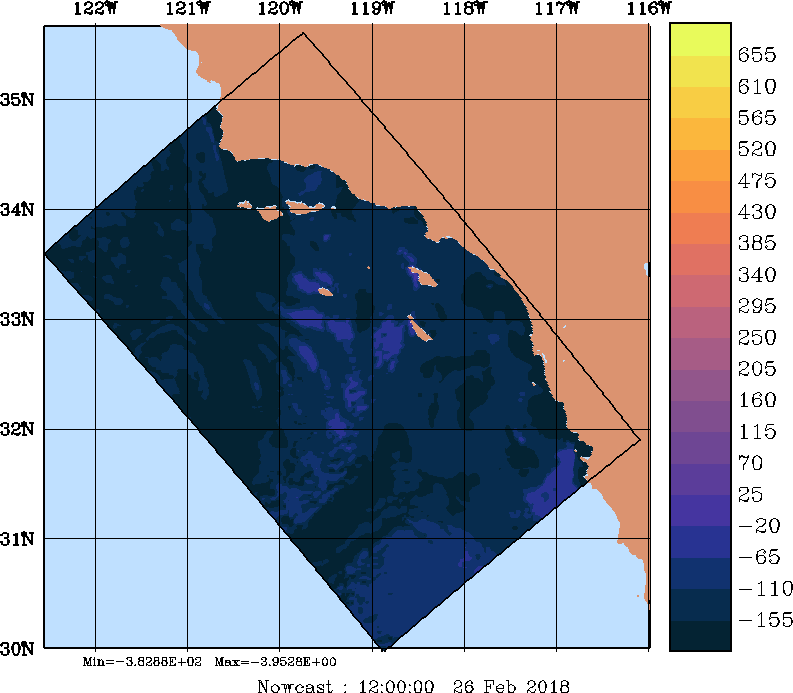
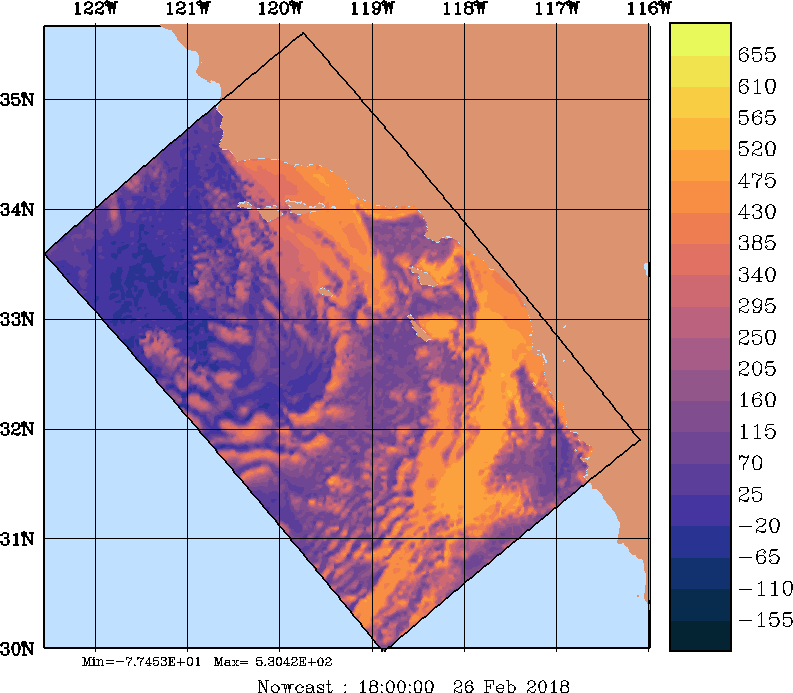
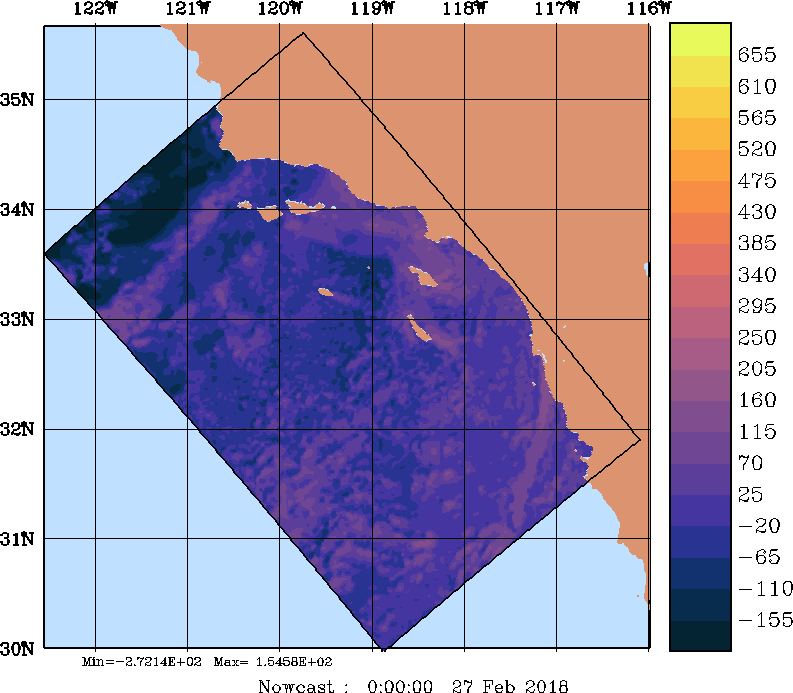
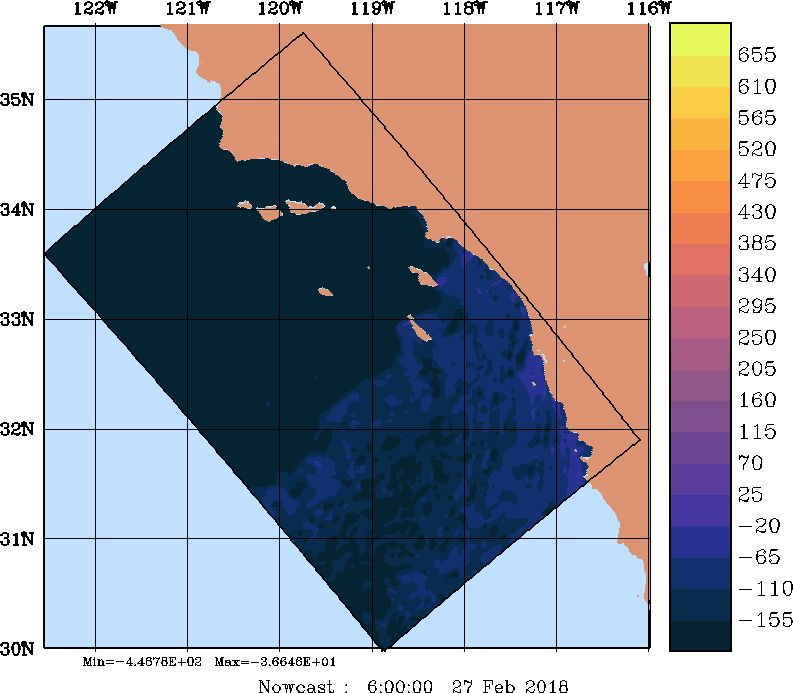
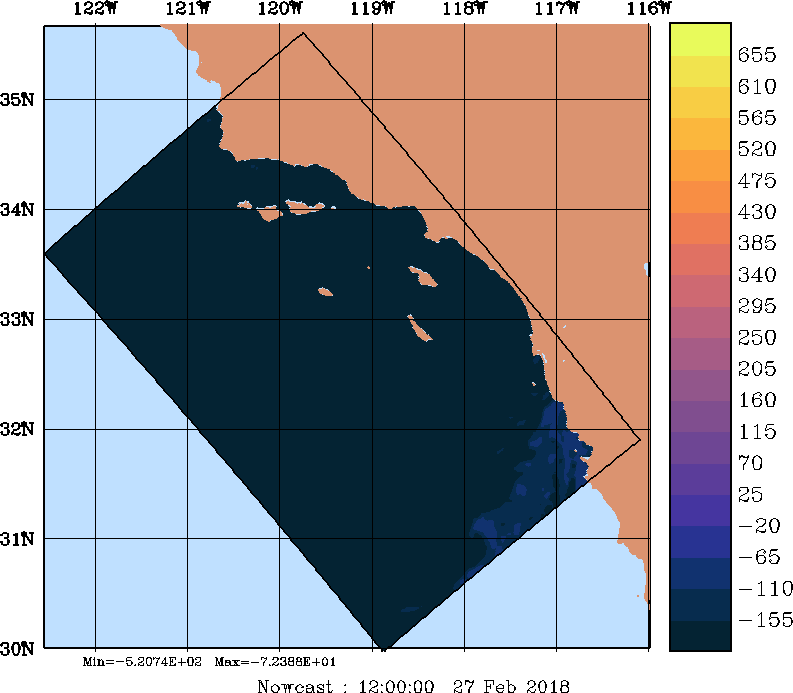
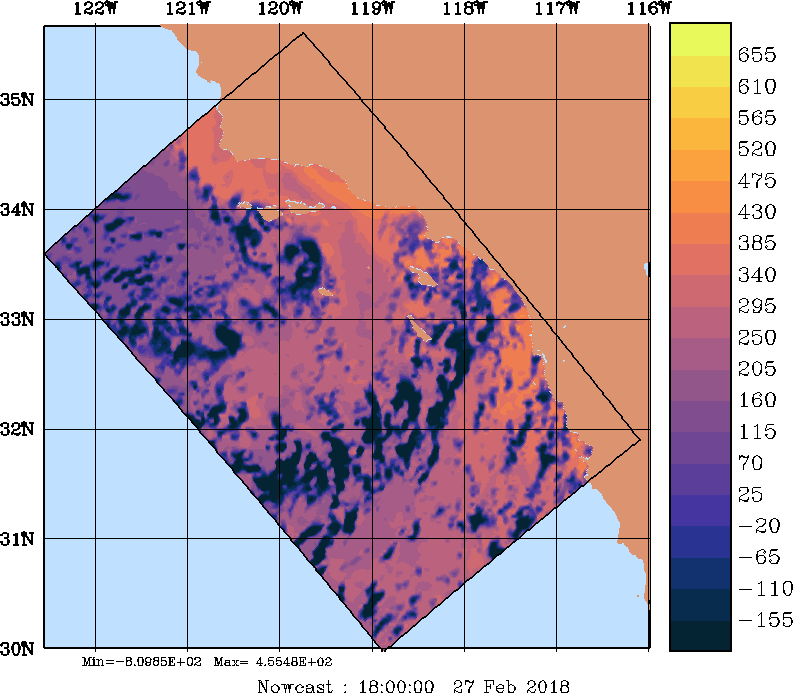
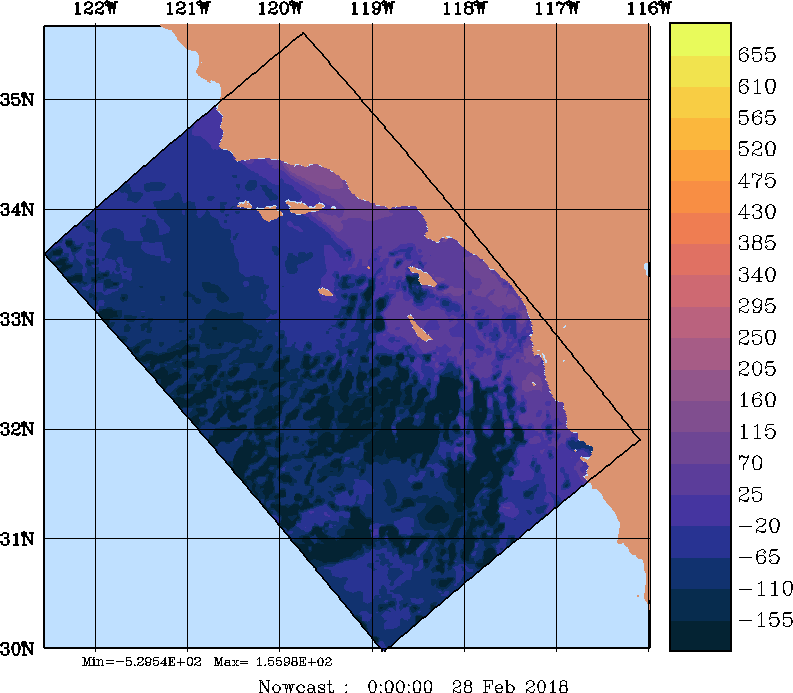
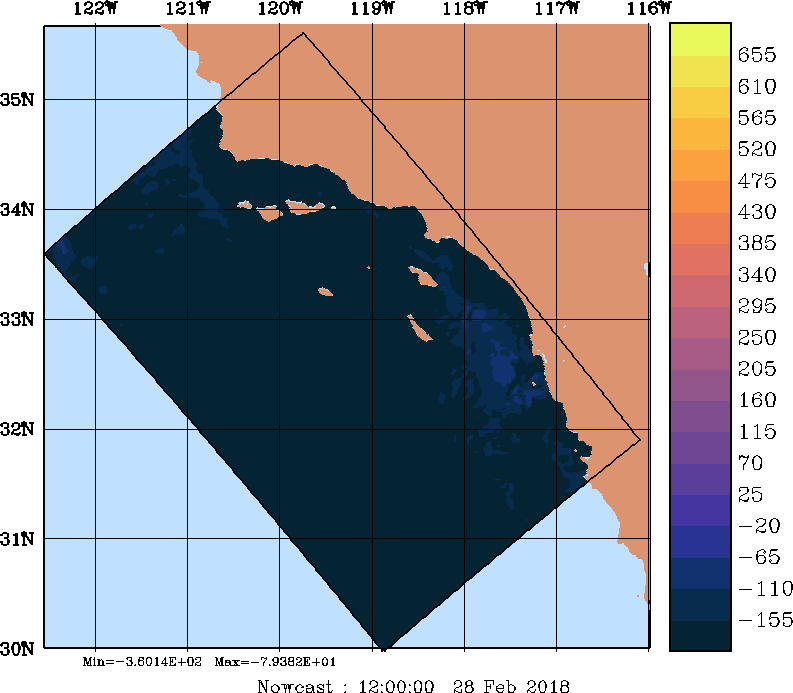
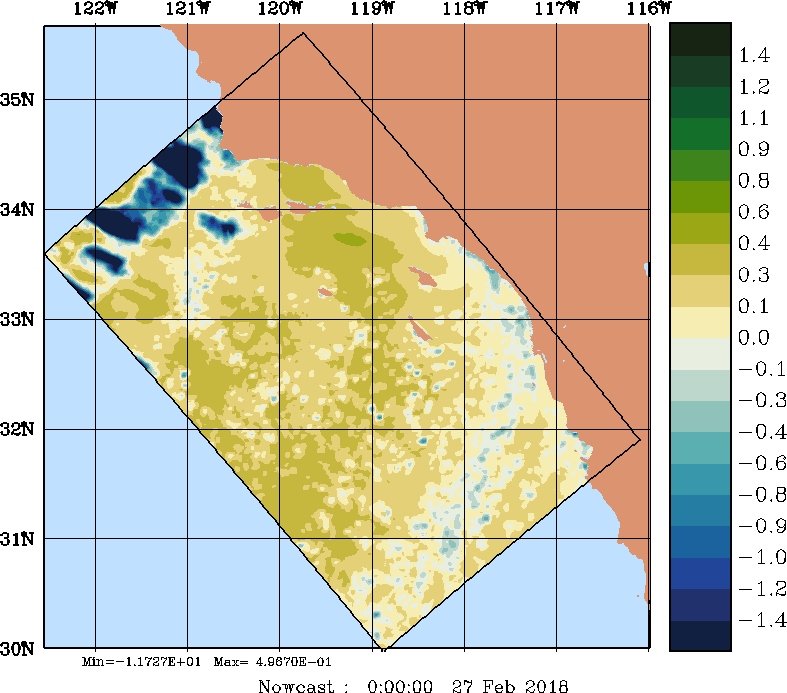
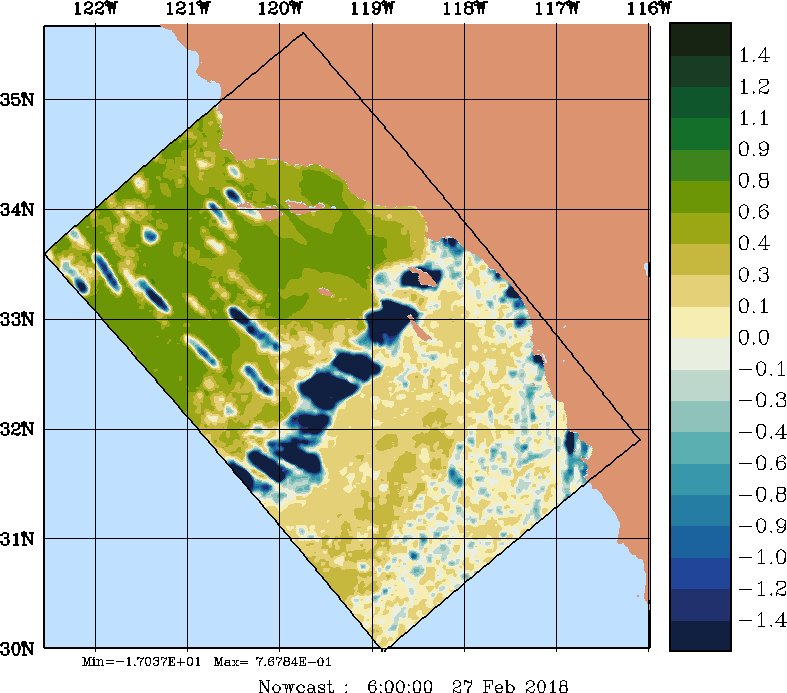
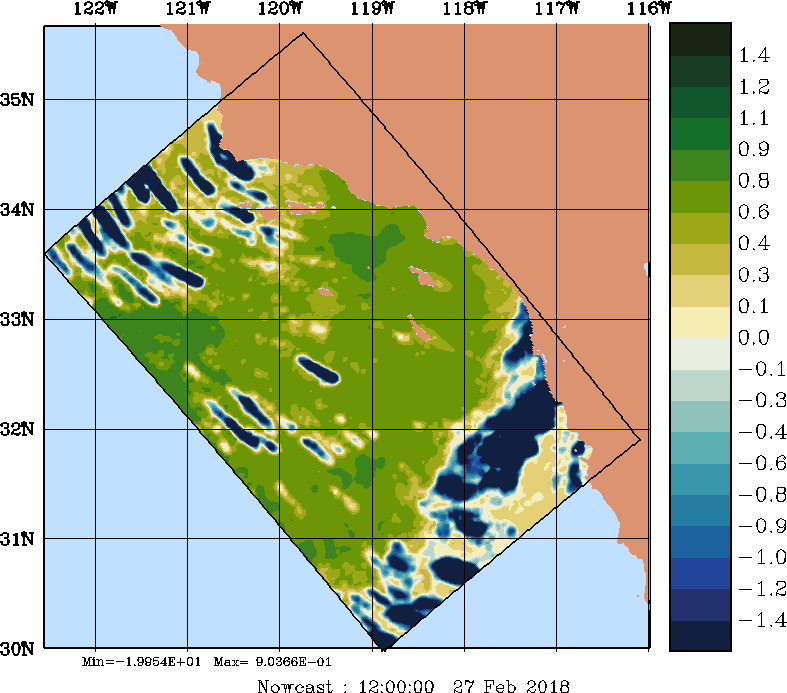
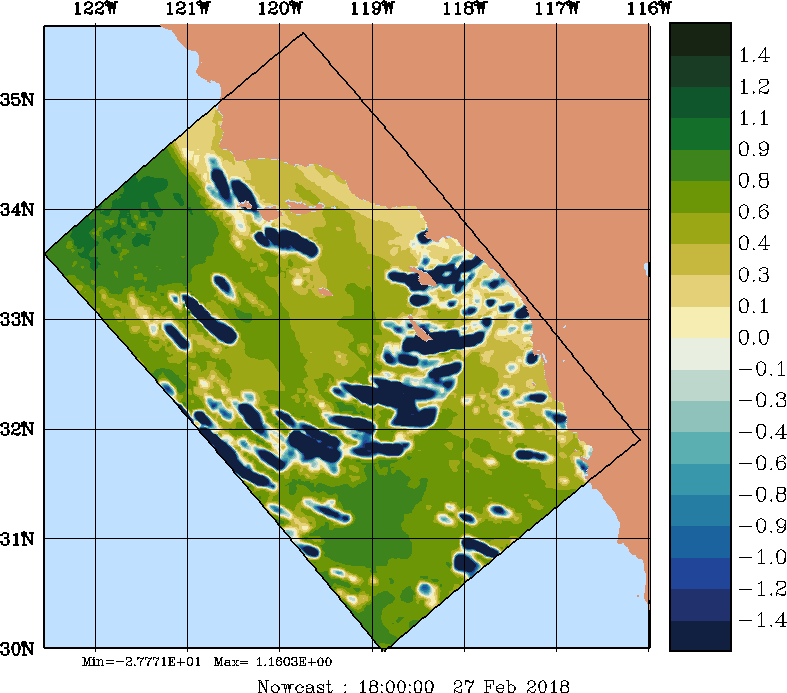
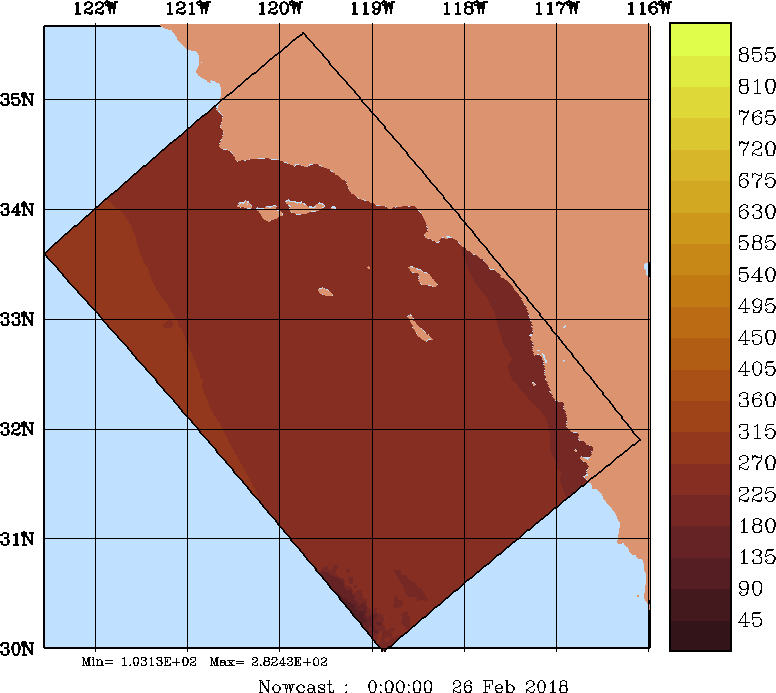
| Net Heat Flux Snapshots (W/m2); processed by MSEAS from NCEP NAM fields | ||||||||||
| 2018 Feb 26 | 2018 Feb 27 | 2018 Feb 28 | ||||||||
| 00Z | 06Z | 12Z | 18Z | 00Z | 06Z | 12Z | 18Z | 00Z | 06Z | 12Z |
|
|
|
|
|
|
|
|
|
|
|
|
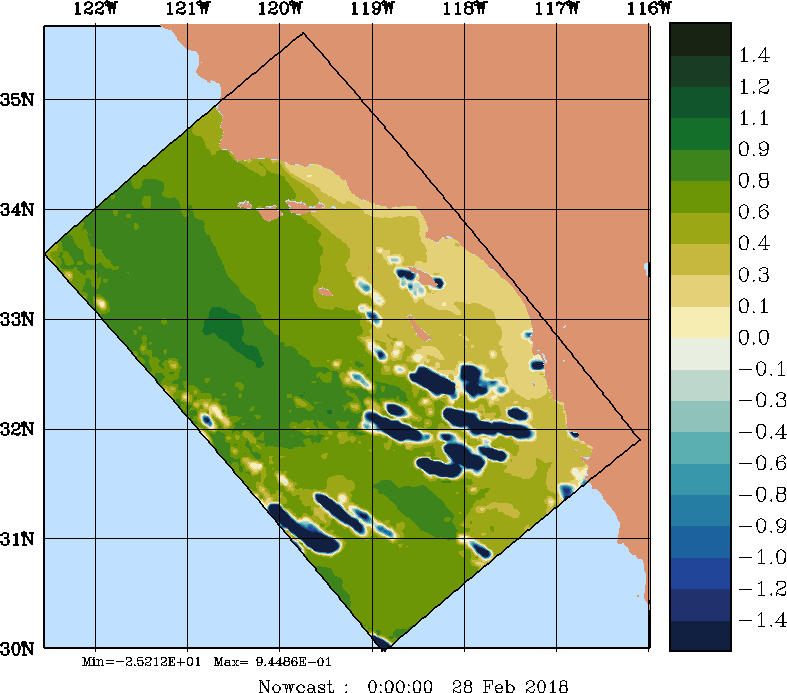
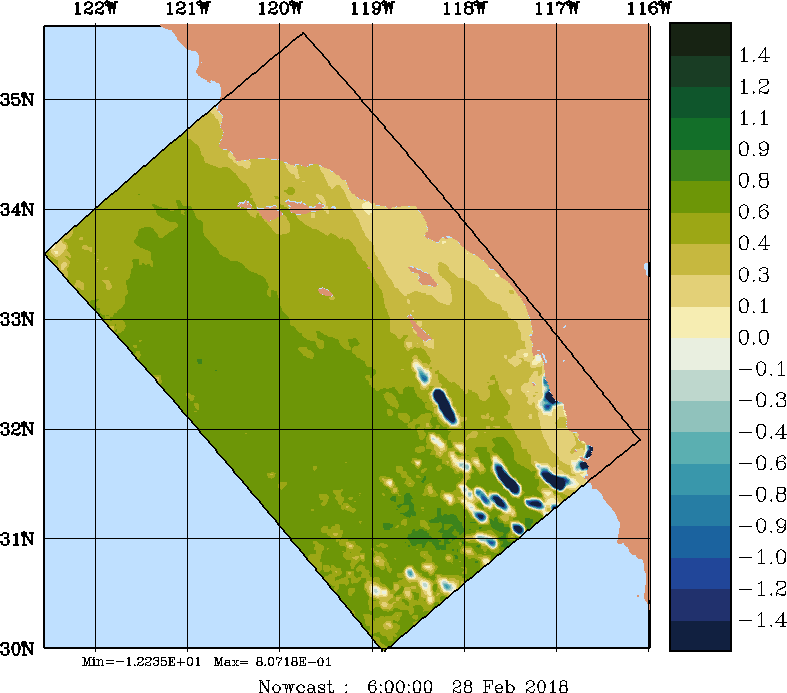
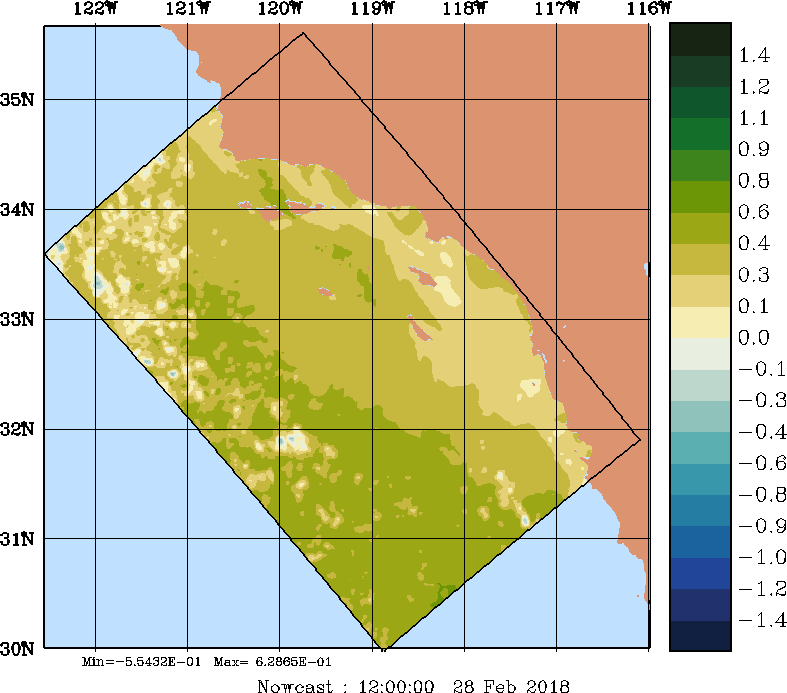
| E - P Snapshots (cm/day); processed by MSEAS from NCEP NAM fields | ||||||||||
| 2018 Feb 26 | 2018 Feb 27 | 2018 Feb 28 | ||||||||
| 00Z | 06Z | 12Z | 18Z | 00Z | 06Z | 12Z | 18Z | 00Z | 06Z | 12Z |
|
|
|
|
|
|
|
|
|
|
|
|
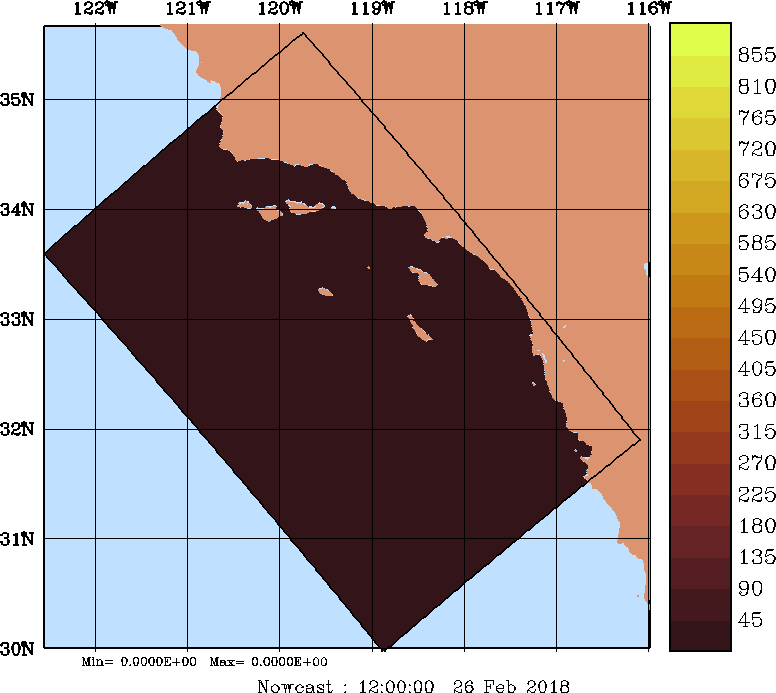
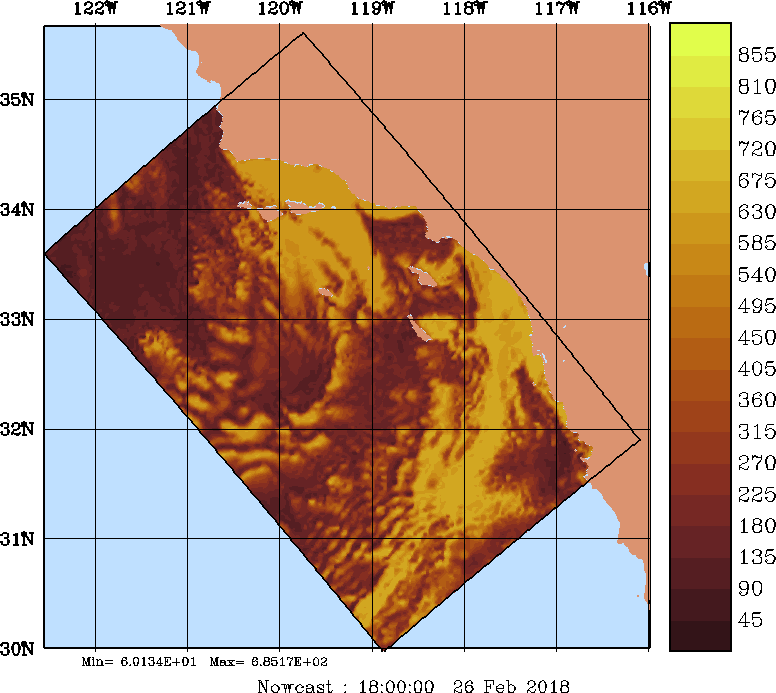
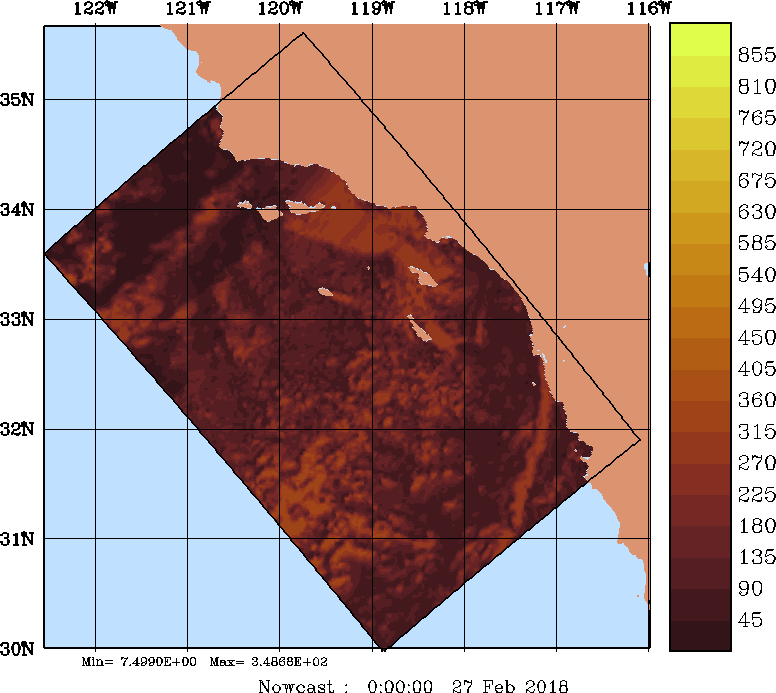
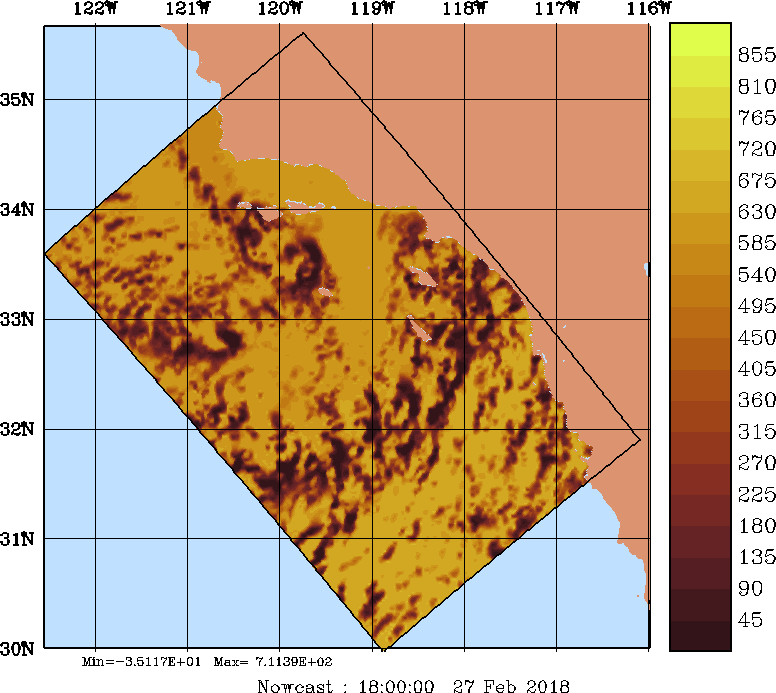
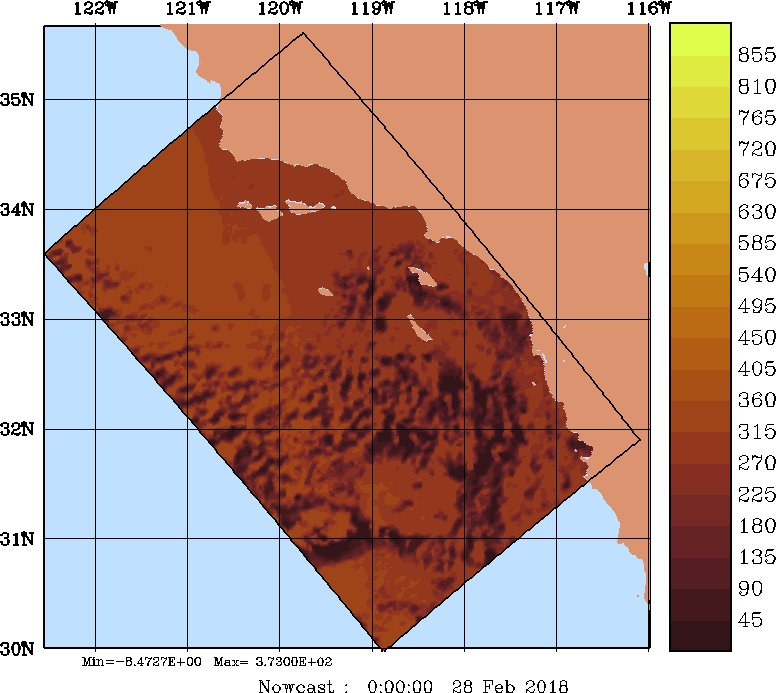
| SW Radiation Snapshots (W/m2); direct from NCEP NAM | ||||||||||
| 2018 Feb 26 | 2018 Feb 27 | 2018 Feb 28 | ||||||||
| 00Z | 06Z | 12Z | 18Z | 00Z | 06Z | 12Z | 18Z | 00Z | 06Z | 12Z |
|
|
|
|
|
|
|
|
|
|
|
|