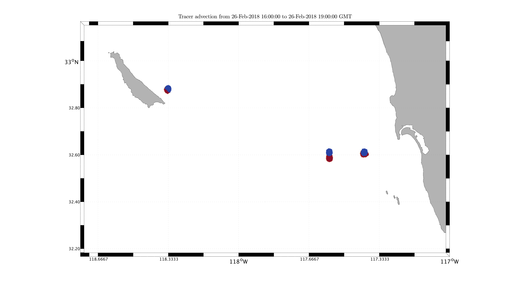
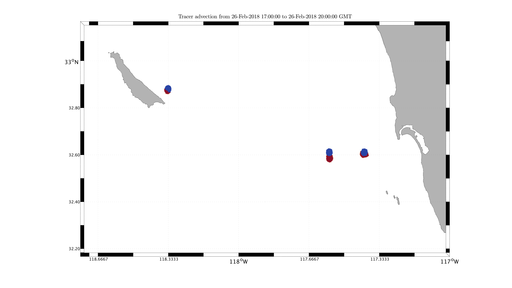
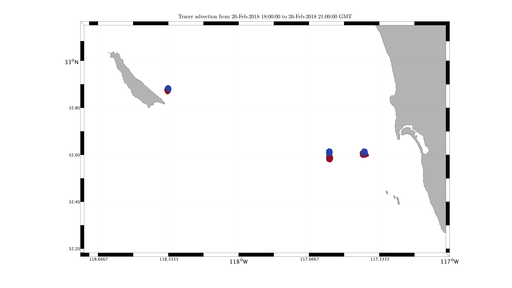
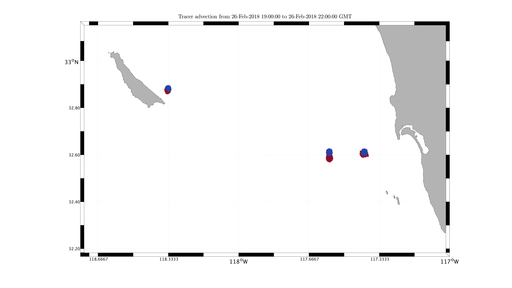
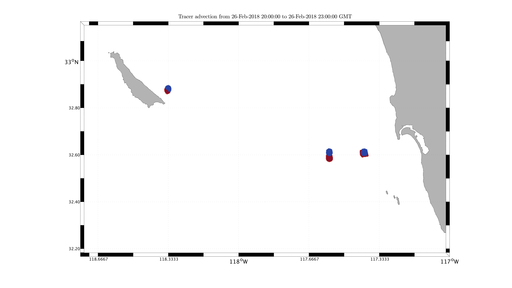
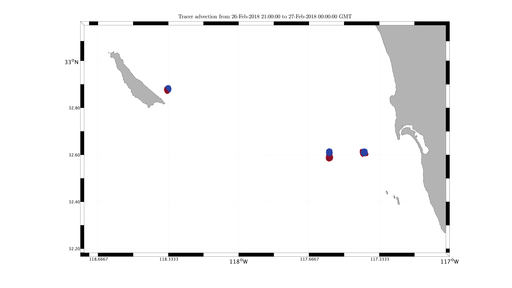
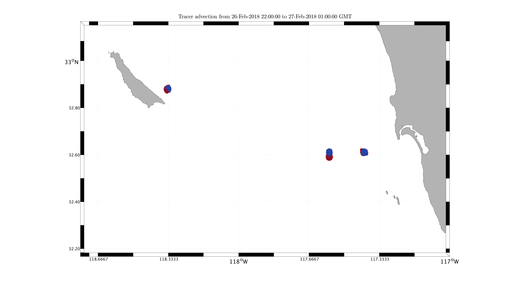
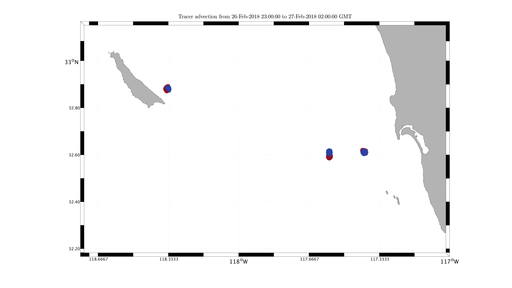
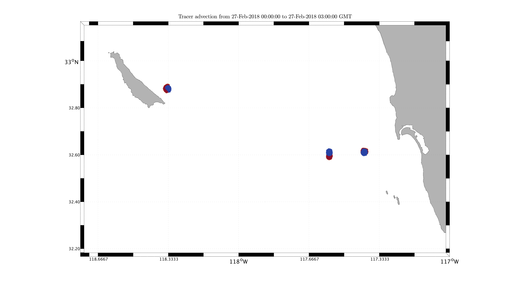
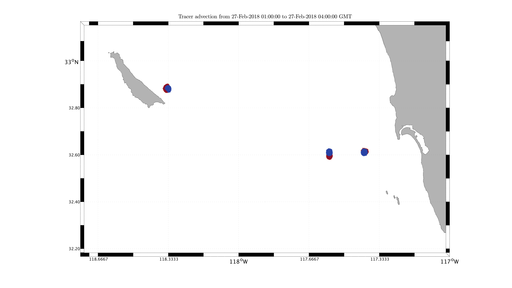
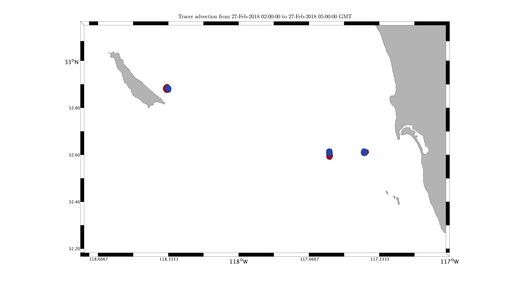
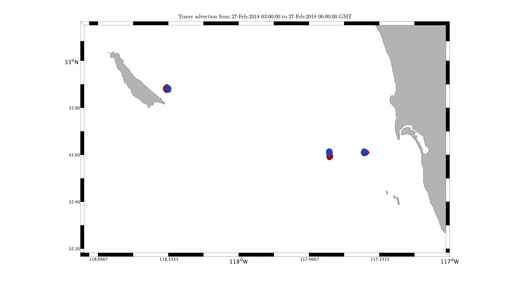
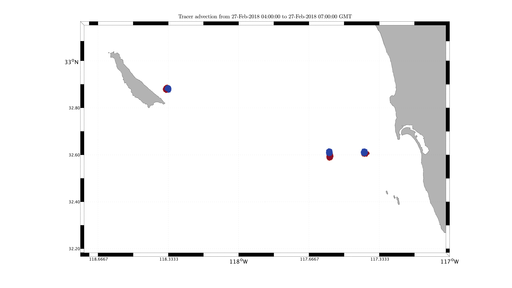
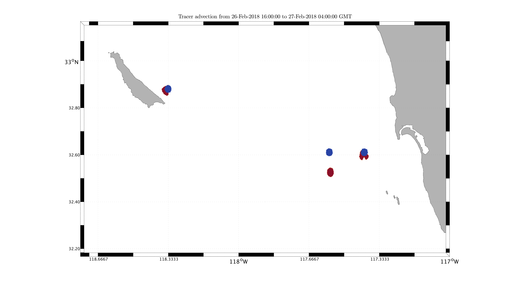
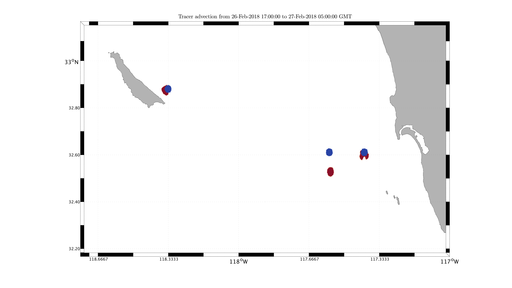
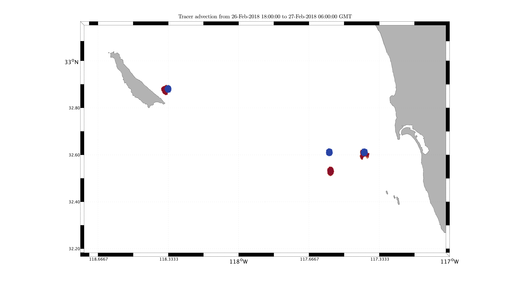
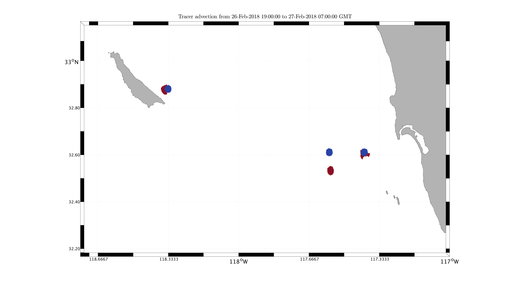
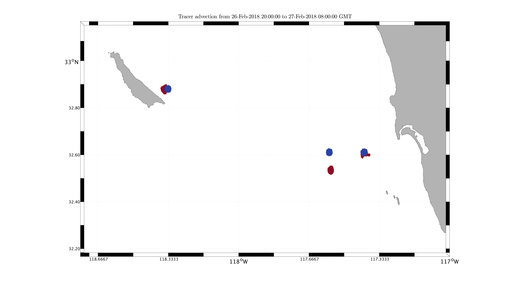
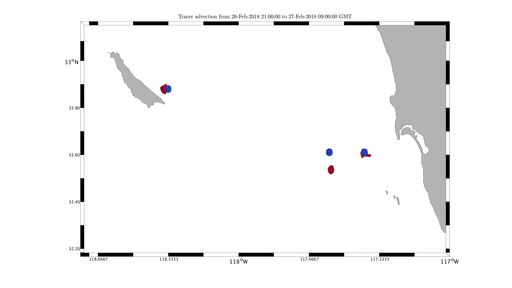
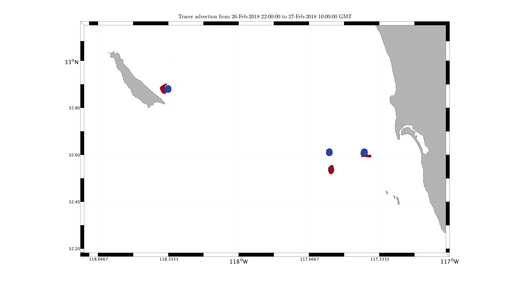
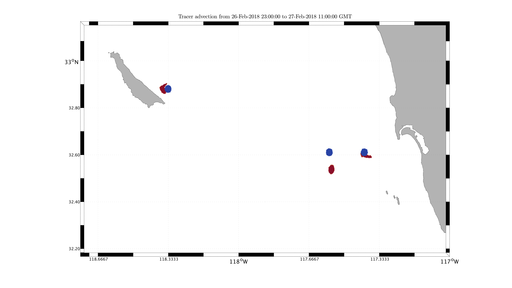
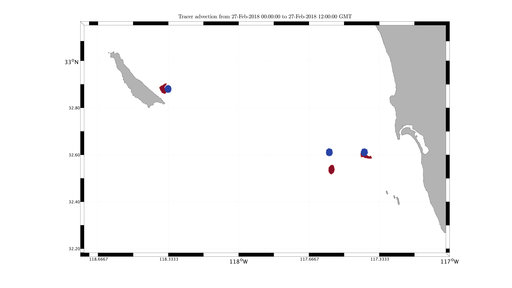
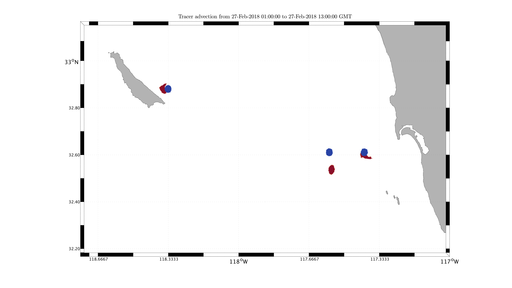
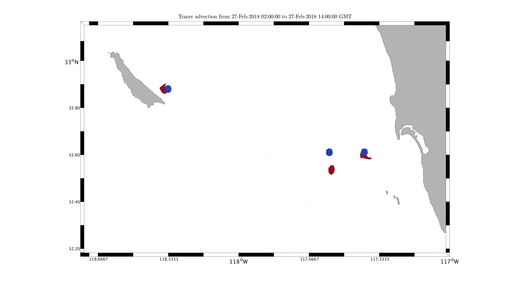
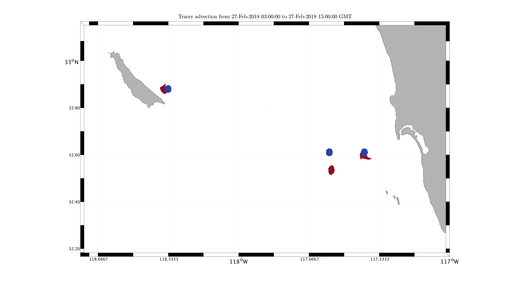
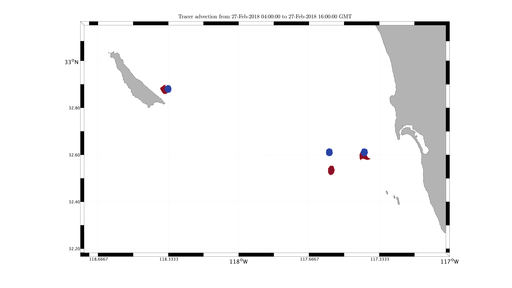
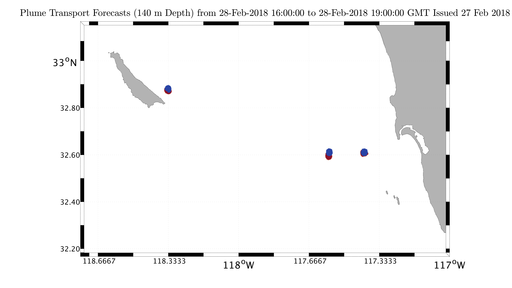
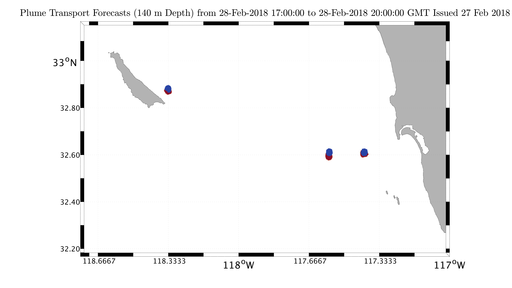
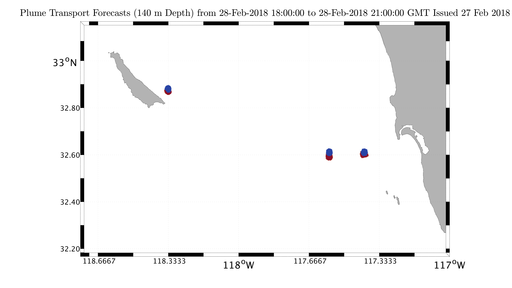
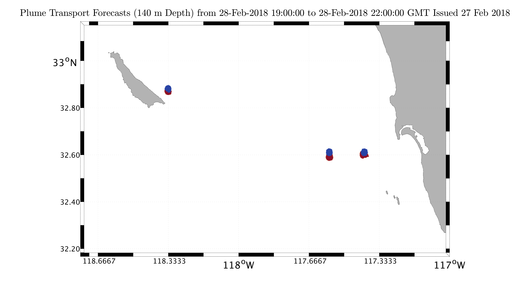
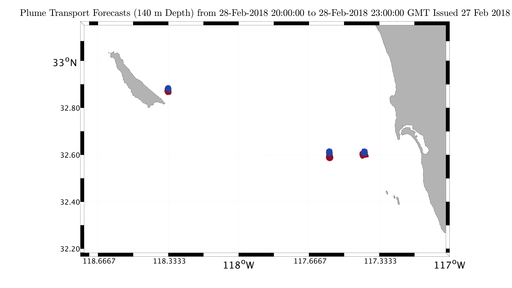
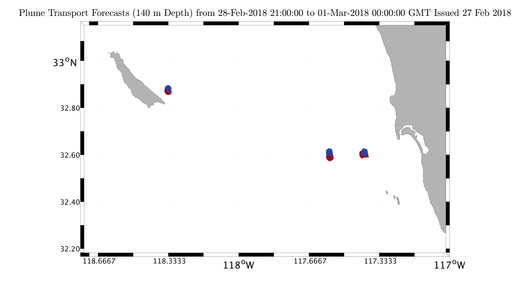
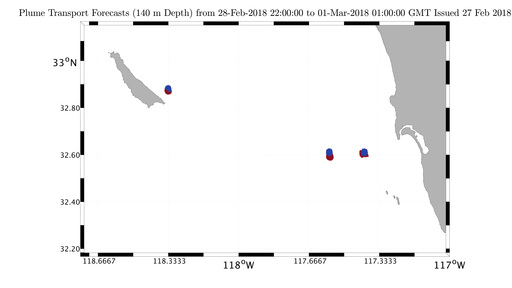
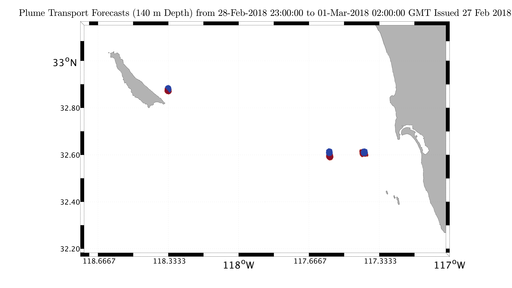
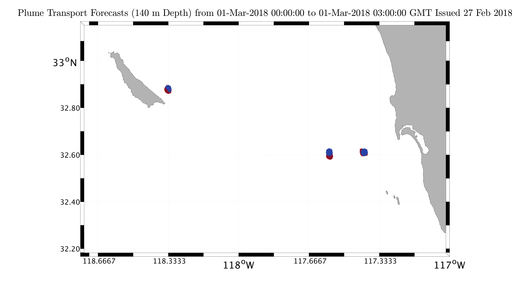
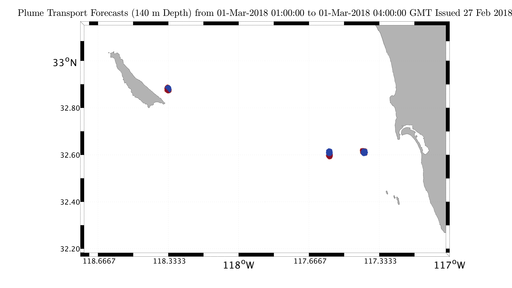
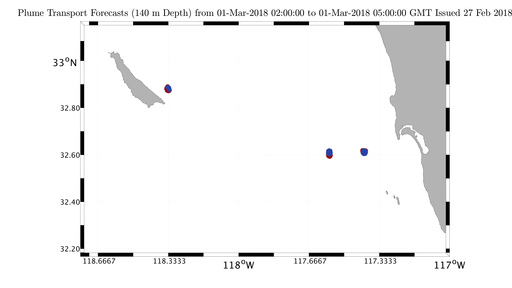
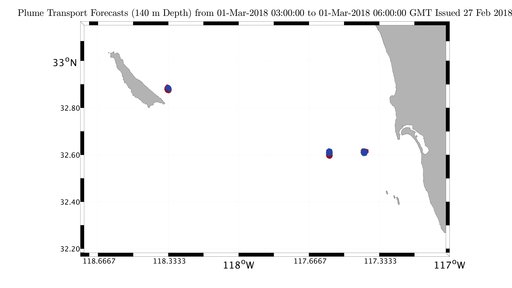
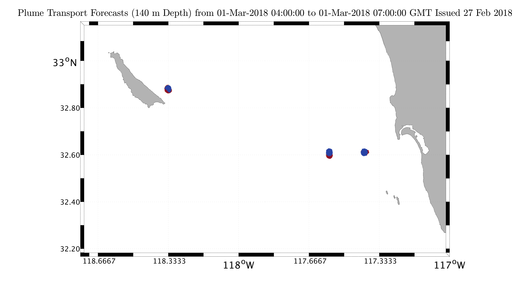
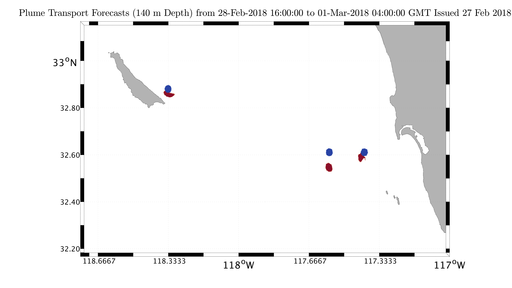
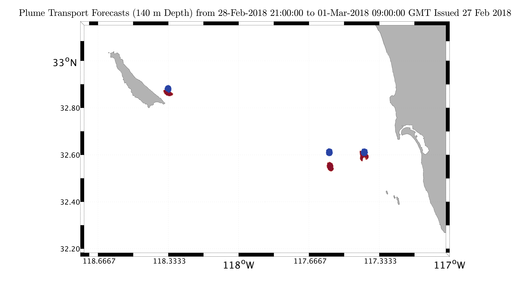
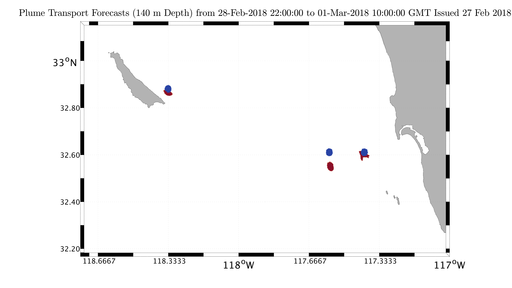
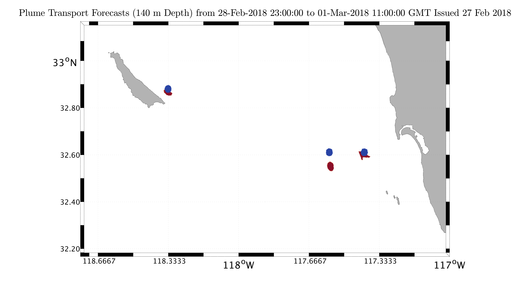
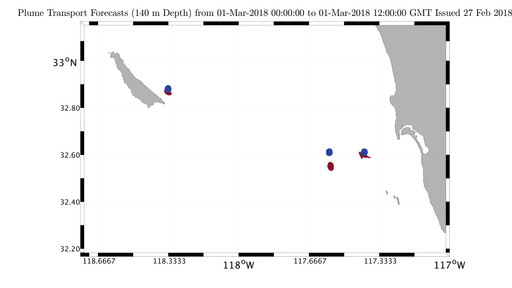
The following figures show the initial (blue) and final (brown) forecast positions of sediment plumes. The plumes are released at a depth of 140m, at three potential locations and at different times during day time in California. These flow map computations are for a time duration of 3 or 12 hours (rows) for the forecasts of 26 February 2018 to 27 February 2018 and 28 February 2018 to 01 March 2018. The release time (columns) shifts in 1 hour intervals. The flow maps were calculated by a PDE based approach, using 5th order spatial and 3rd order temporal schemes, and a novel composition based approach.
As a reminder, 12:00Z = 04:00 PST, i.e., California local time is 8 hours behind Zulu time.
| Time | 16:00Z | 17:00Z | 18:00Z | 19:00Z | 20:00Z | 21:00Z | 22:00Z | 23:00Z | 00:00Z | 01:00Z | 02:00Z | 03:00Z | 04:00Z |
|---|---|---|---|---|---|---|---|---|---|---|---|---|---|
| 3-hour Duration |
 |
 |
 |
 |
 |
 |
 |
 |
 |
 |
 |
 |
 |
| 12-hour Duration |
 |
 |
 |
 |
 |
 |
 |
 |
 |
 |
 |
 |
 |
| Time | 16:00Z | 17:00Z | 18:00Z | 19:00Z | 20:00Z | 21:00Z | 22:00Z | 23:00Z | 00:00Z | 01:00Z | 02:00Z | 03:00Z | 04:00Z |
|---|---|---|---|---|---|---|---|---|---|---|---|---|---|
| 3-hour Duration |
 |
 |
 |
 |
 |
 |
 |
 |
 |
 |
 |
 |
 |
| 12-hour Duration |
 |
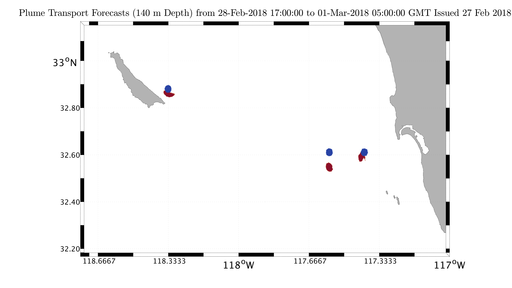 |
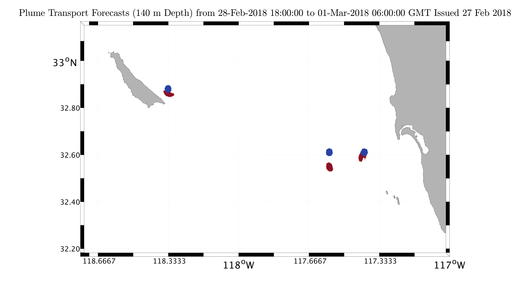 |
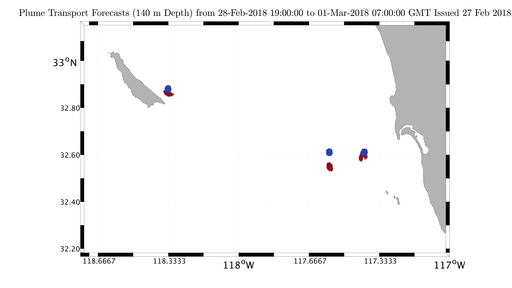 |
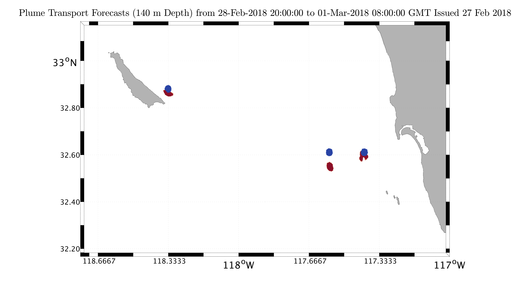 |
 |
 |
 |
 |
 |
 |
 |
 |