MSEAS-PE Fct - Data comparison for Mar 21

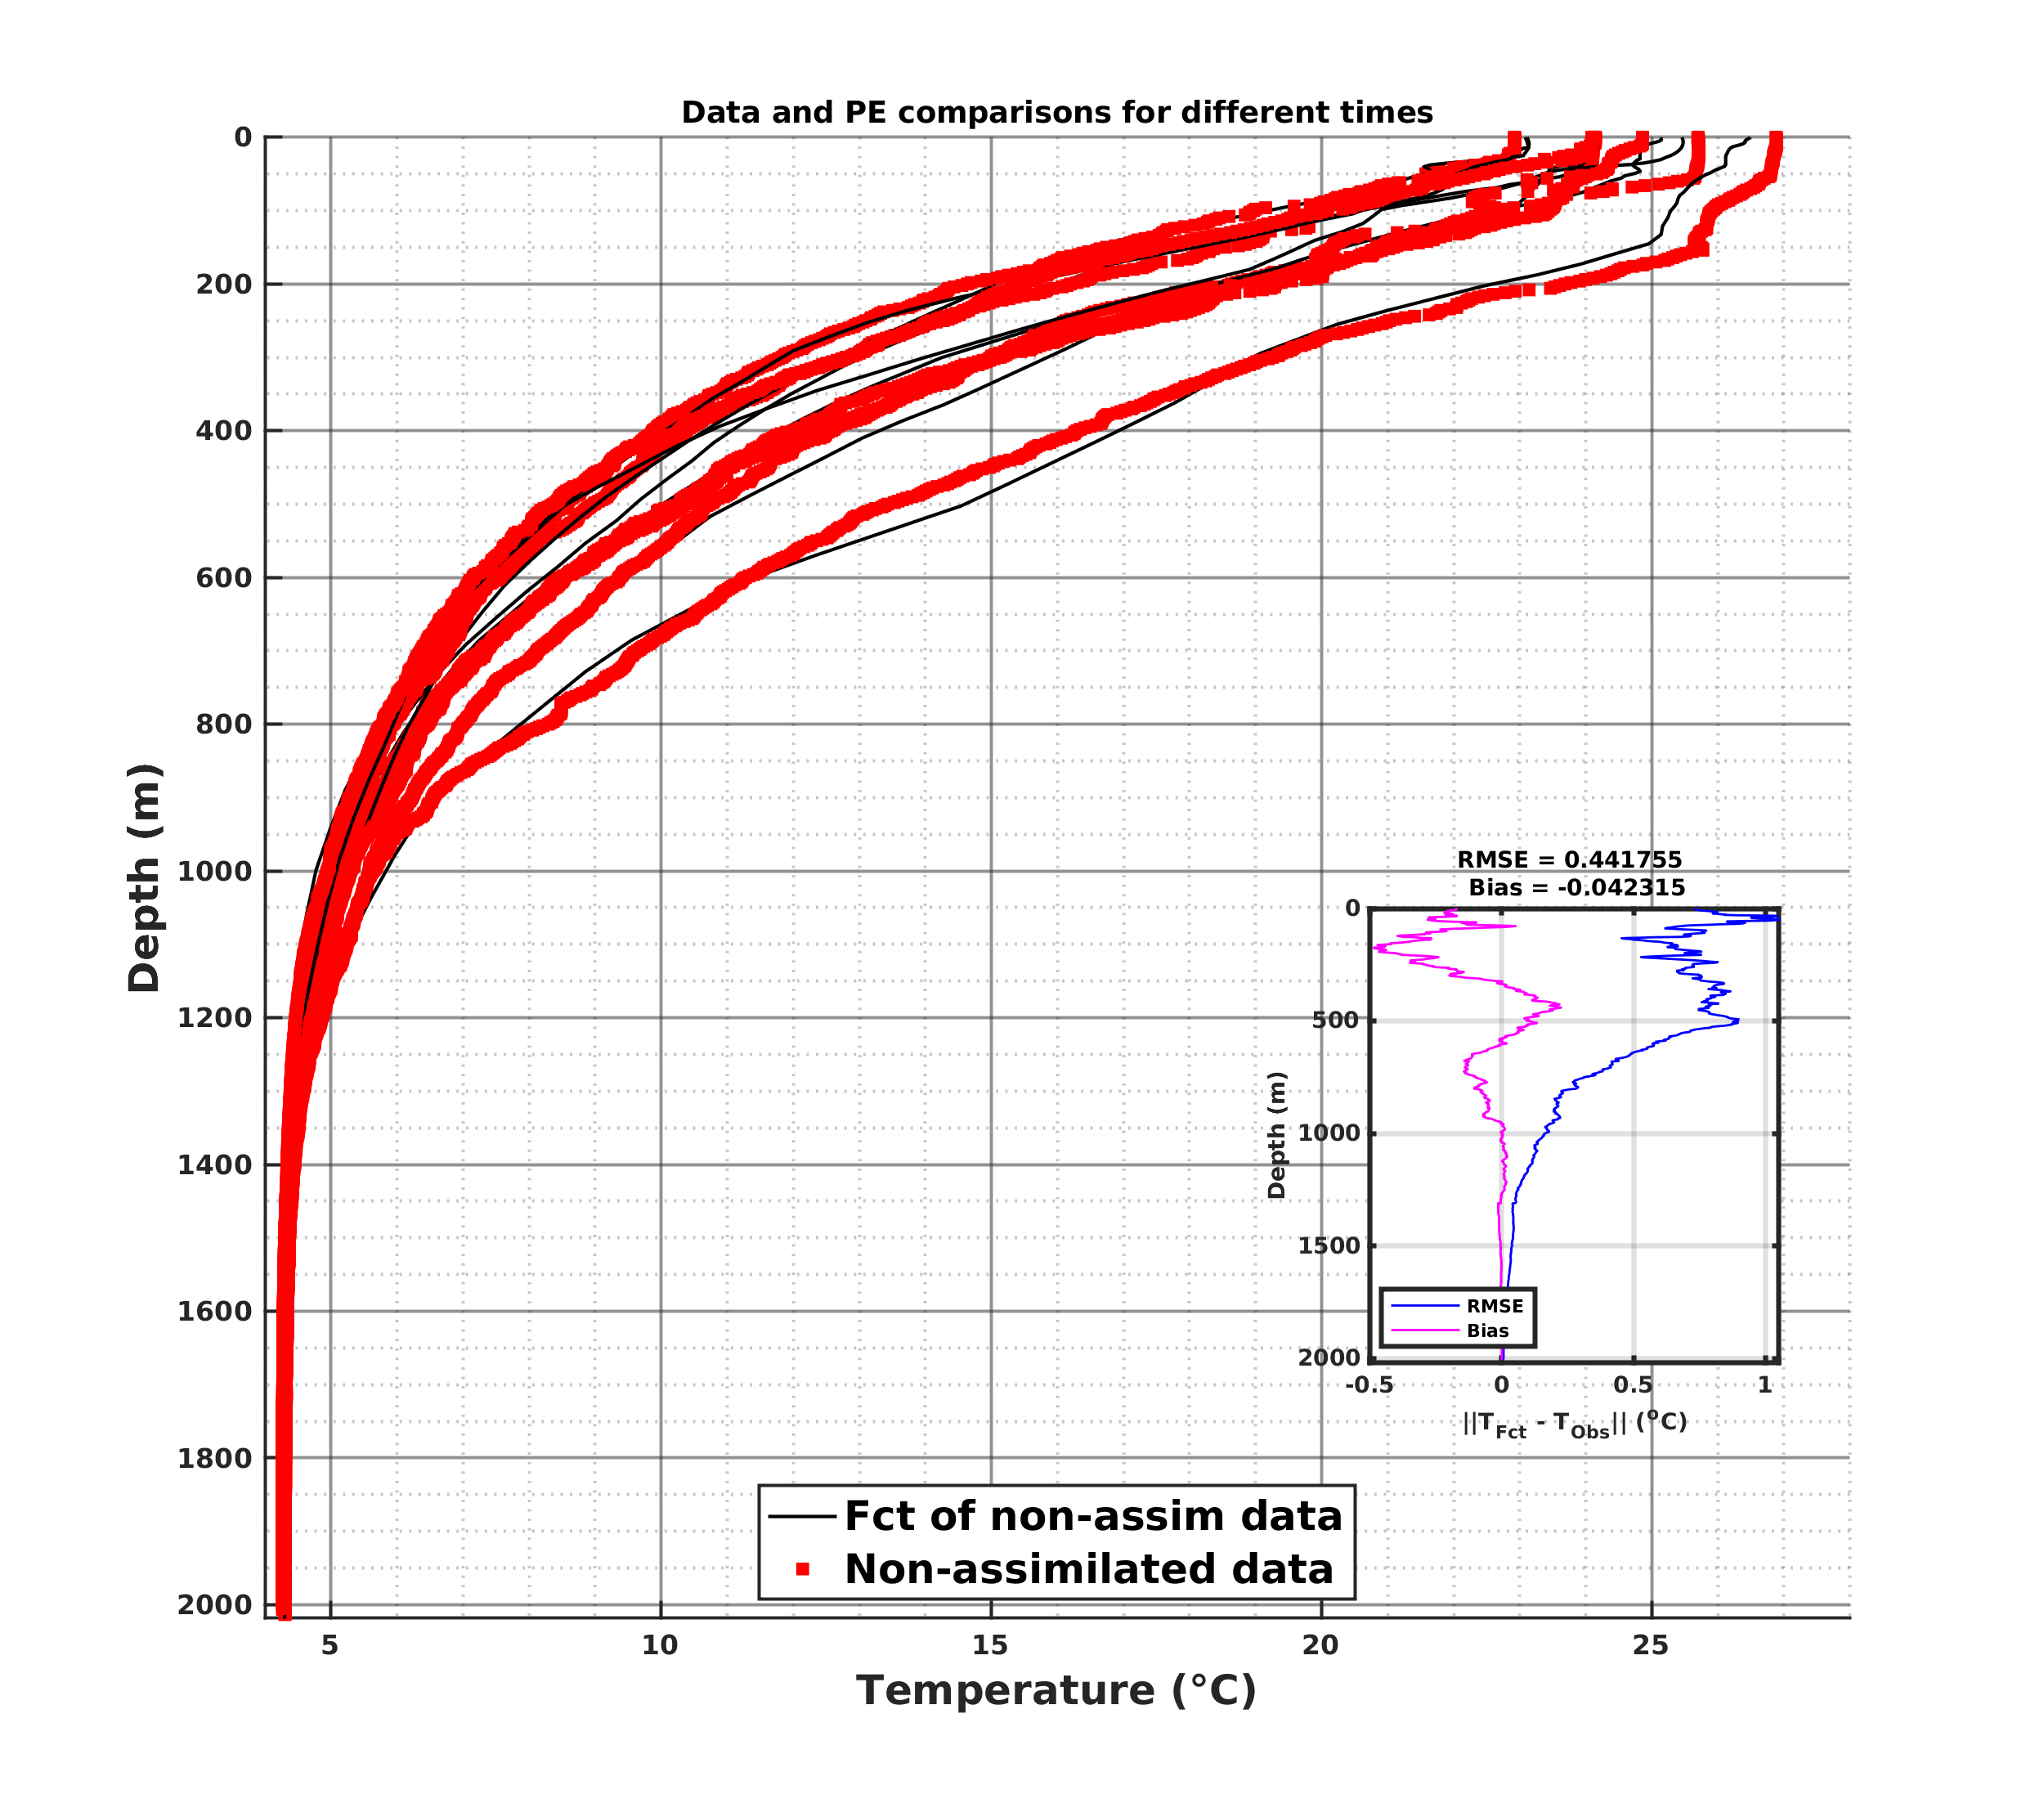
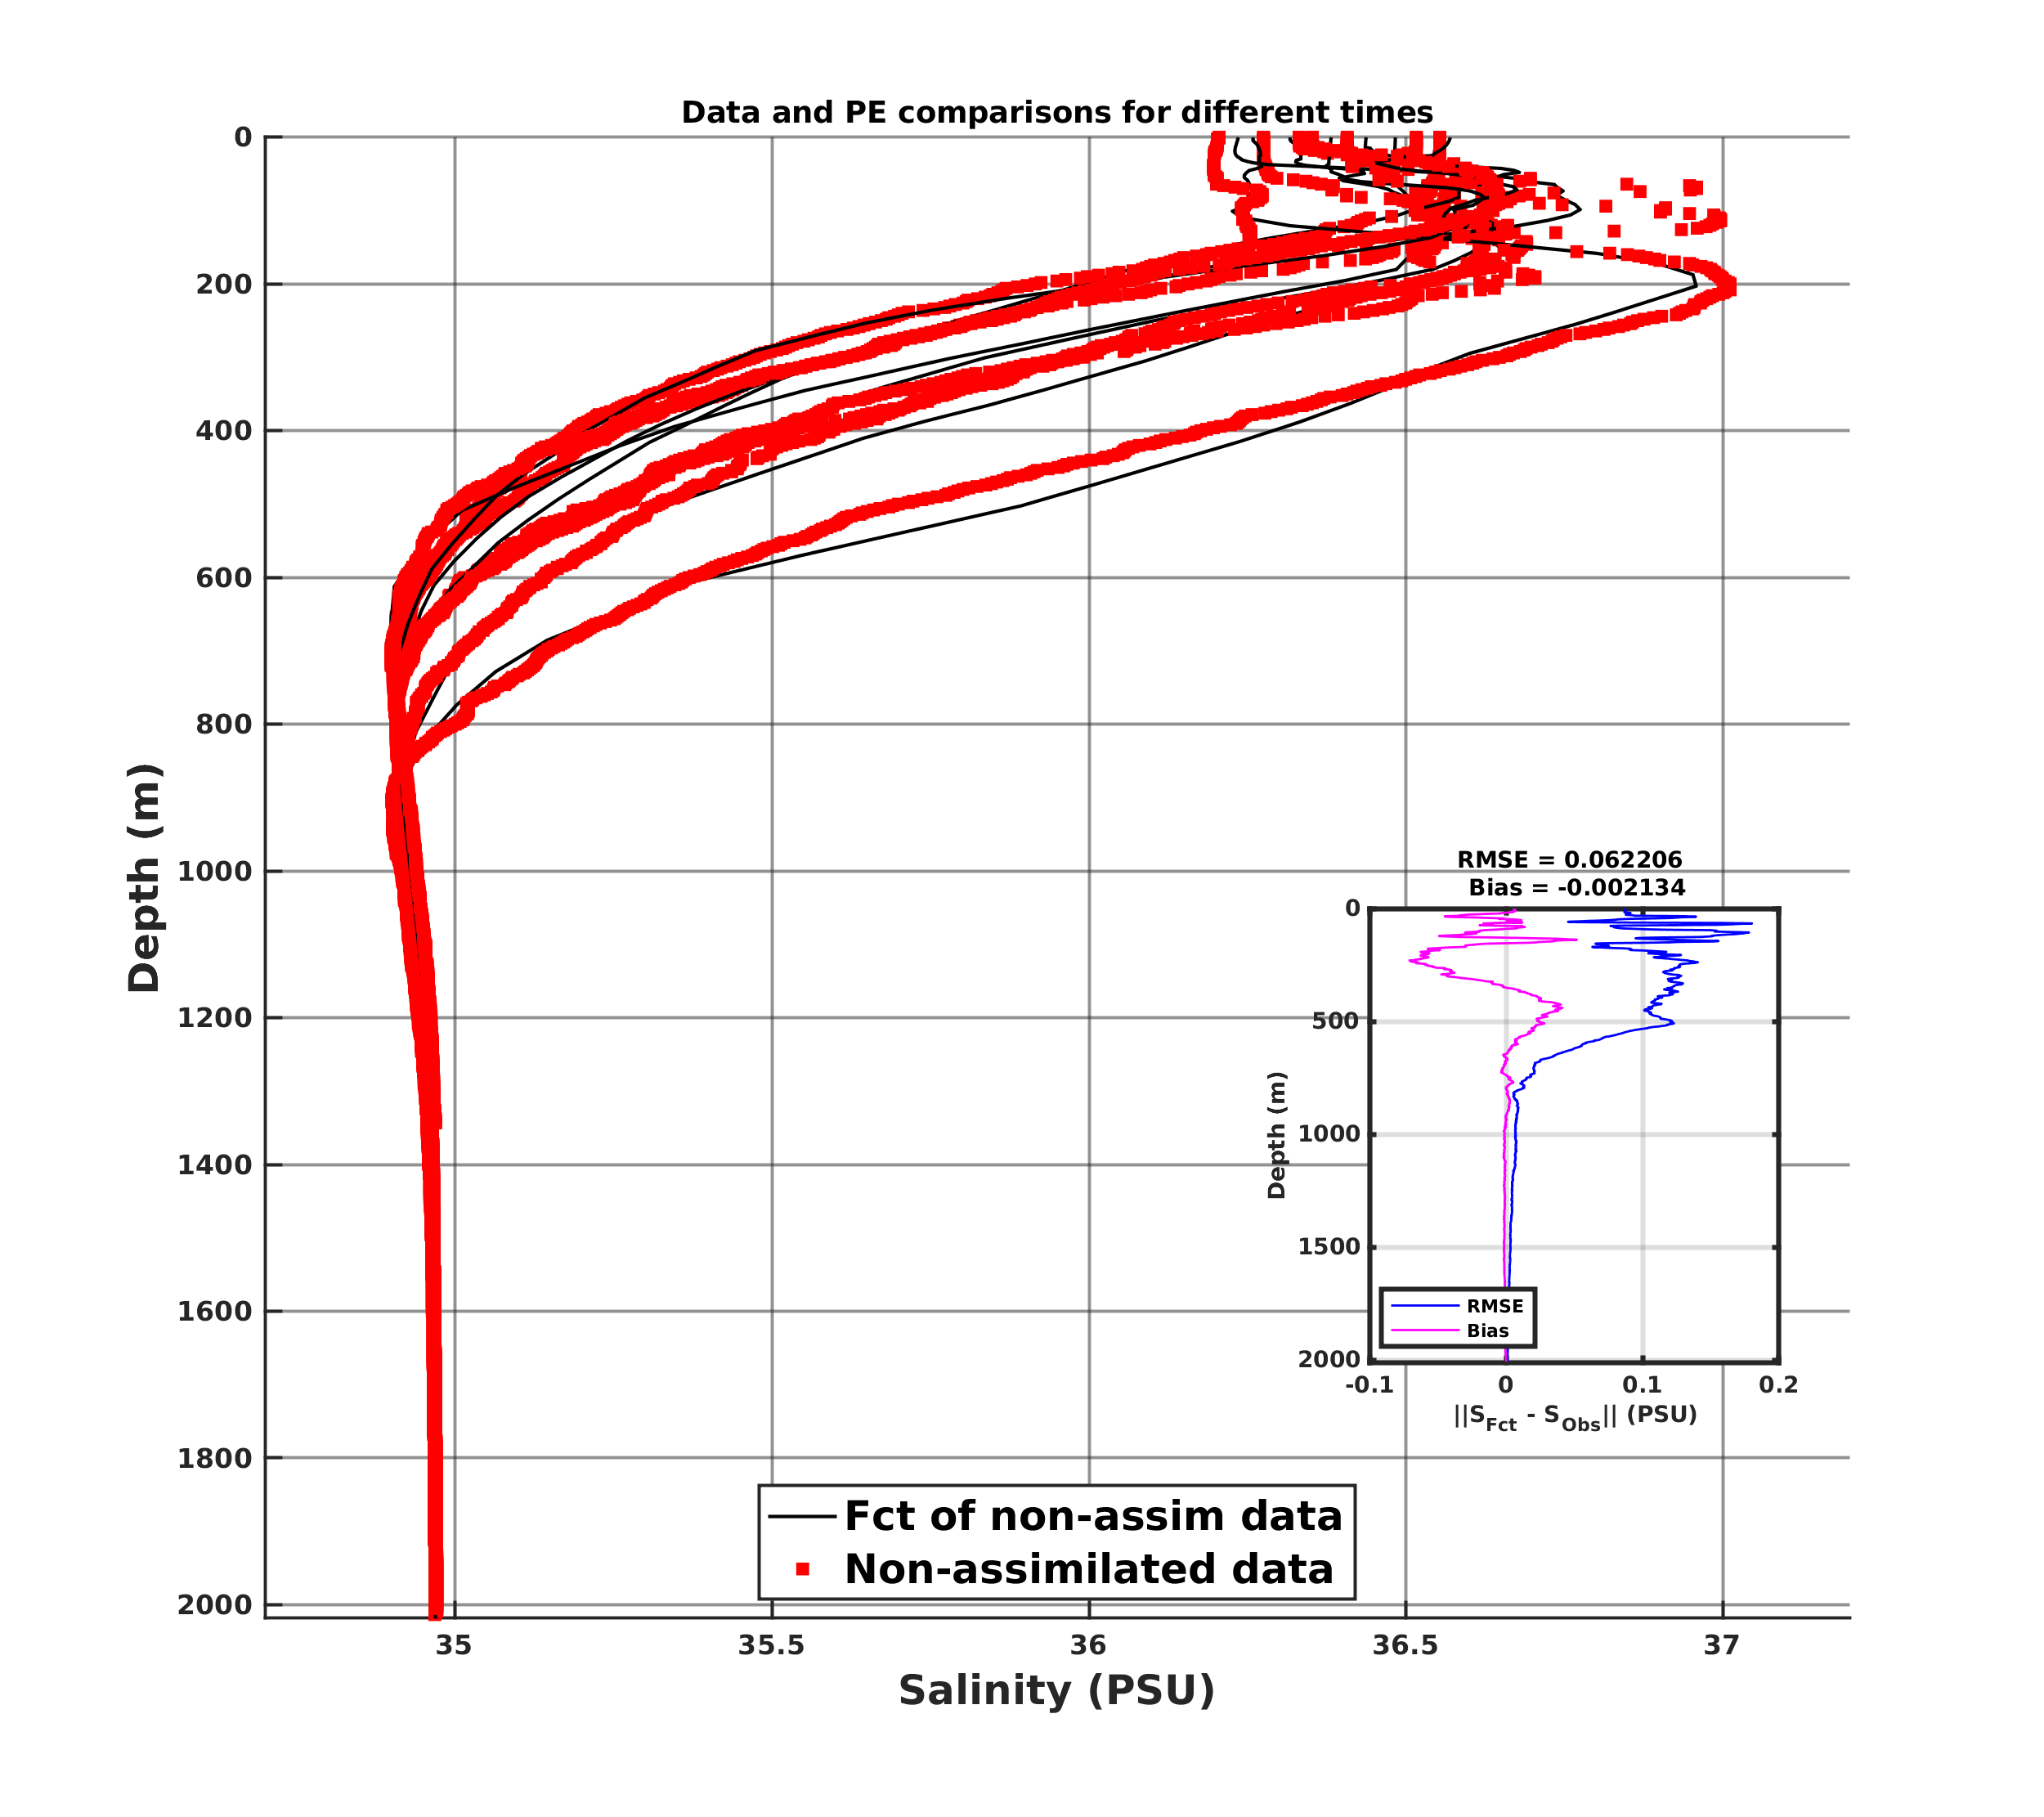
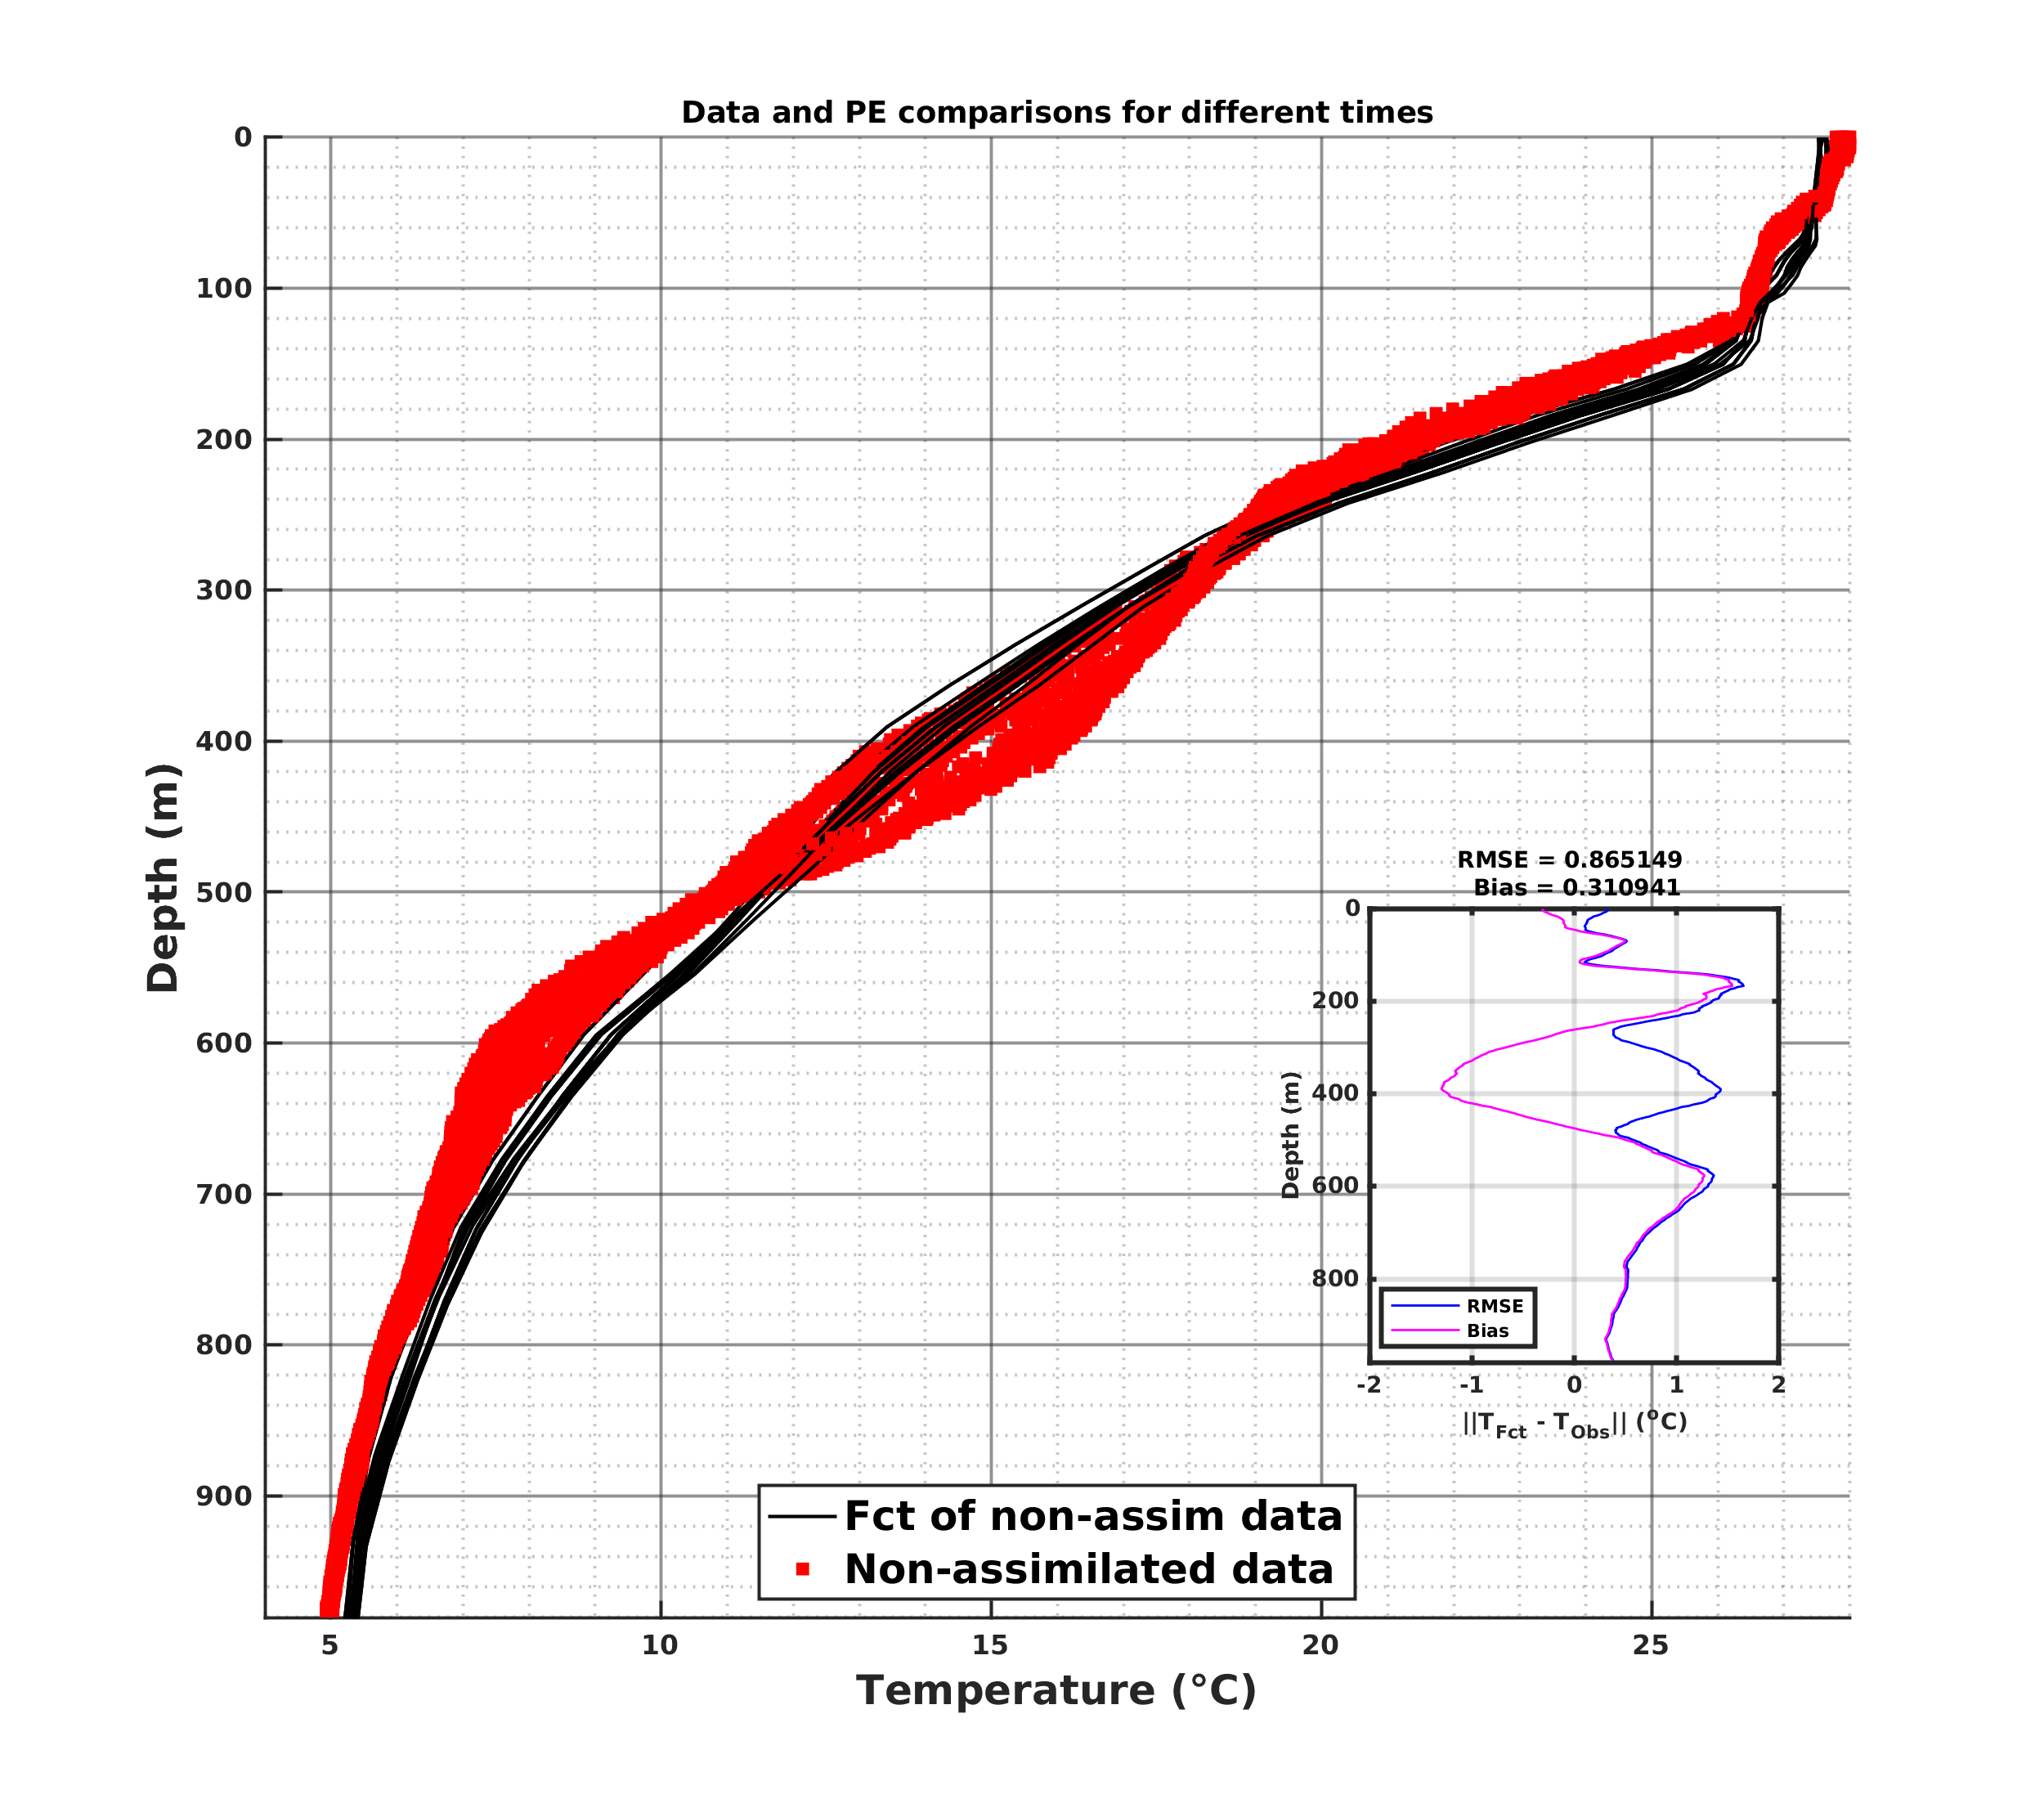
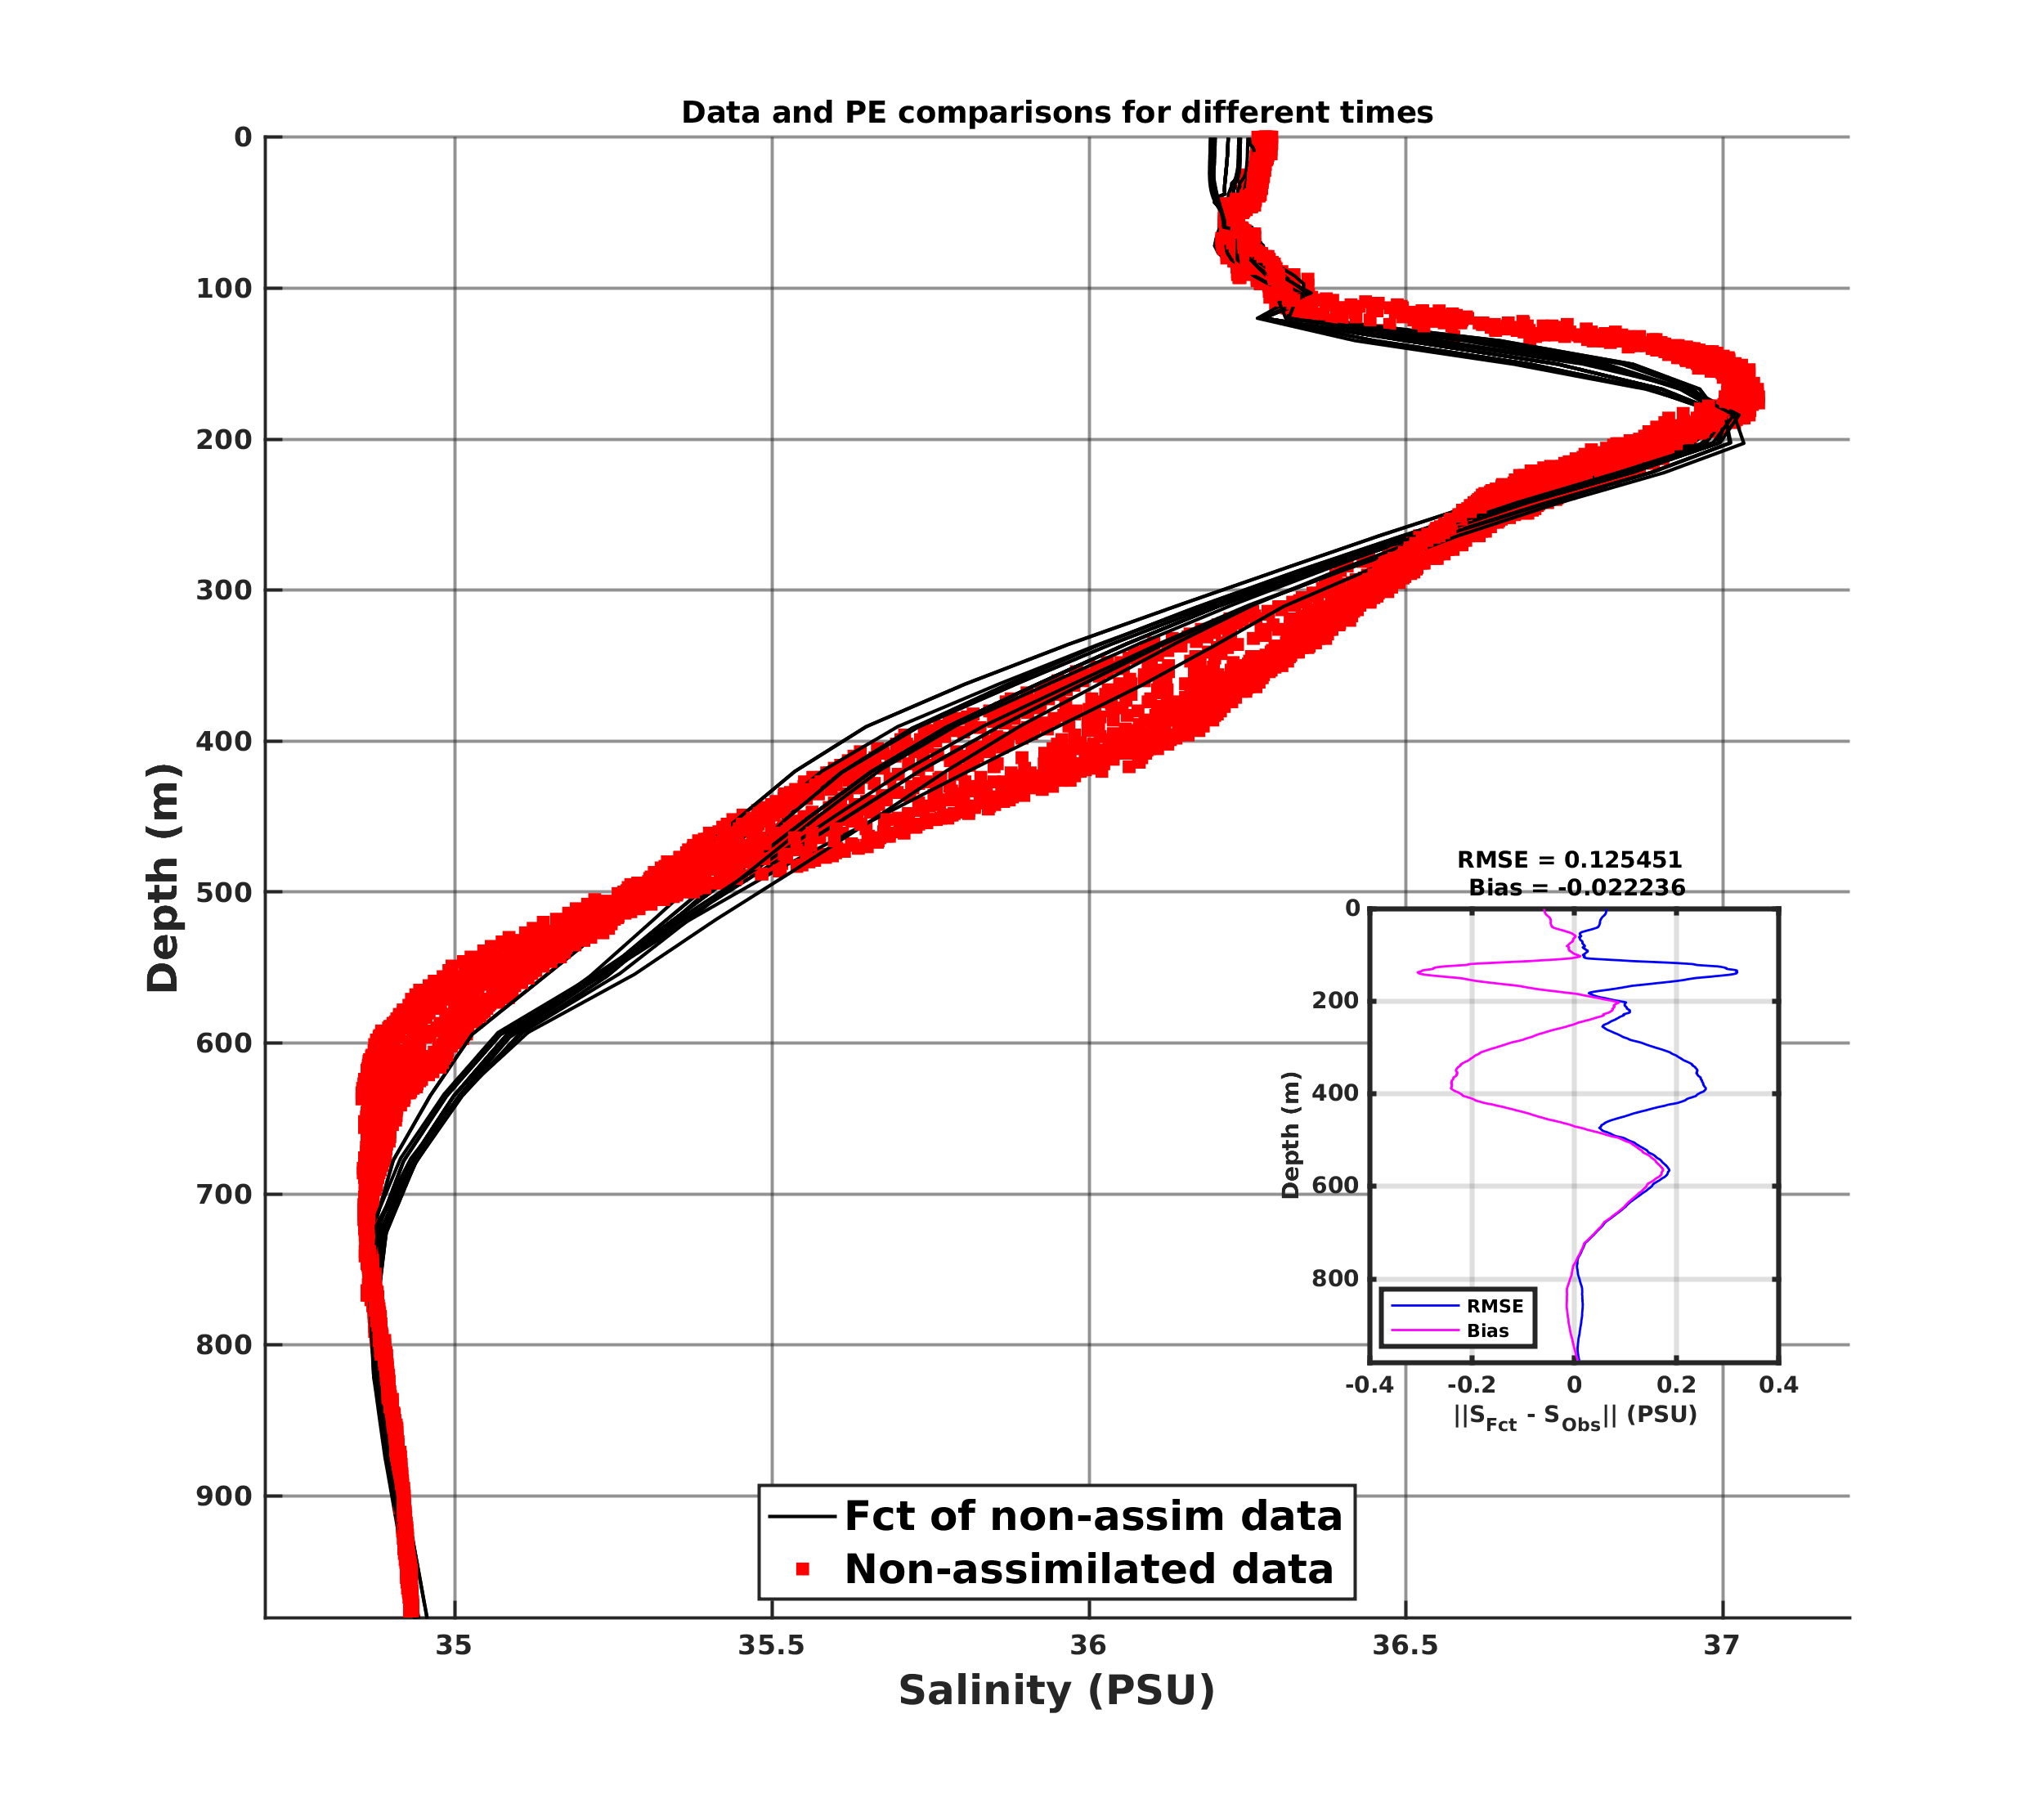
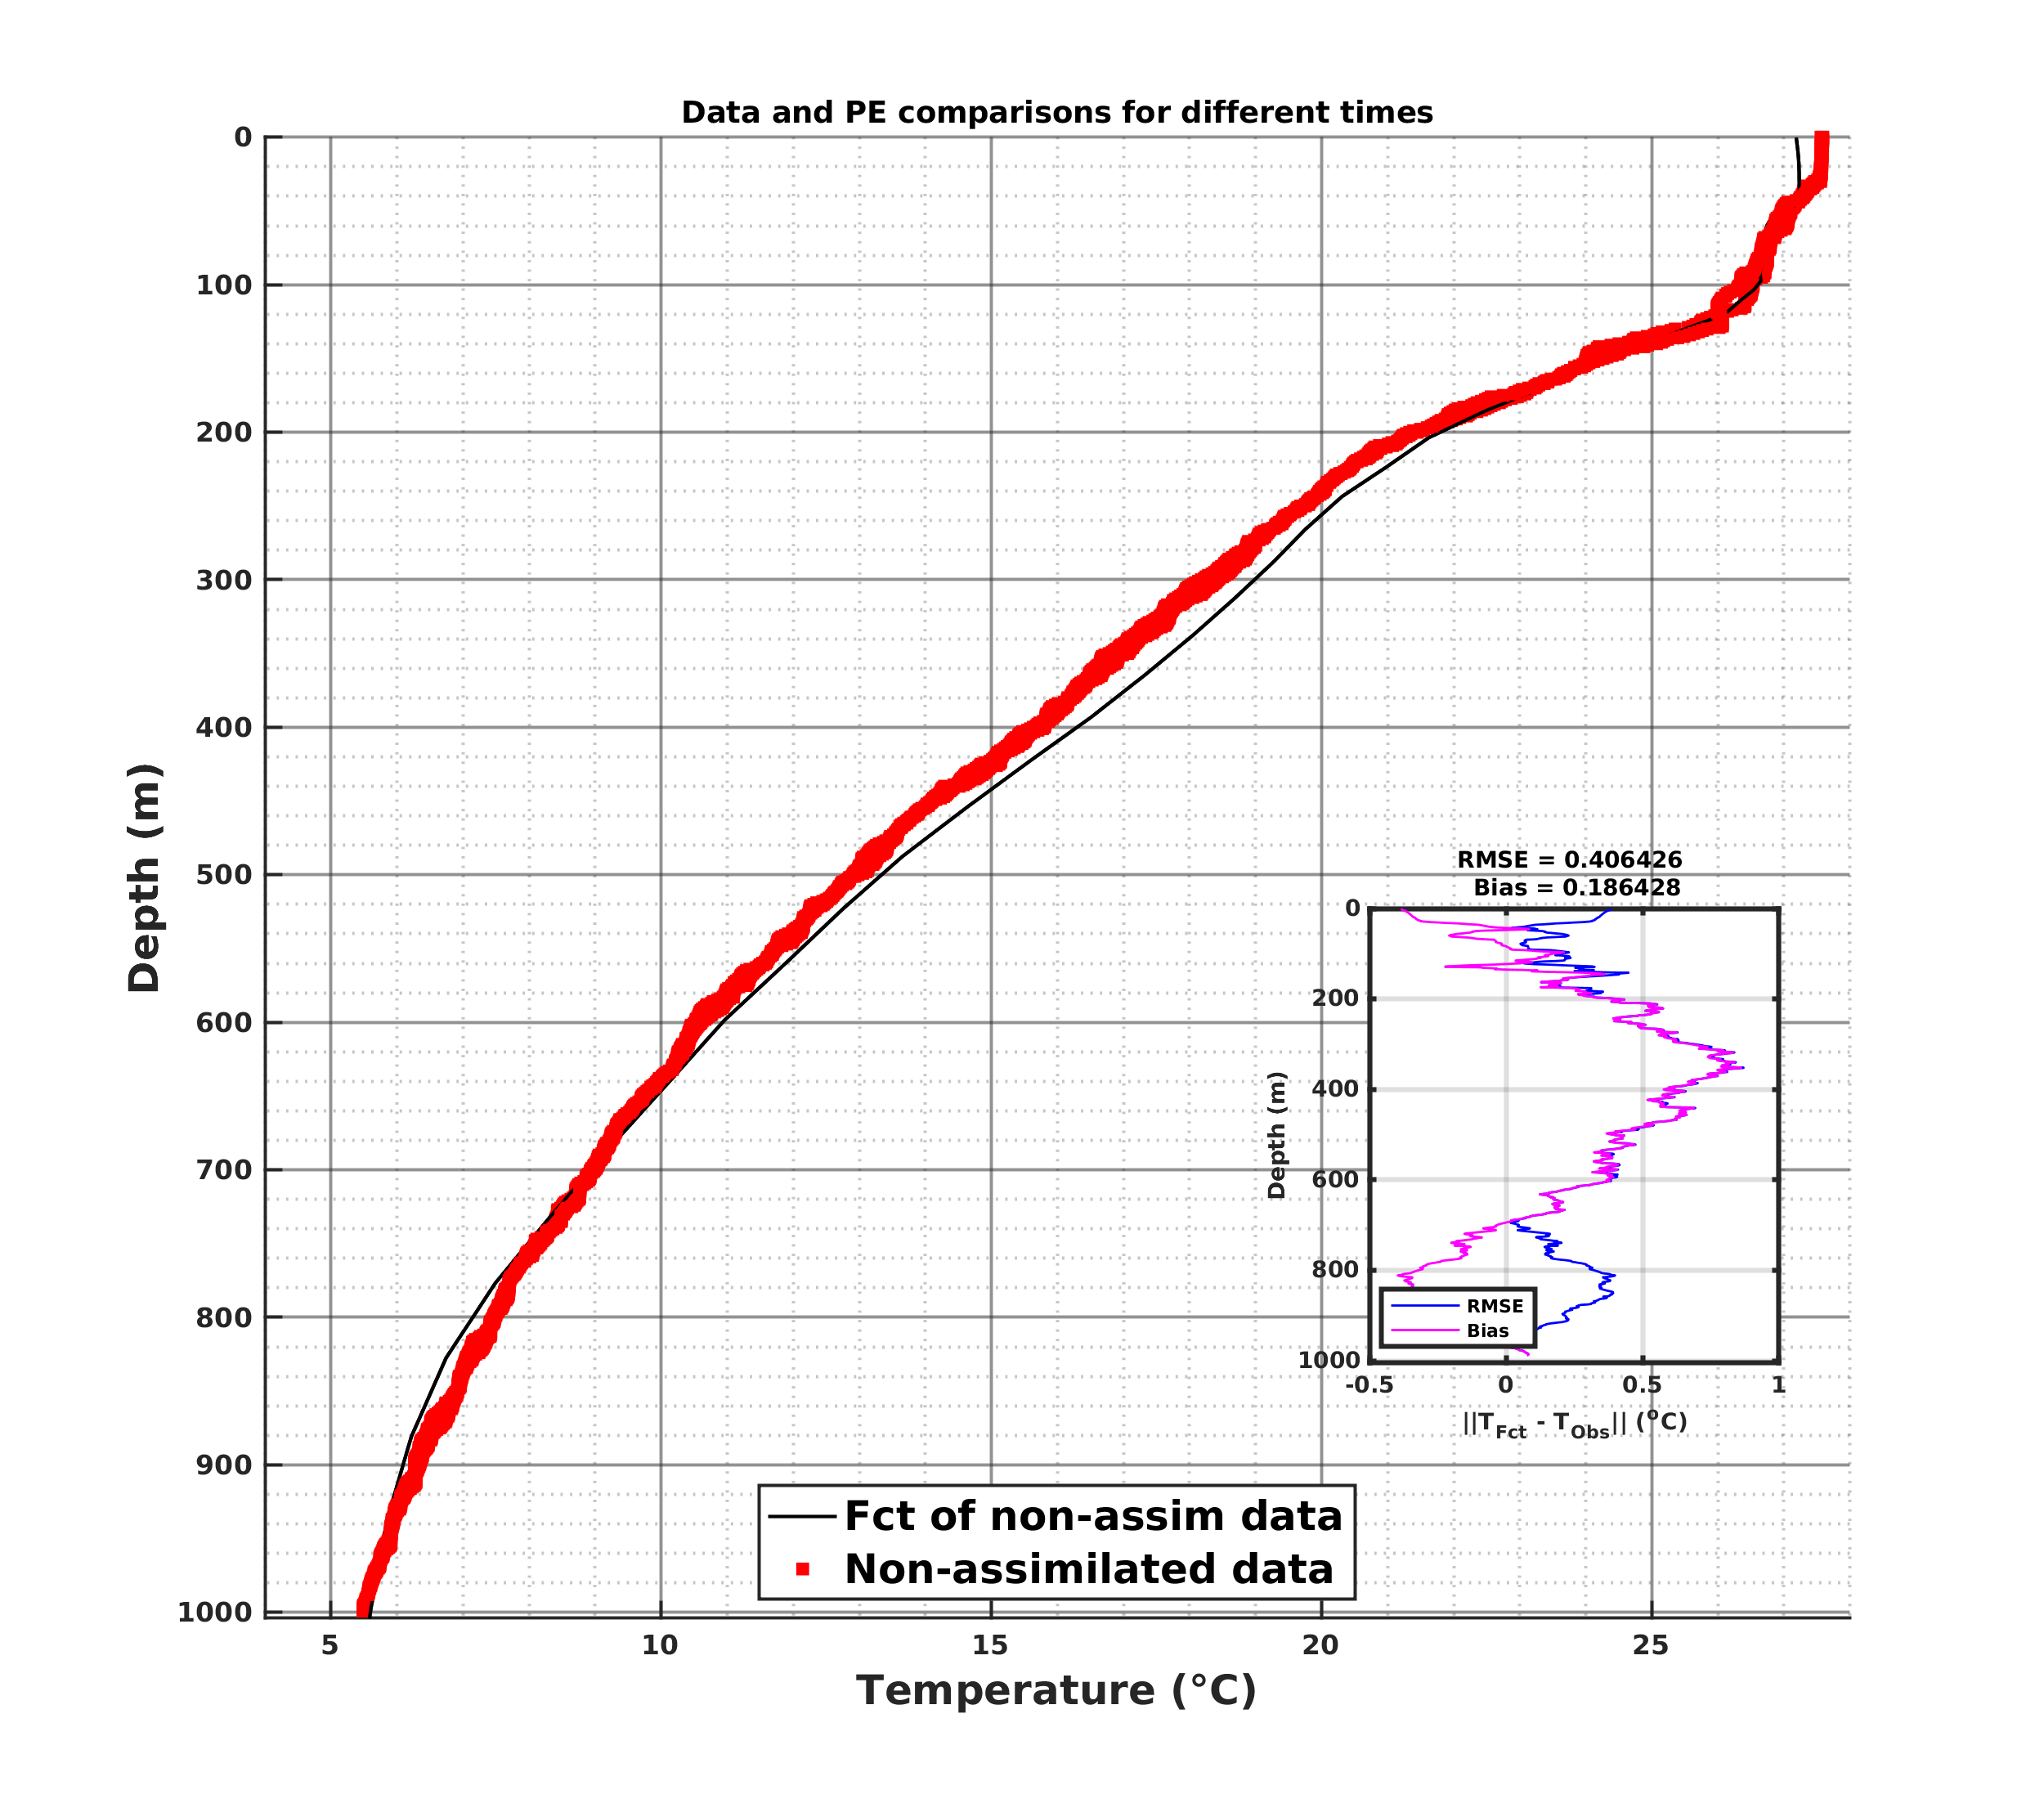
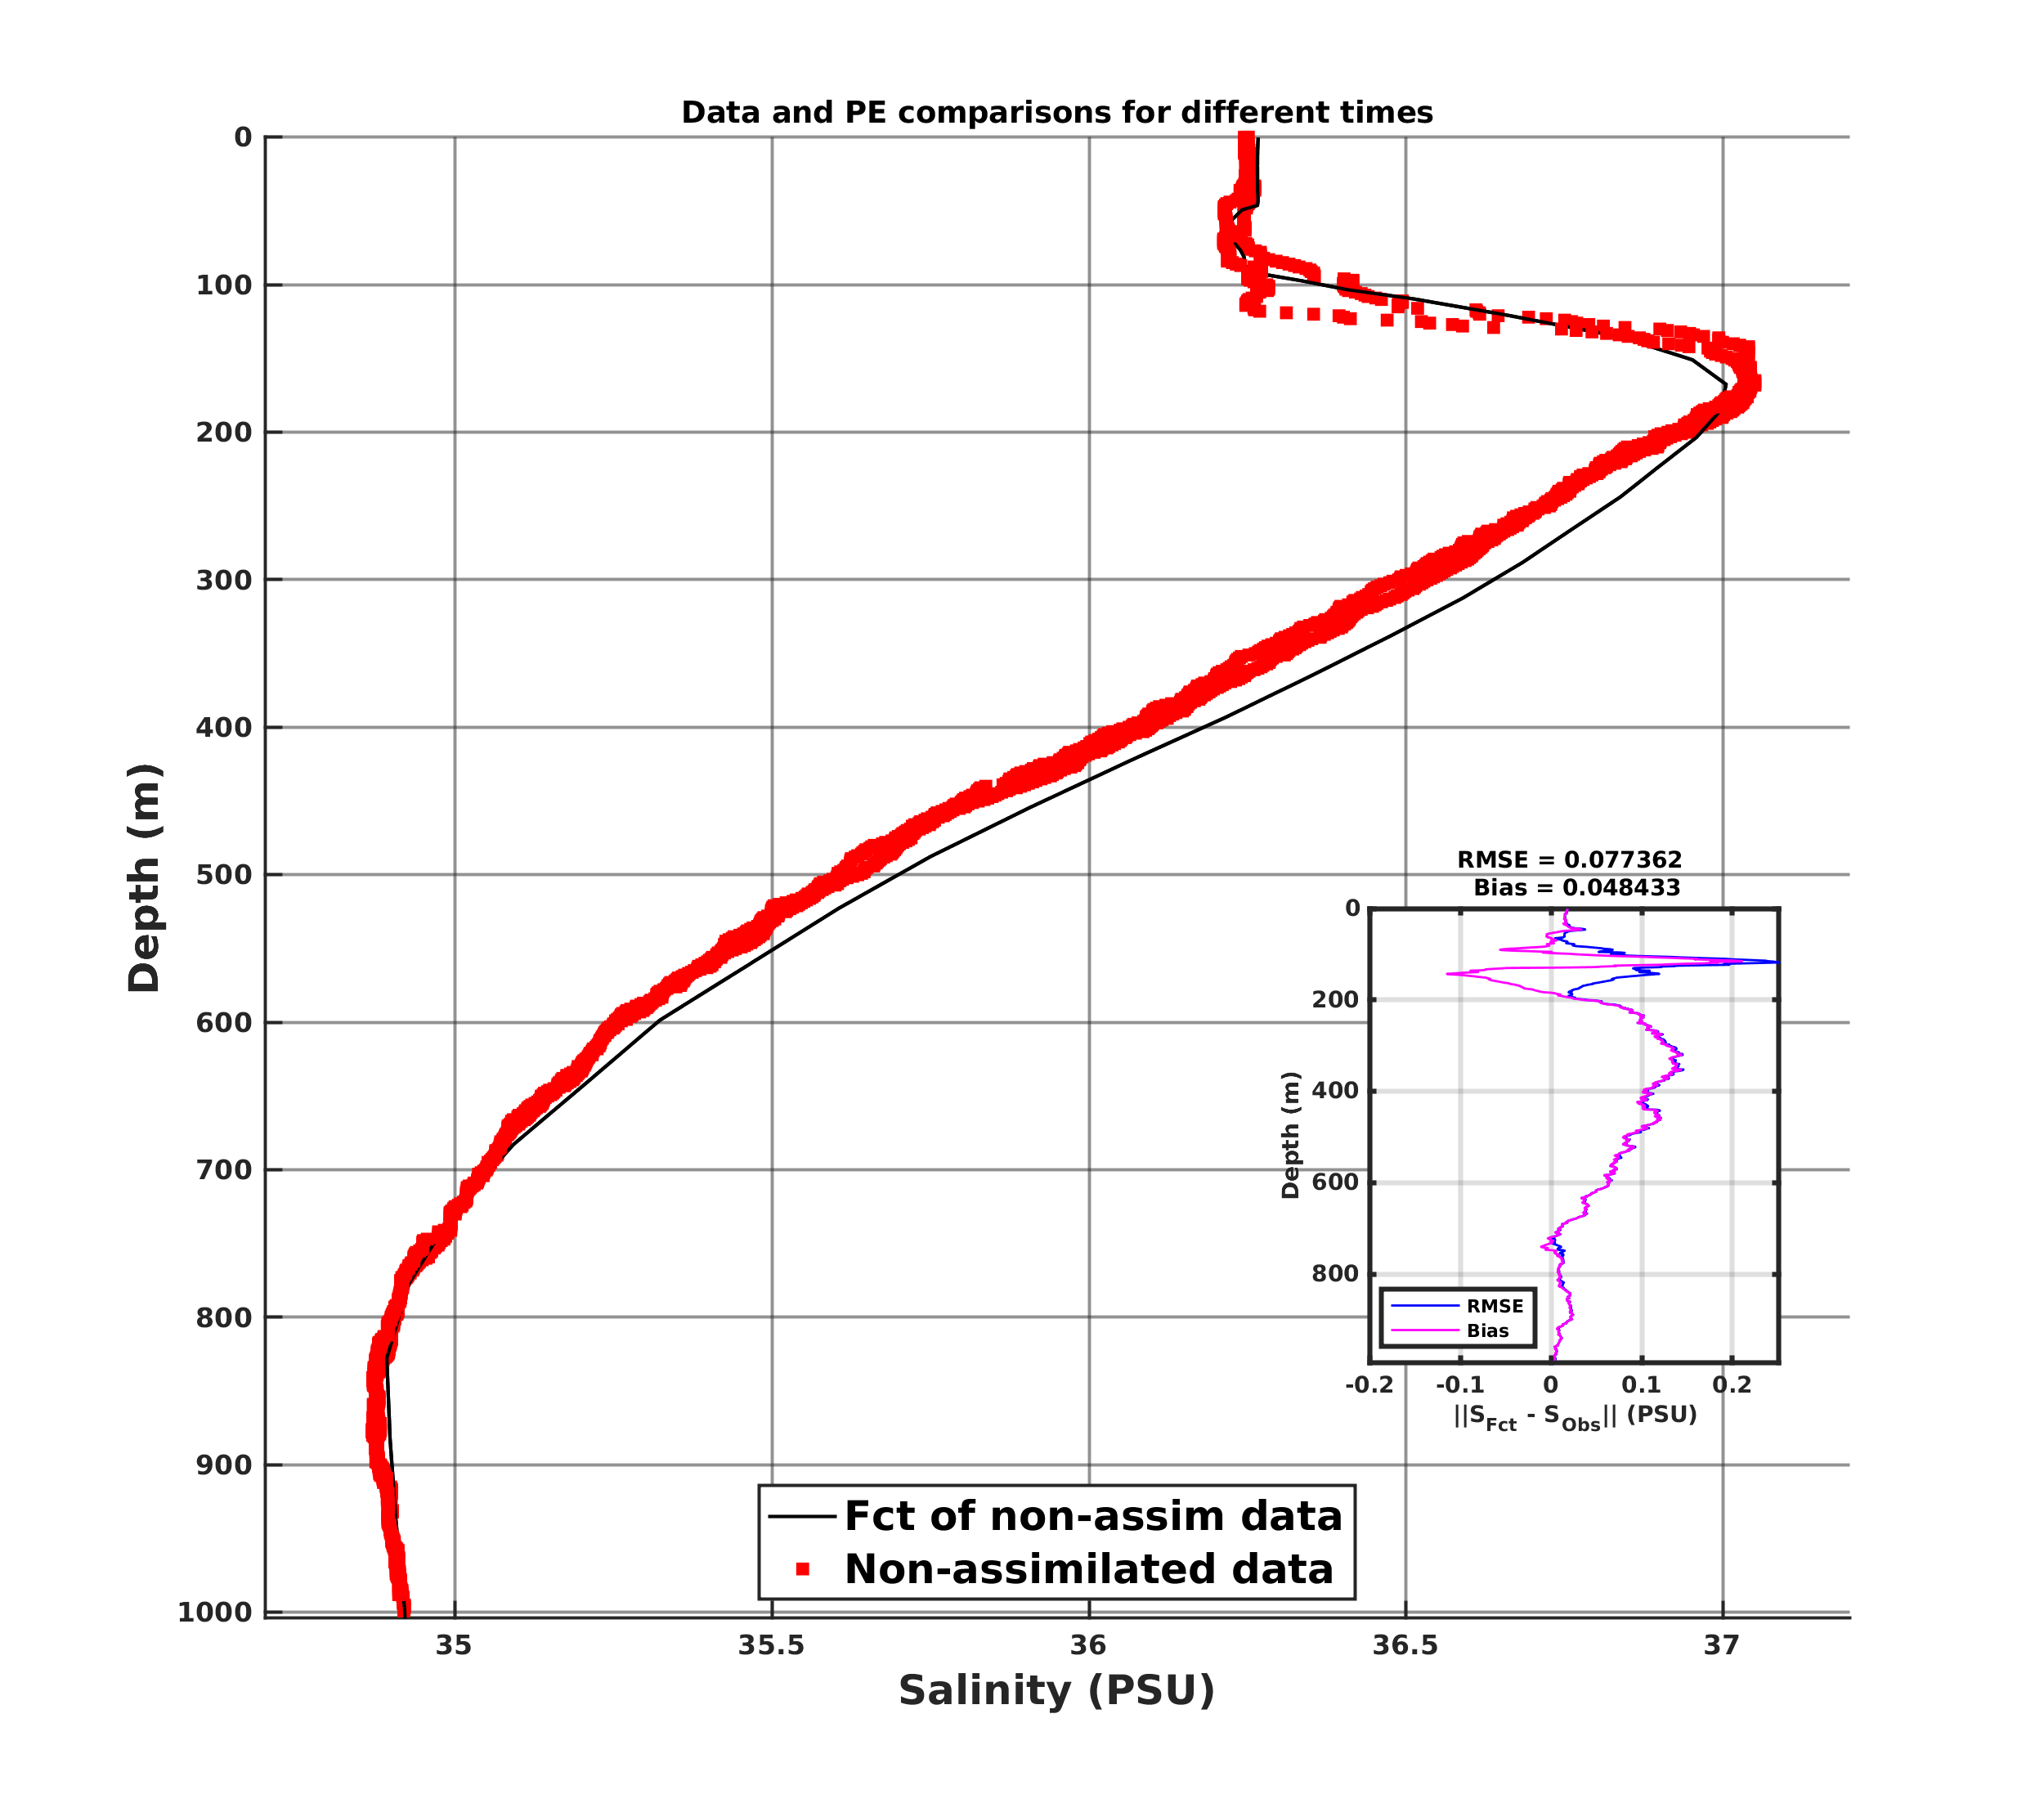
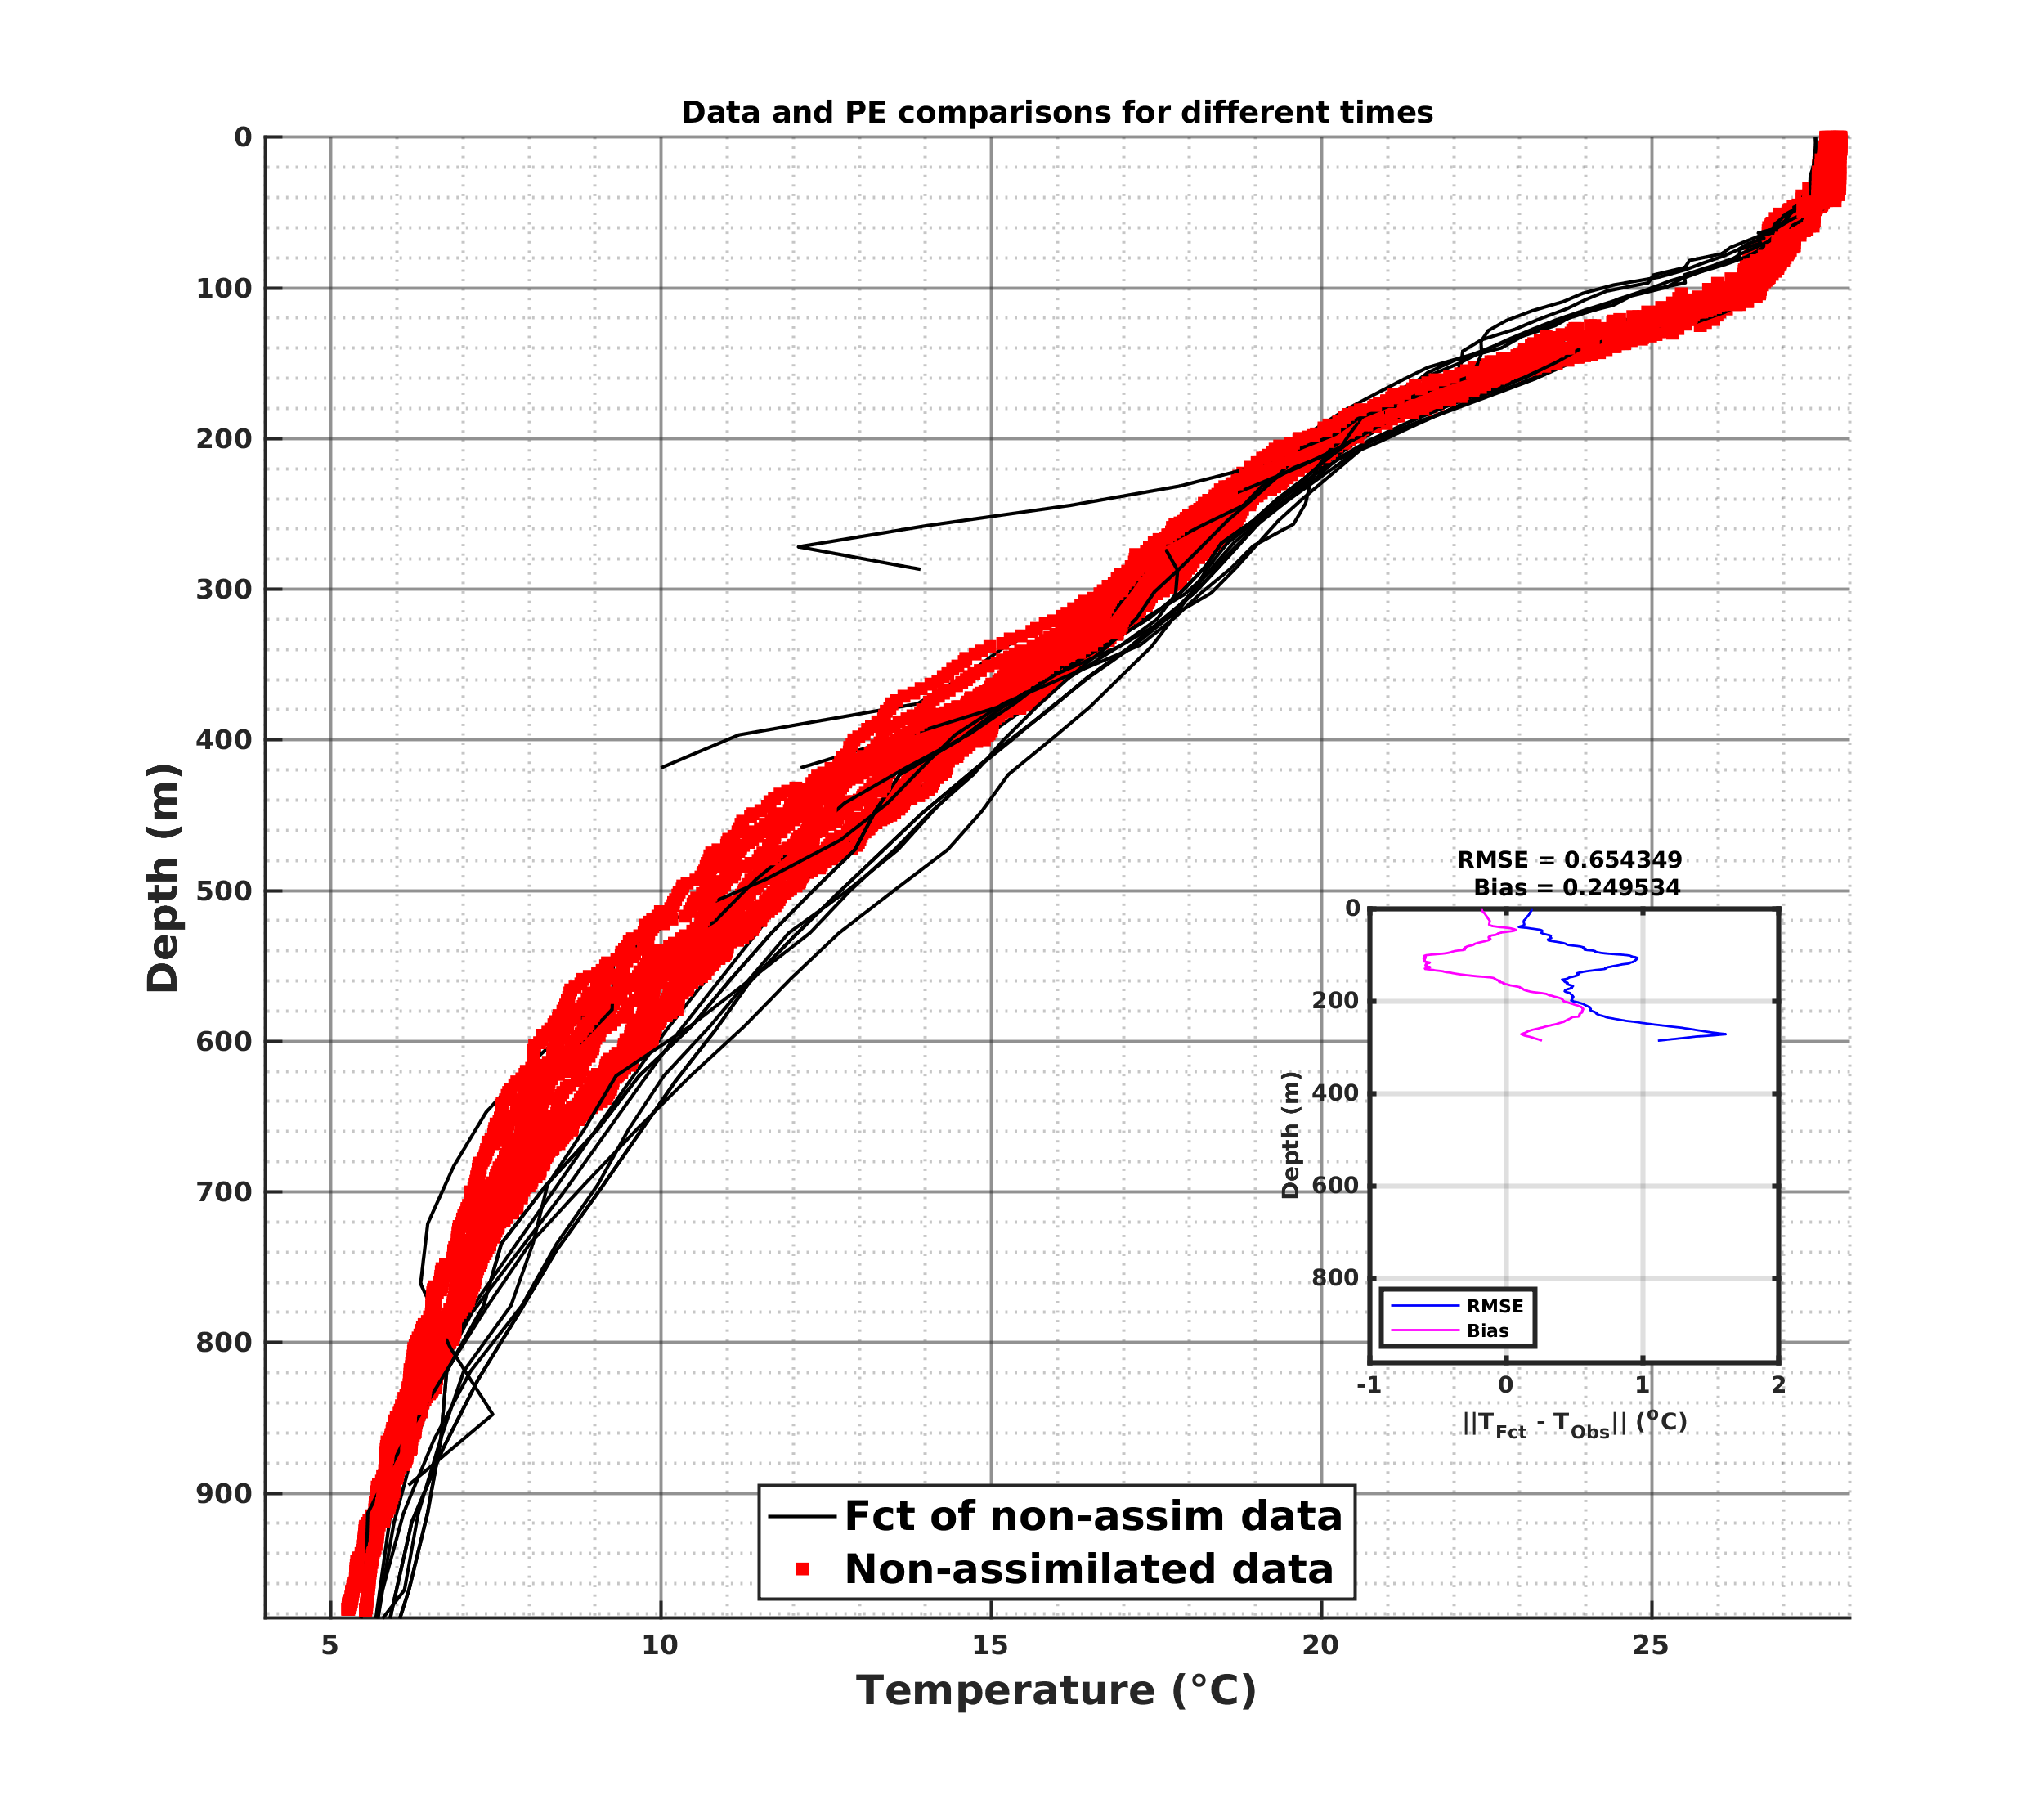
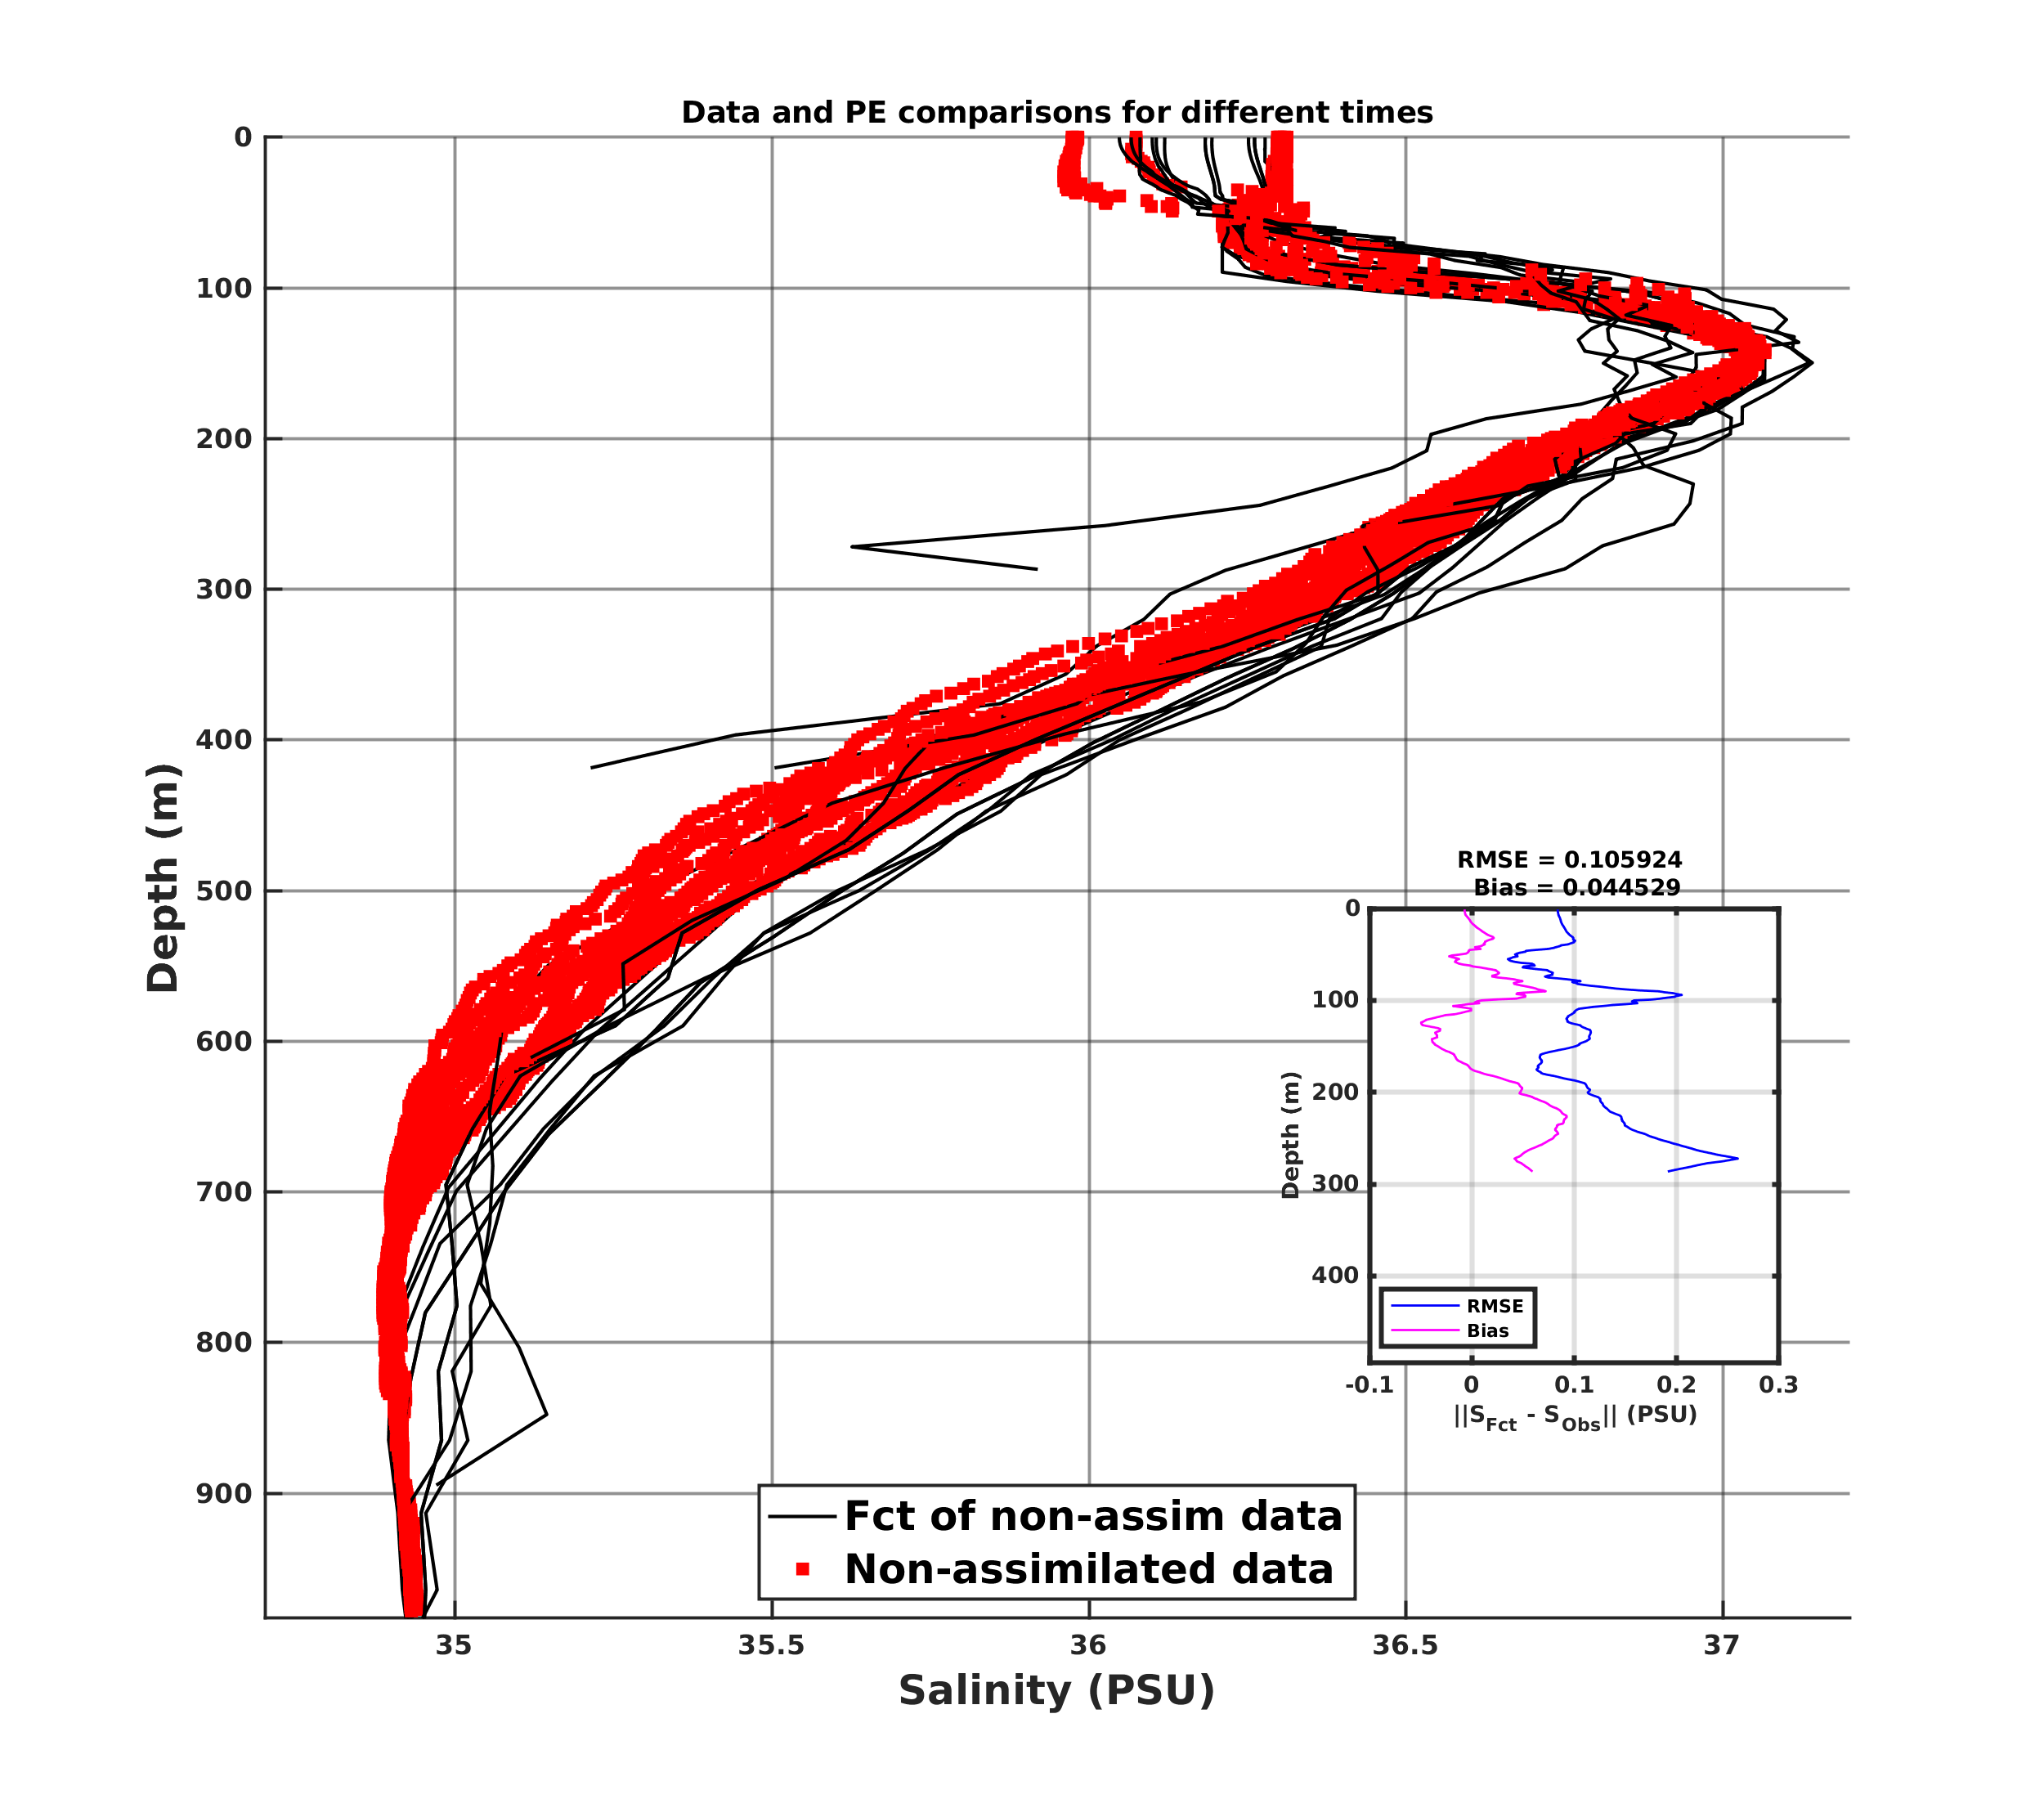
Black lines denote MSEAS-PE forecasts of the non-assimilated (i.e., independent) data; Gray lines denote MSEAS-PE forecasts of the assimilated data (if assimilation is enabled for the run); Red dots denote non-assimilated (i.e., independent) data; and Green dots denote assimilated data (if enabled in the MSEAS-PE run).

Data TypeLocationTemperatureSalinity
ARGO GomR25deg004/ARGO-20240321T145423_prof_all008_PEid-Mar21_PEtime_20240321_1454Z_Cen_1L_dd.png
GomR25deg004/ARGO-20240321T145423_prof_all008_PEid-Mar21_PEtime_20240321_1454Z_Cen_2T_dd.png
GomR25deg004/ARGO-20240321T145423_prof_all008_PEid-Mar21_PEtime_20240321_1454Z_Cen_3S_dd.png
RU38 GomR25deg004/RU38-20240321T221309_prof_all018_PEid-Mar21_PEtime_20240321_2213Z_Cen_1L_dd.png
GomR25deg004/RU38-20240321T221309_prof_all018_PEid-Mar21_PEtime_20240321_2213Z_Cen_2T_dd.png
GomR25deg004/RU38-20240321T221309_prof_all018_PEid-Mar21_PEtime_20240321_2213Z_Cen_3S_dd.png
SG652 GomR25deg004/SG652-20240321T130439_prof_all002_PEid-Mar21_PEtime_20240321_1304Z_Cen_1L_dd.png
GomR25deg004/SG652-20240321T130439_prof_all002_PEid-Mar21_PEtime_20240321_1304Z_Cen_2T_dd.png
GomR25deg004/SG652-20240321T130439_prof_all002_PEid-Mar21_PEtime_20240321_1304Z_Cen_3S_dd.png
Stommel GomR25deg004/Stommel-20240321T233732_prof_all014_PEid-Mar21_PEtime_20240321_2337Z_Cen_1L_dd.png
GomR25deg004/Stommel-20240321T233732_prof_all014_PEid-Mar21_PEtime_20240321_2337Z_Cen_2T_dd.png
GomR25deg004/Stommel-20240321T233732_prof_all014_PEid-Mar21_PEtime_20240321_2337Z_Cen_3S_dd.png