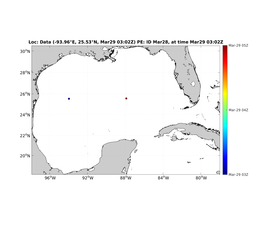
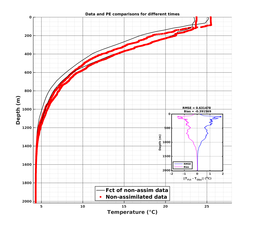


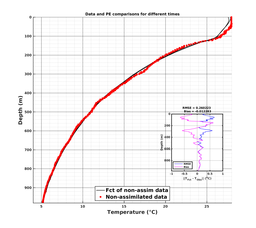
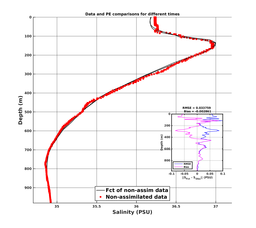

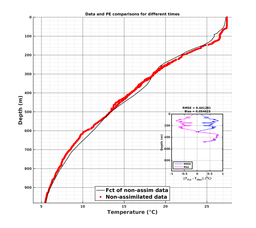

Black lines denote MSEAS-PE forecasts of the non-assimilated (i.e., independent) data; Gray lines denote MSEAS-PE forecasts of the assimilated data (if assimilation is enabled for the run); Red dots denote non-assimilated (i.e., independent) data; and Green dots denote assimilated data (if enabled in the MSEAS-PE run).
| Data Type | Location | Temperature | Salinity |
|---|---|---|---|
| ARGO |
 |
 |
 |
| RU38 |
 |
 |
 |
| Stommel |
 |
 |
 |