
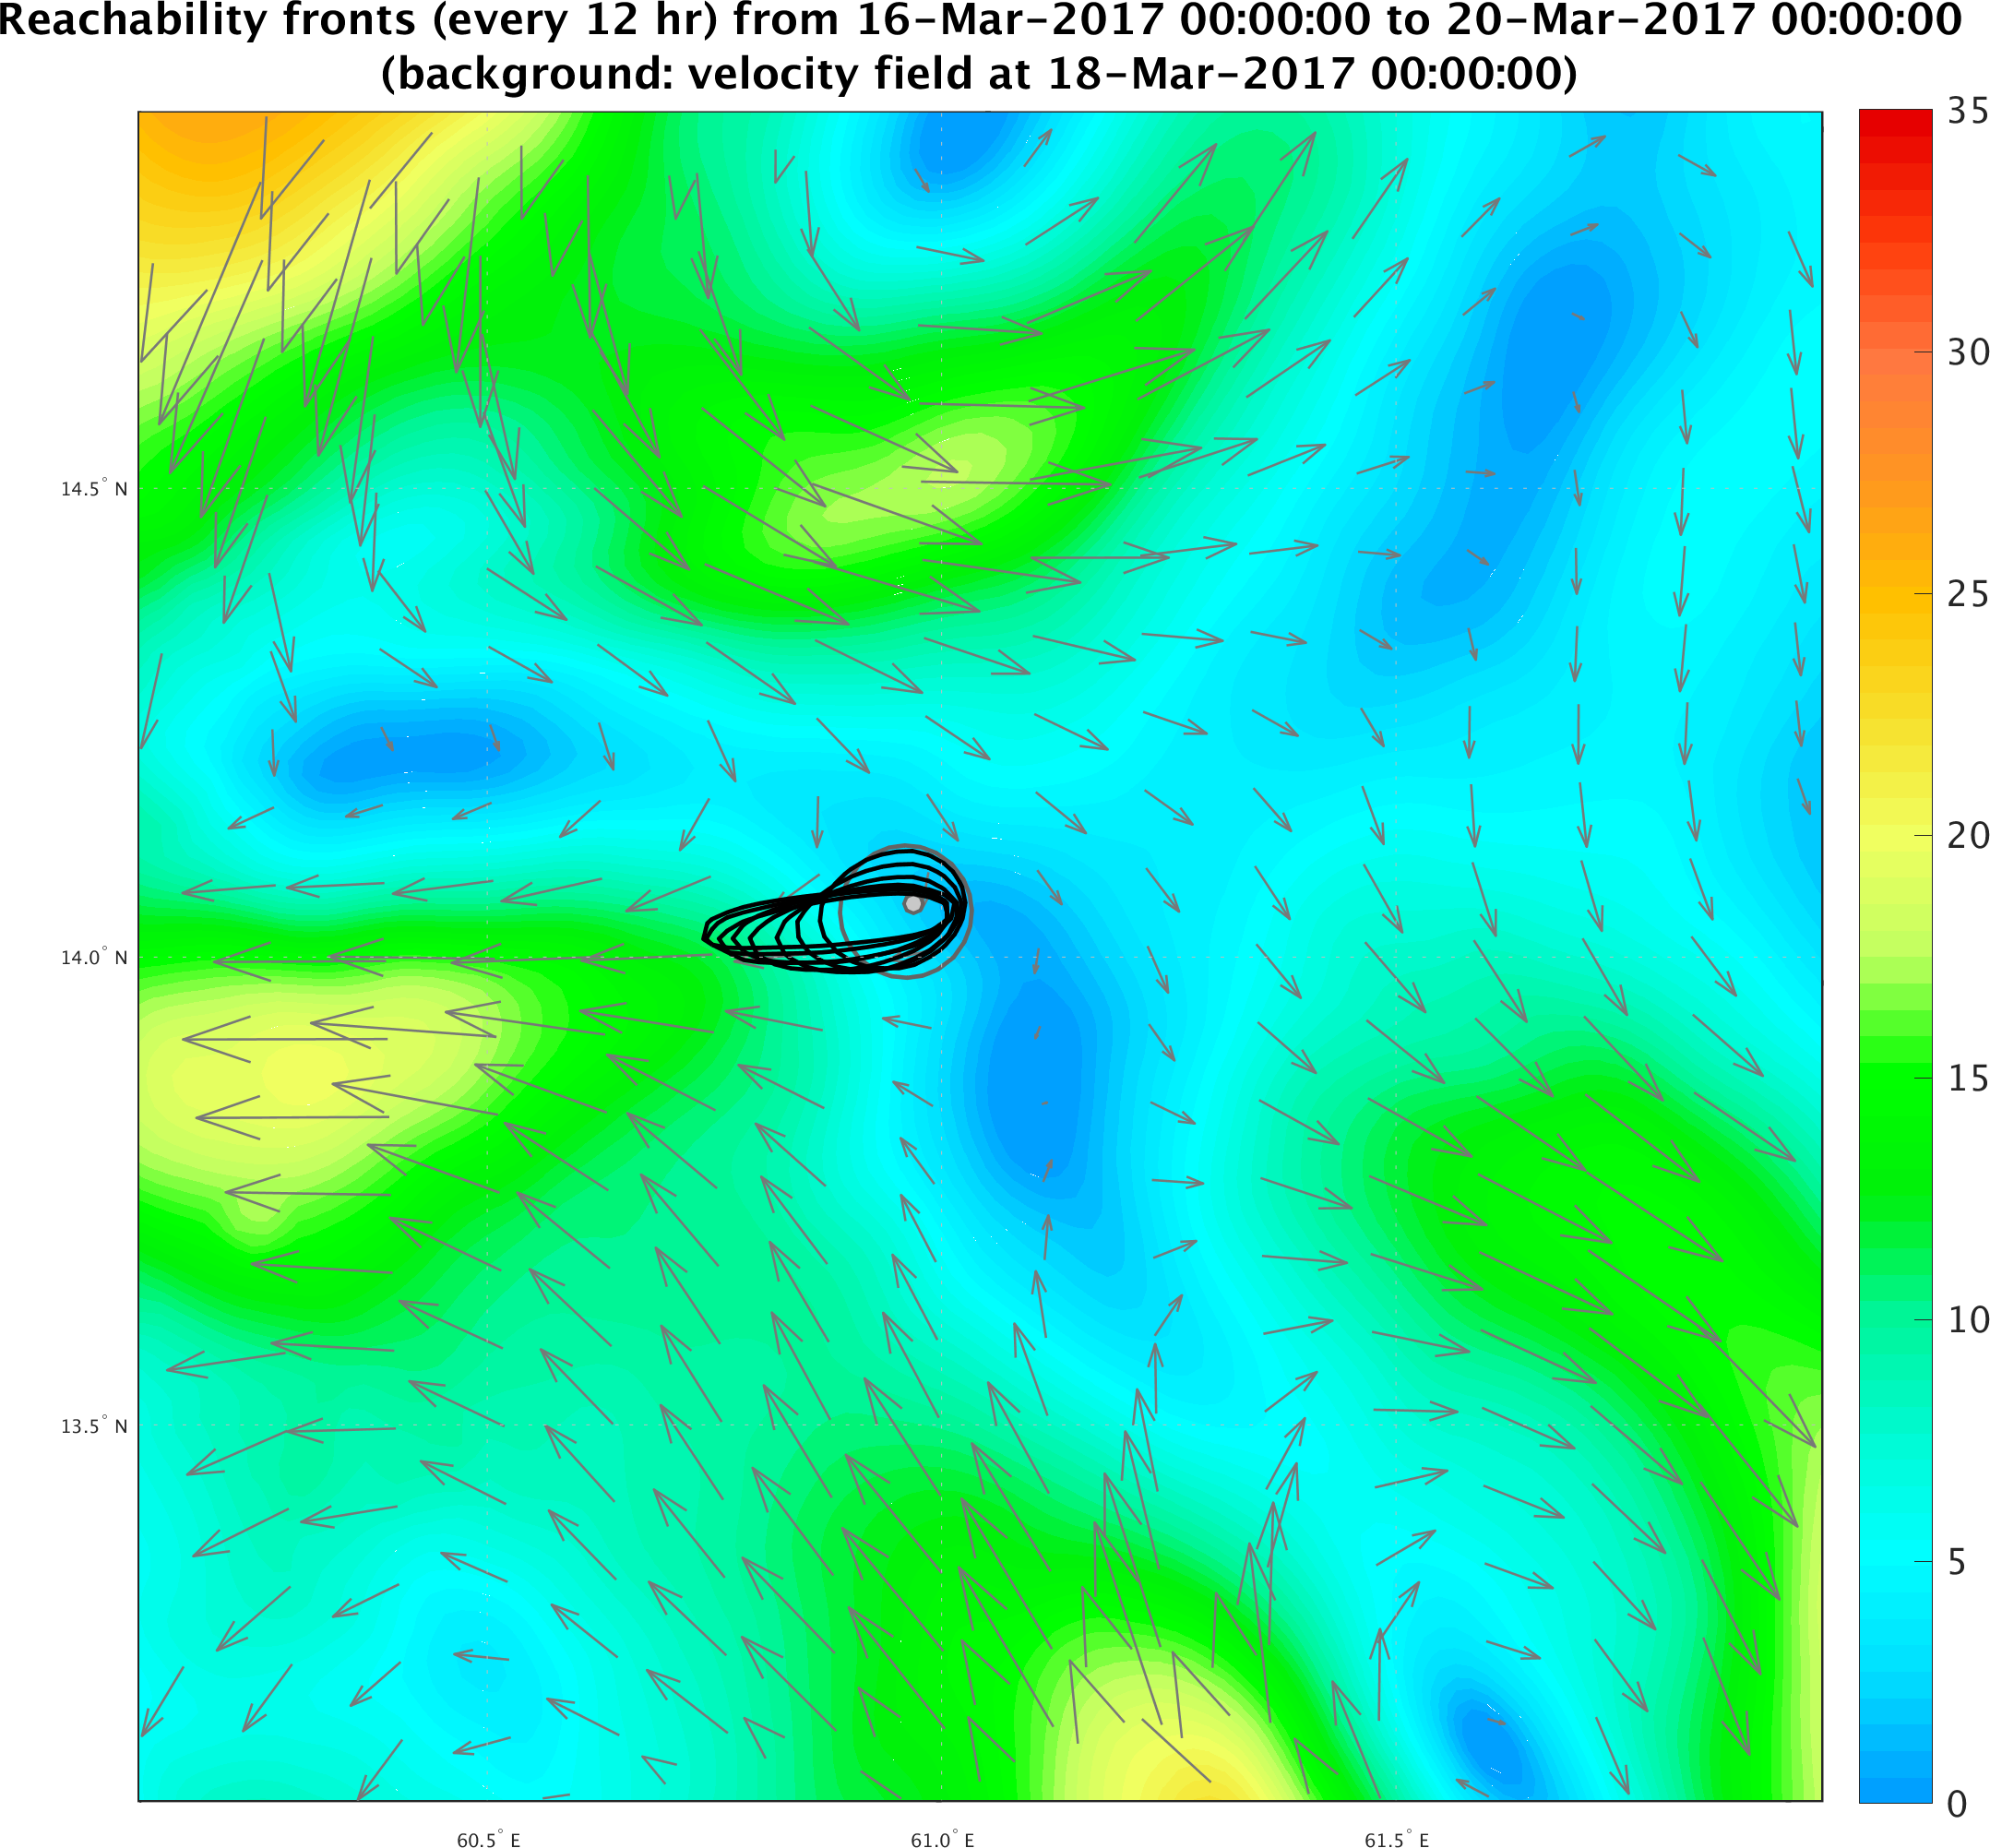
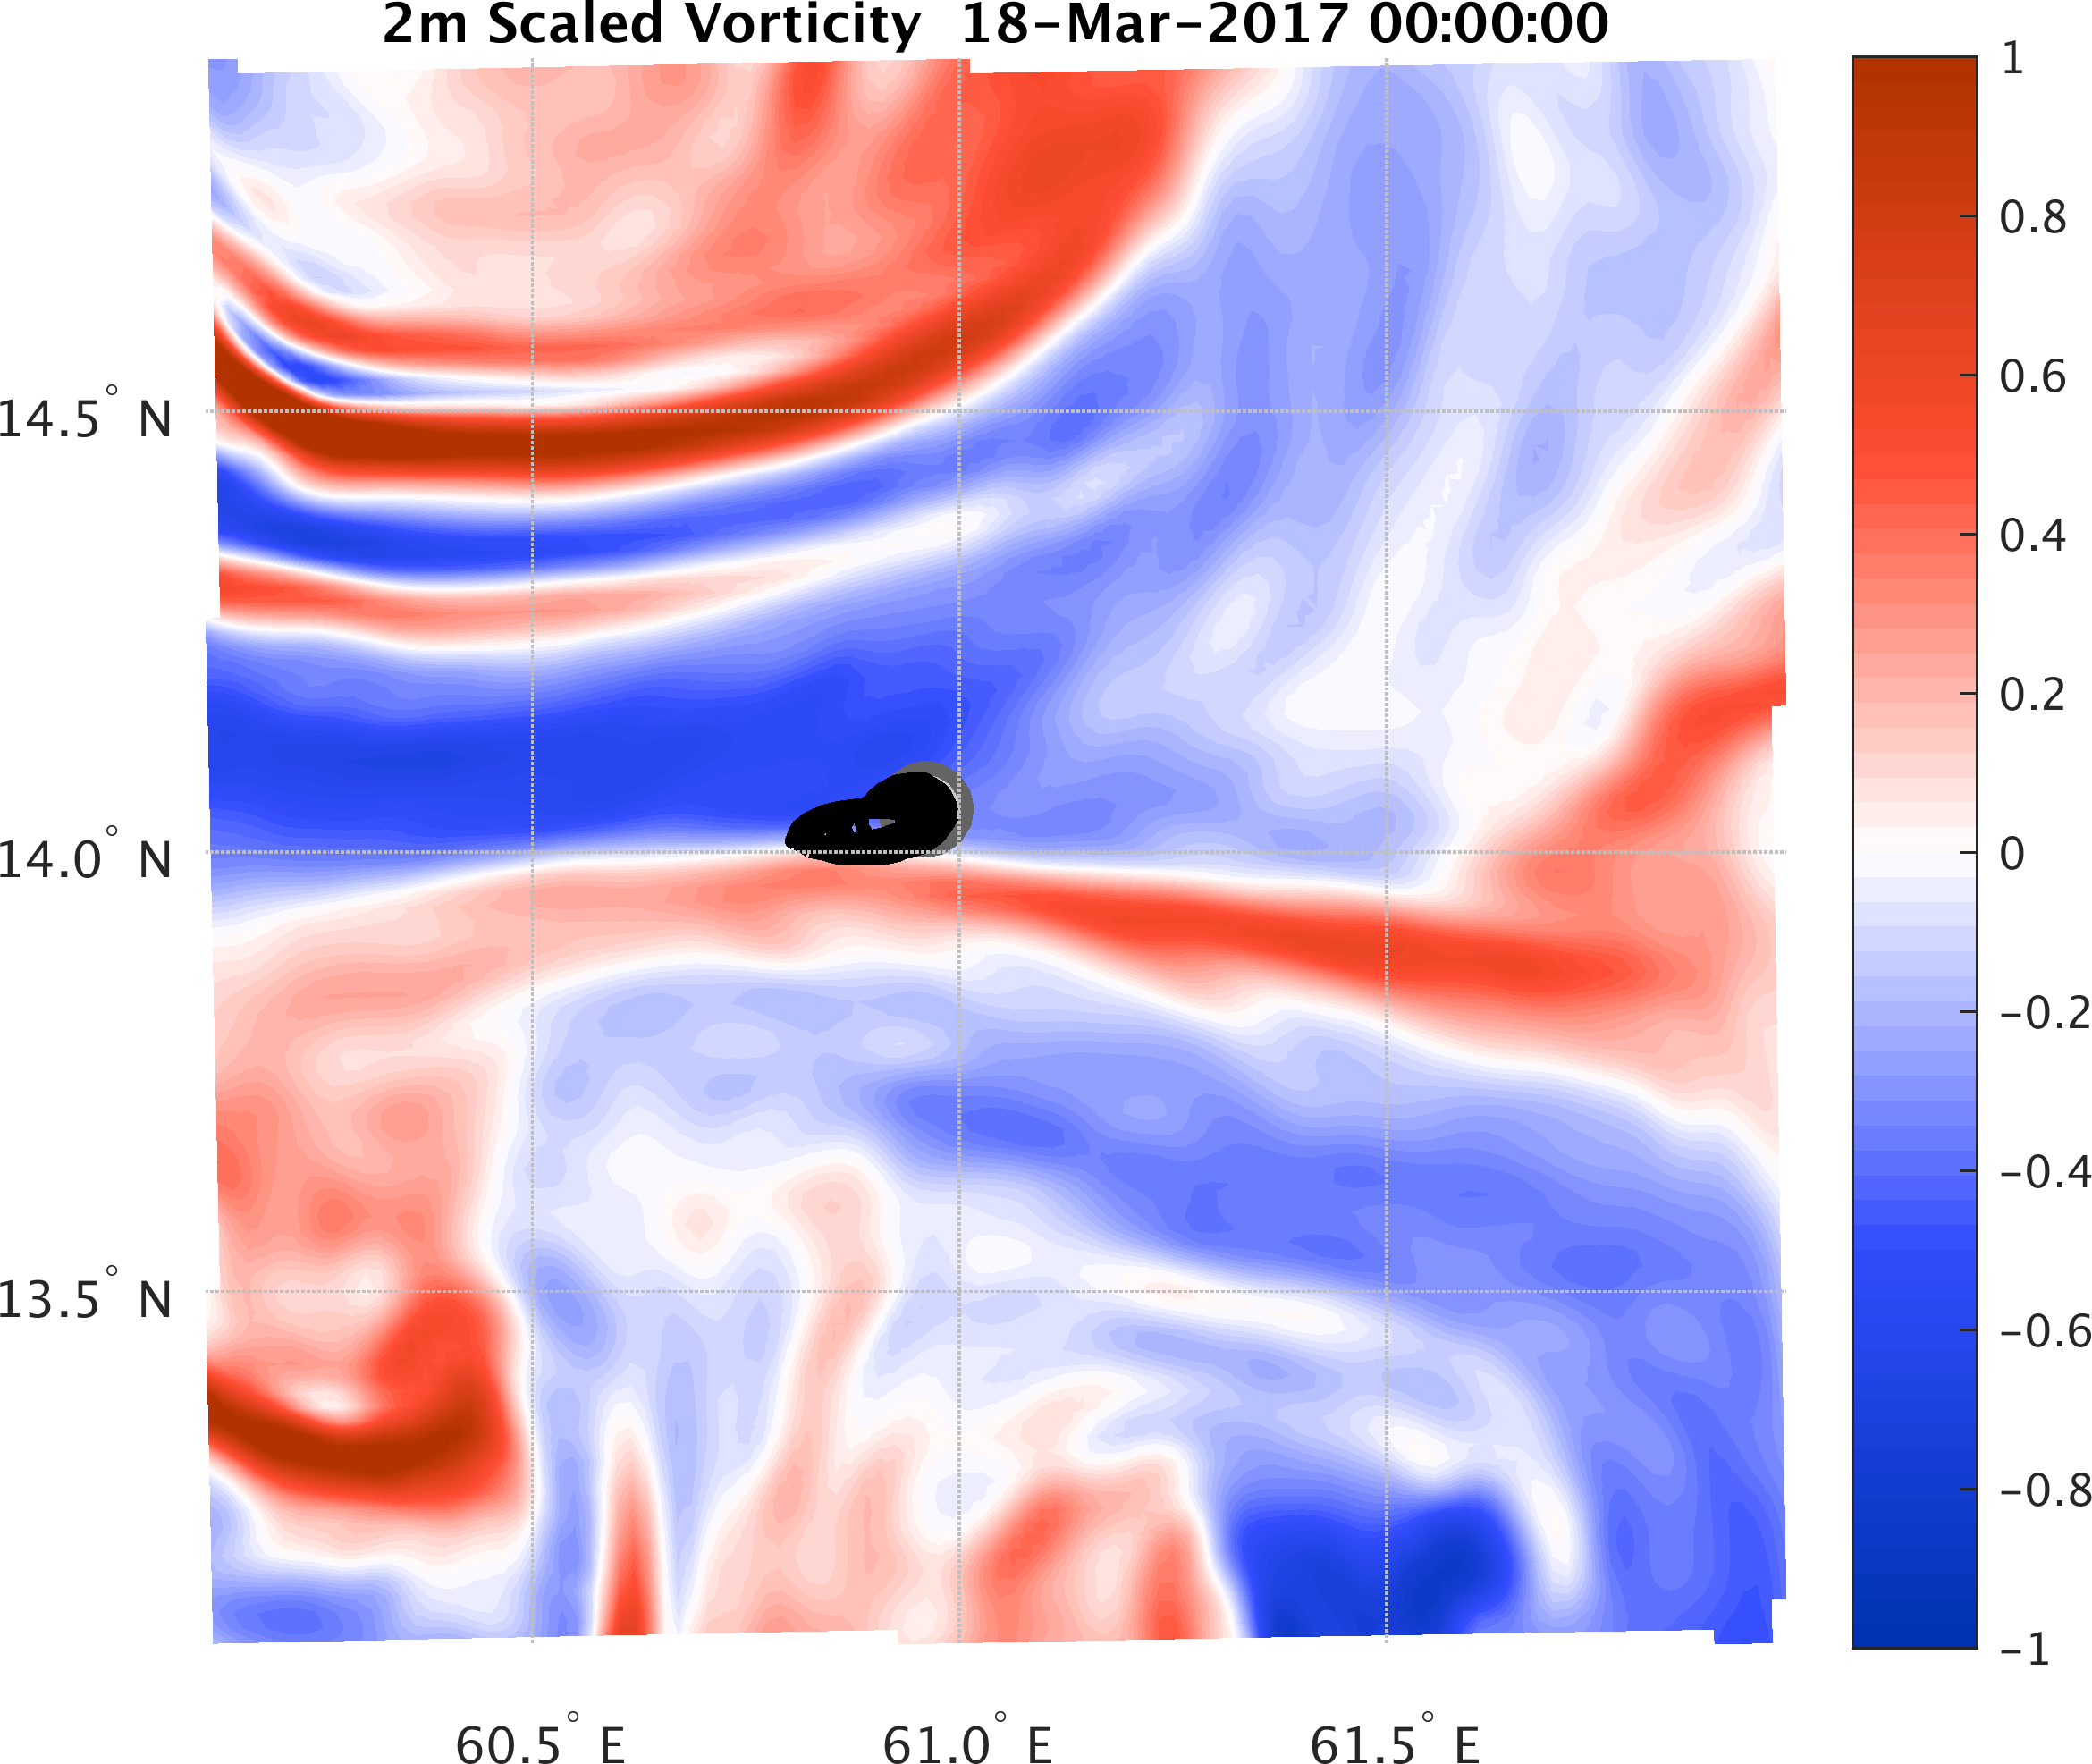
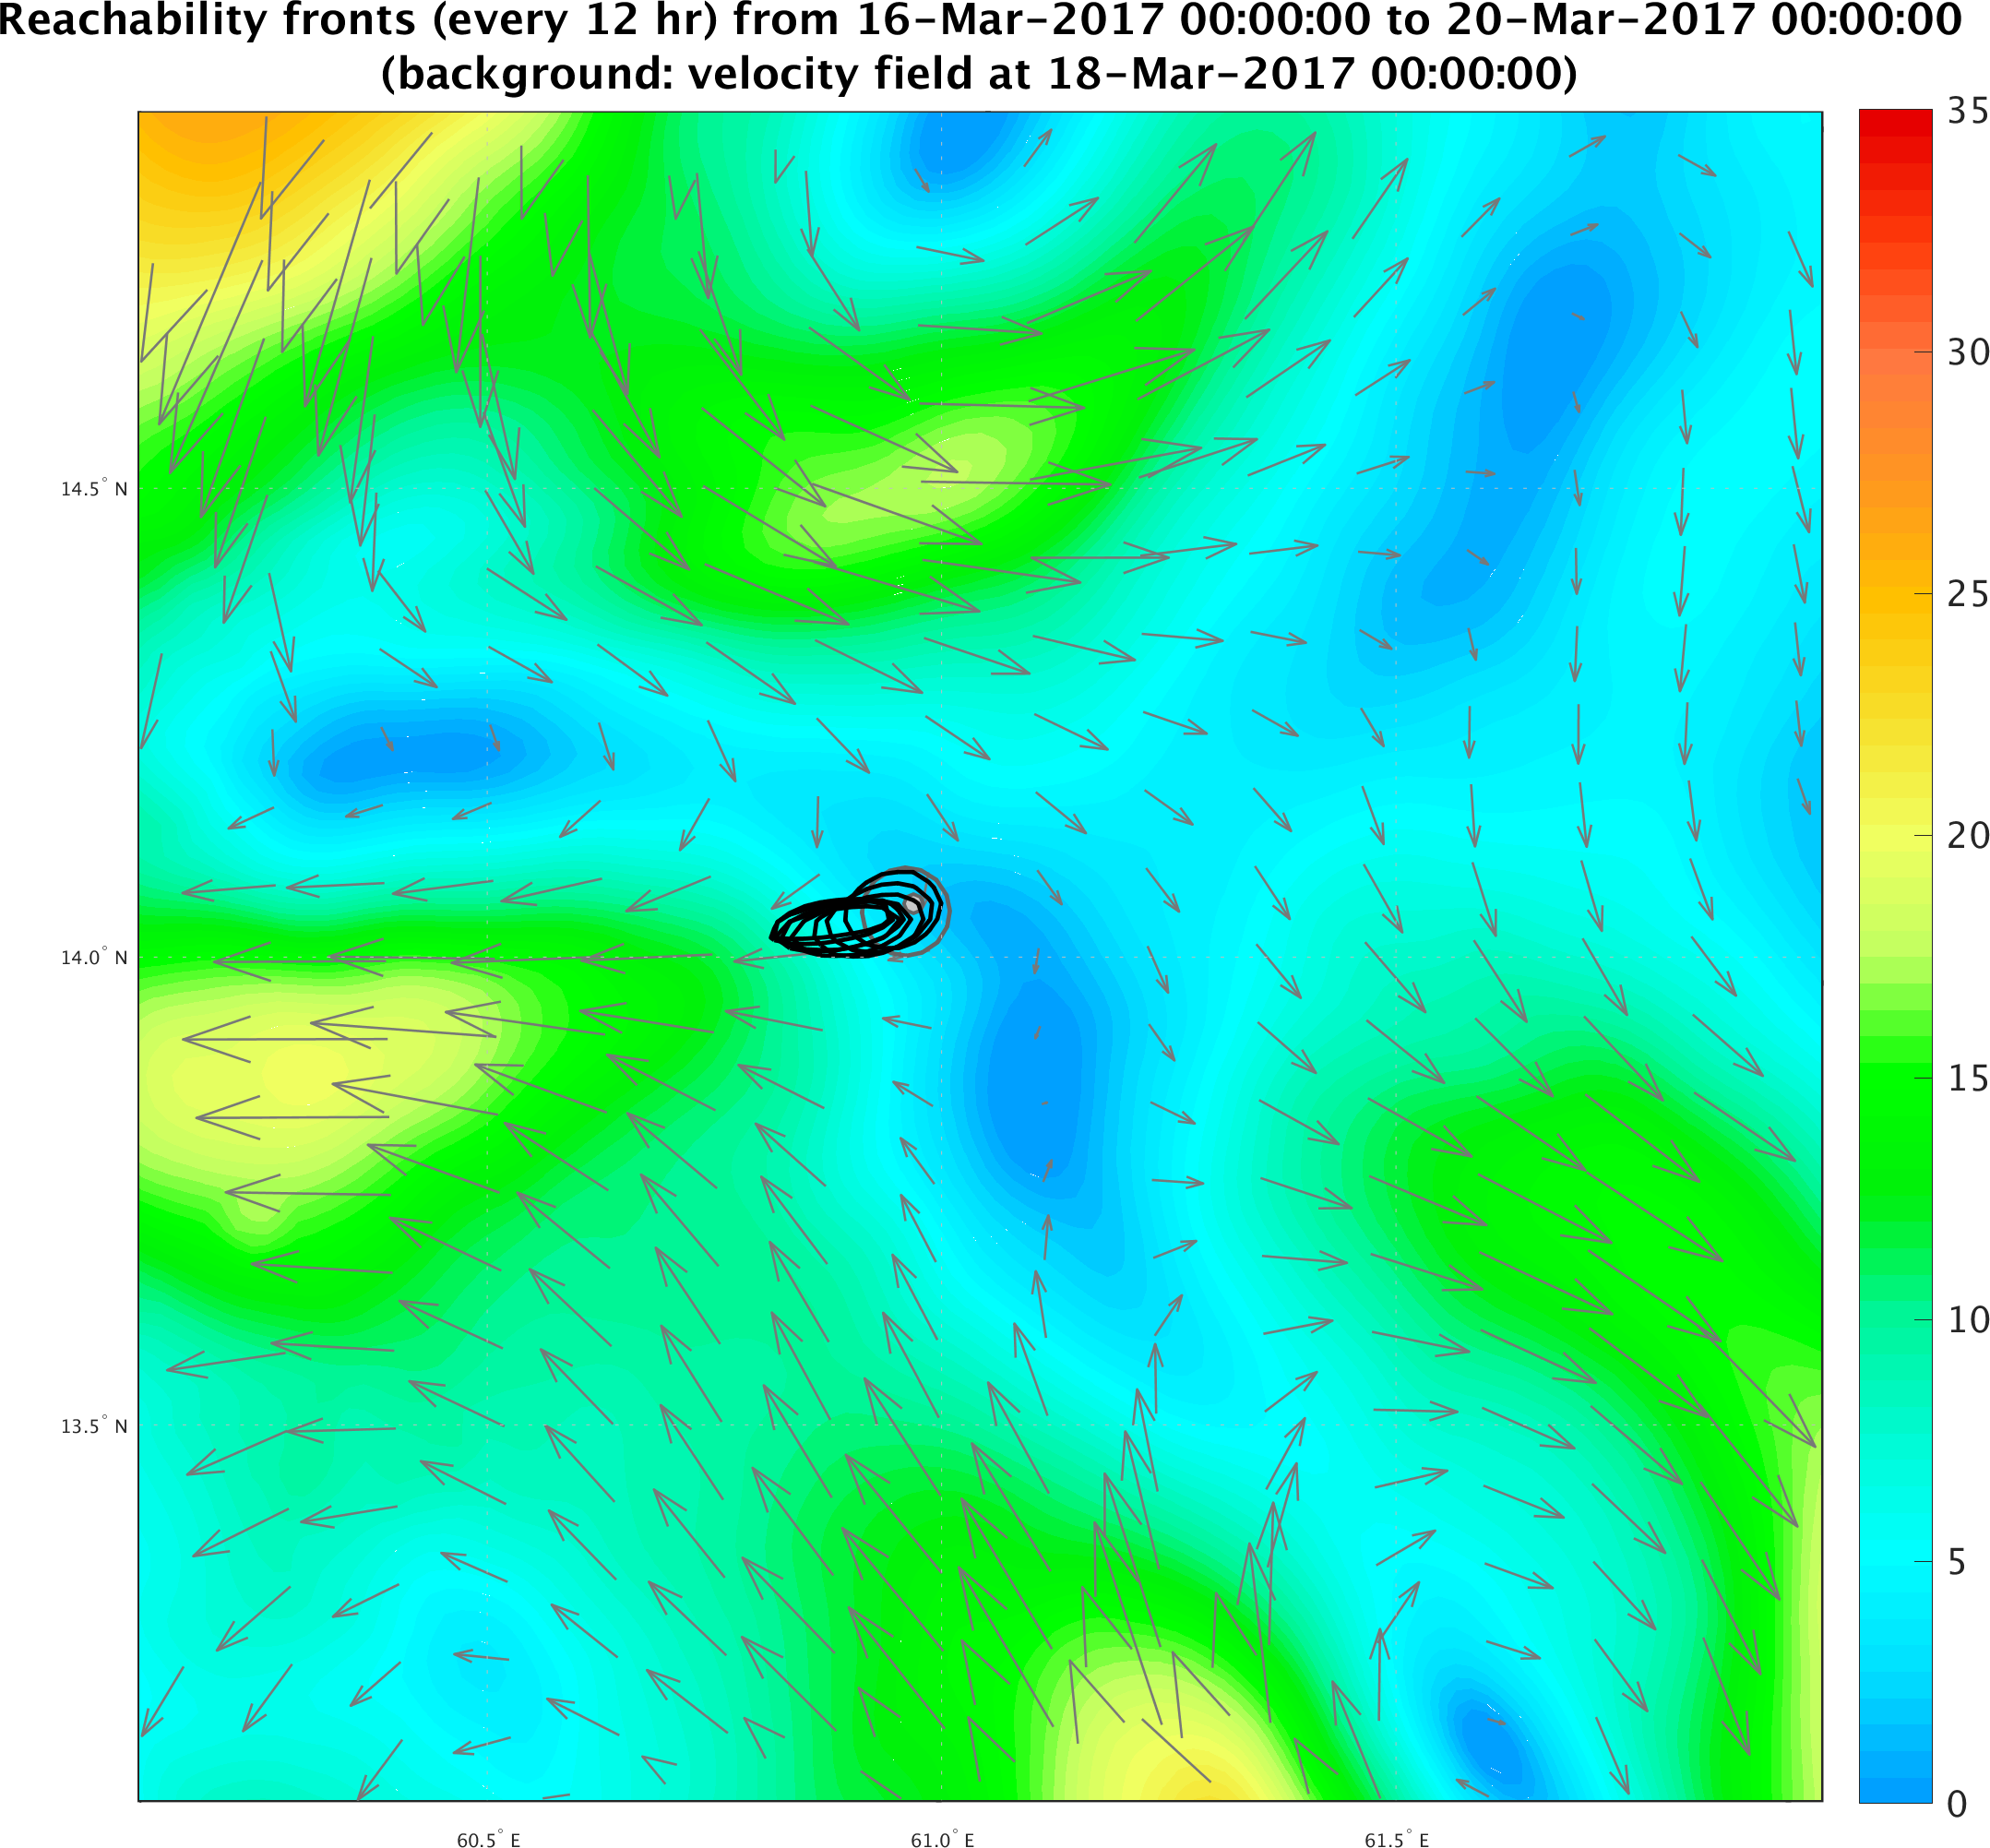
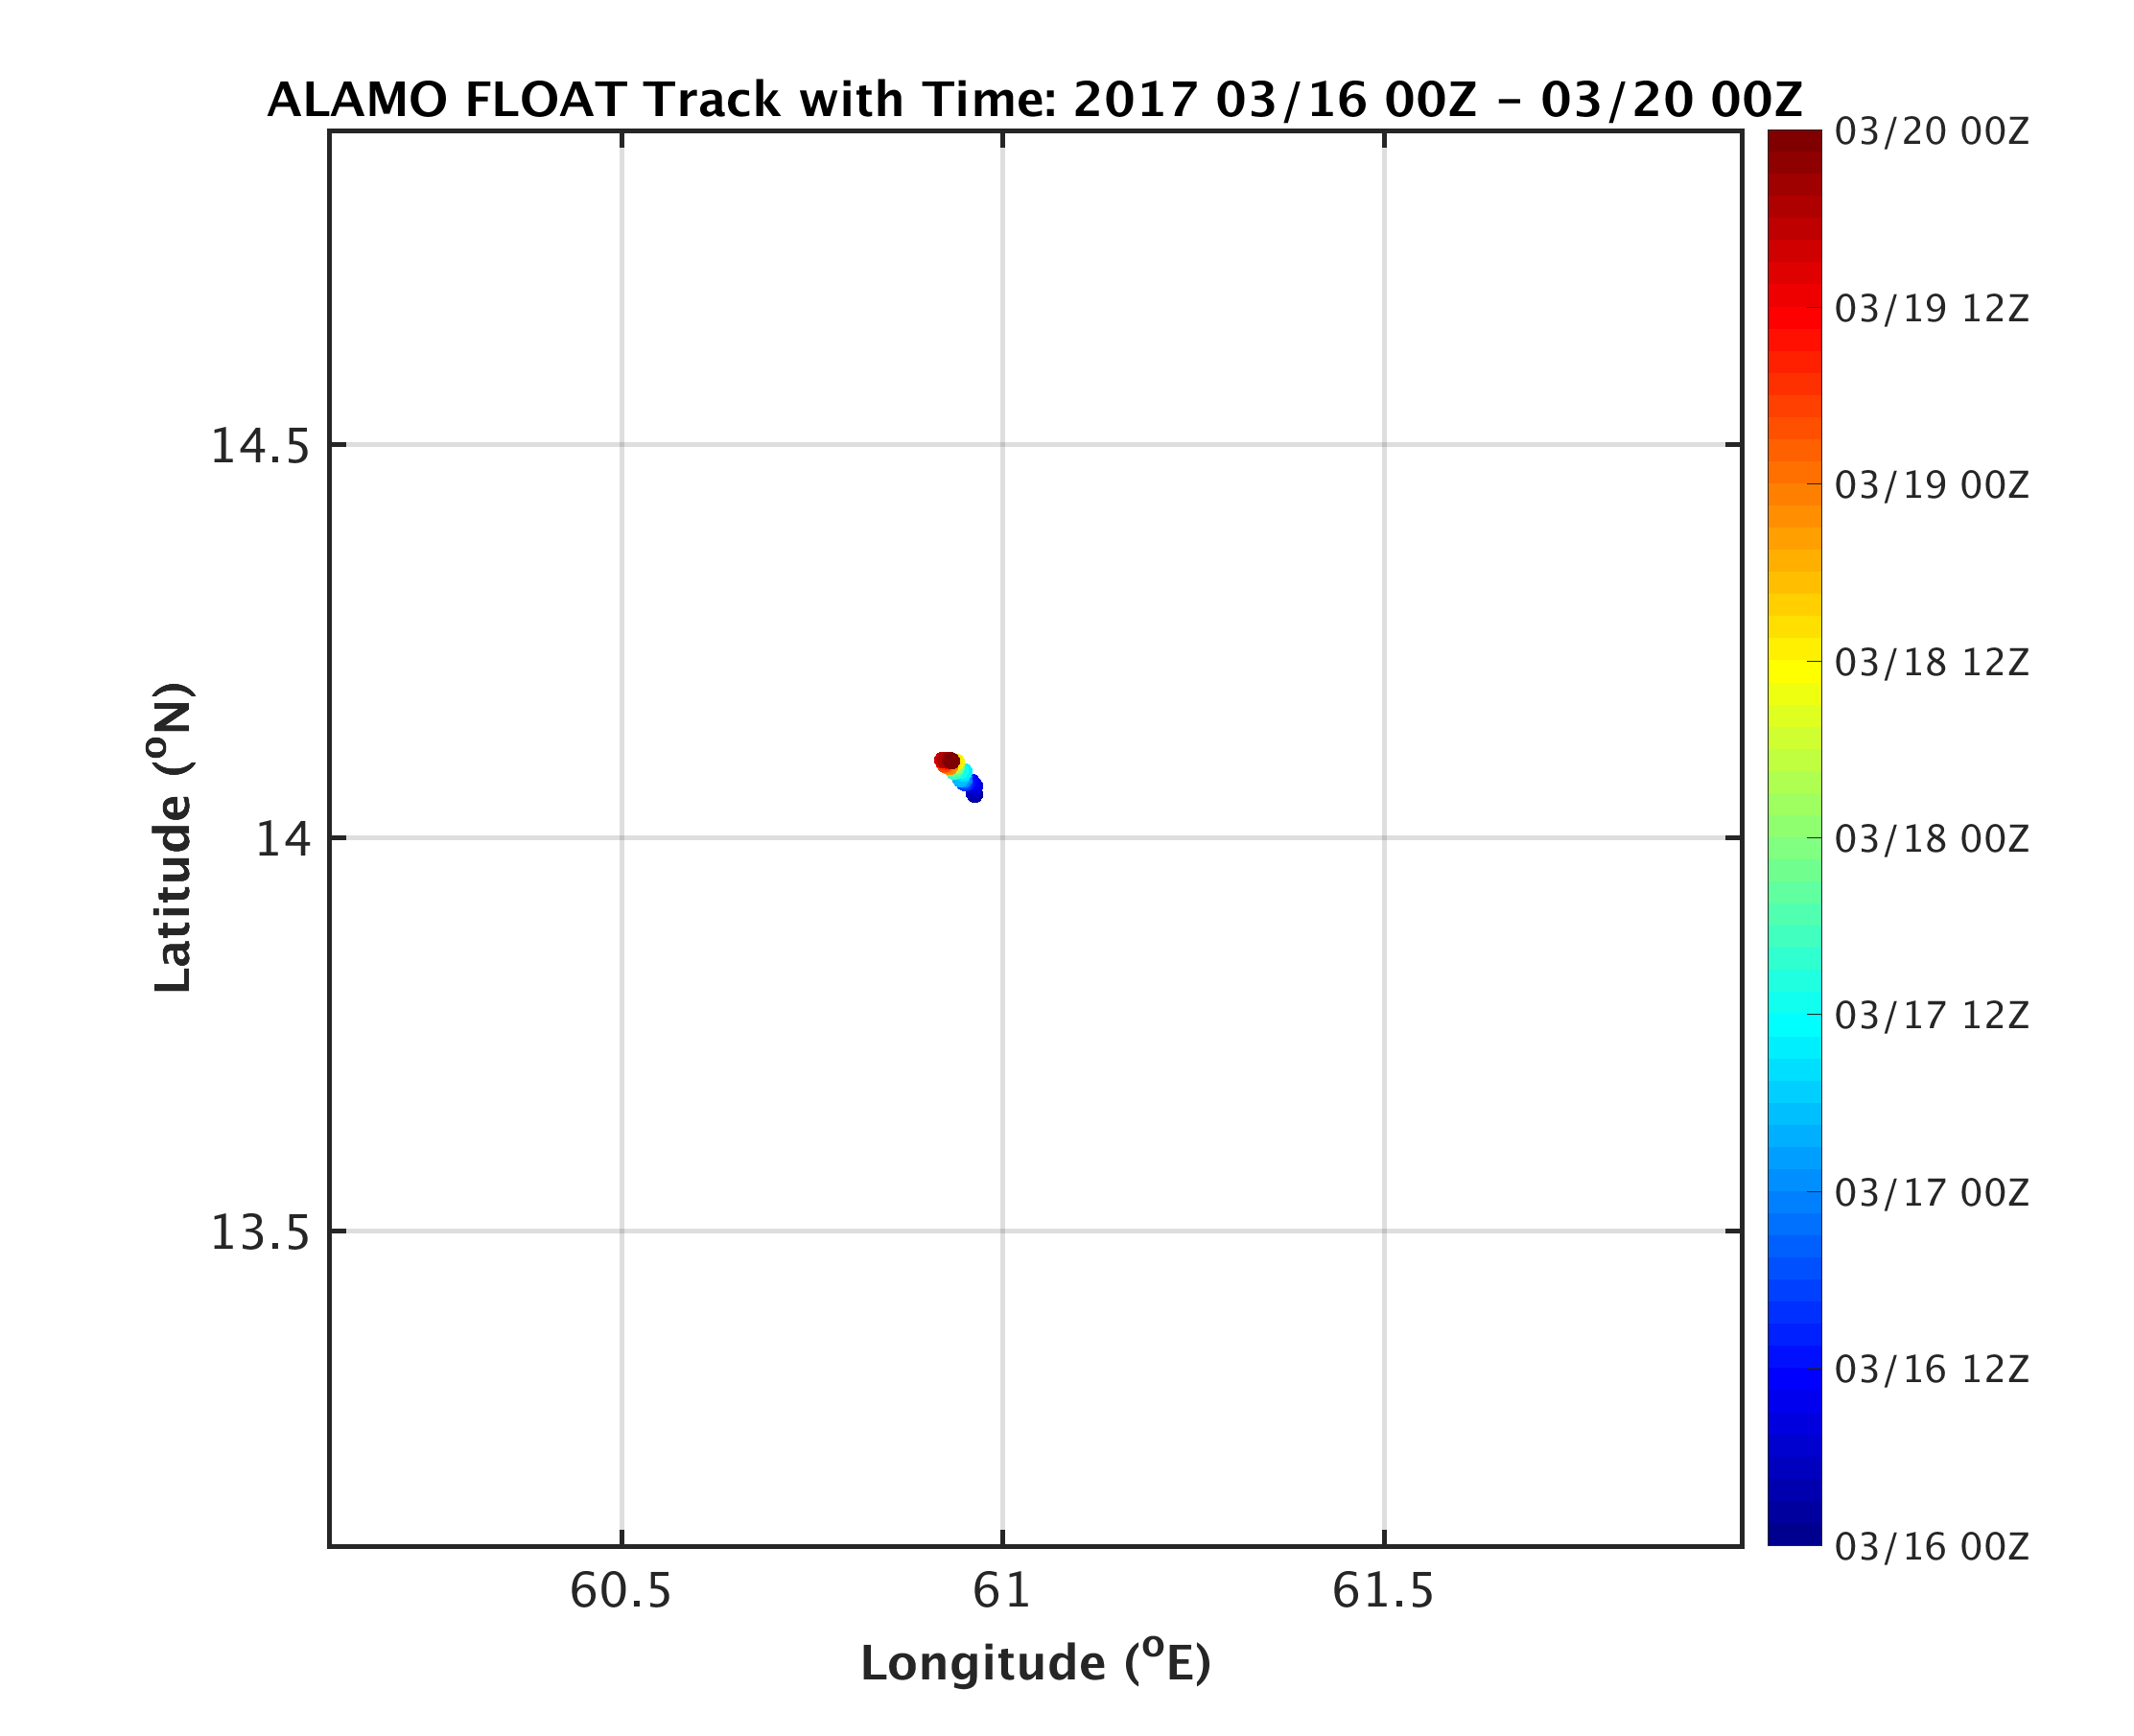

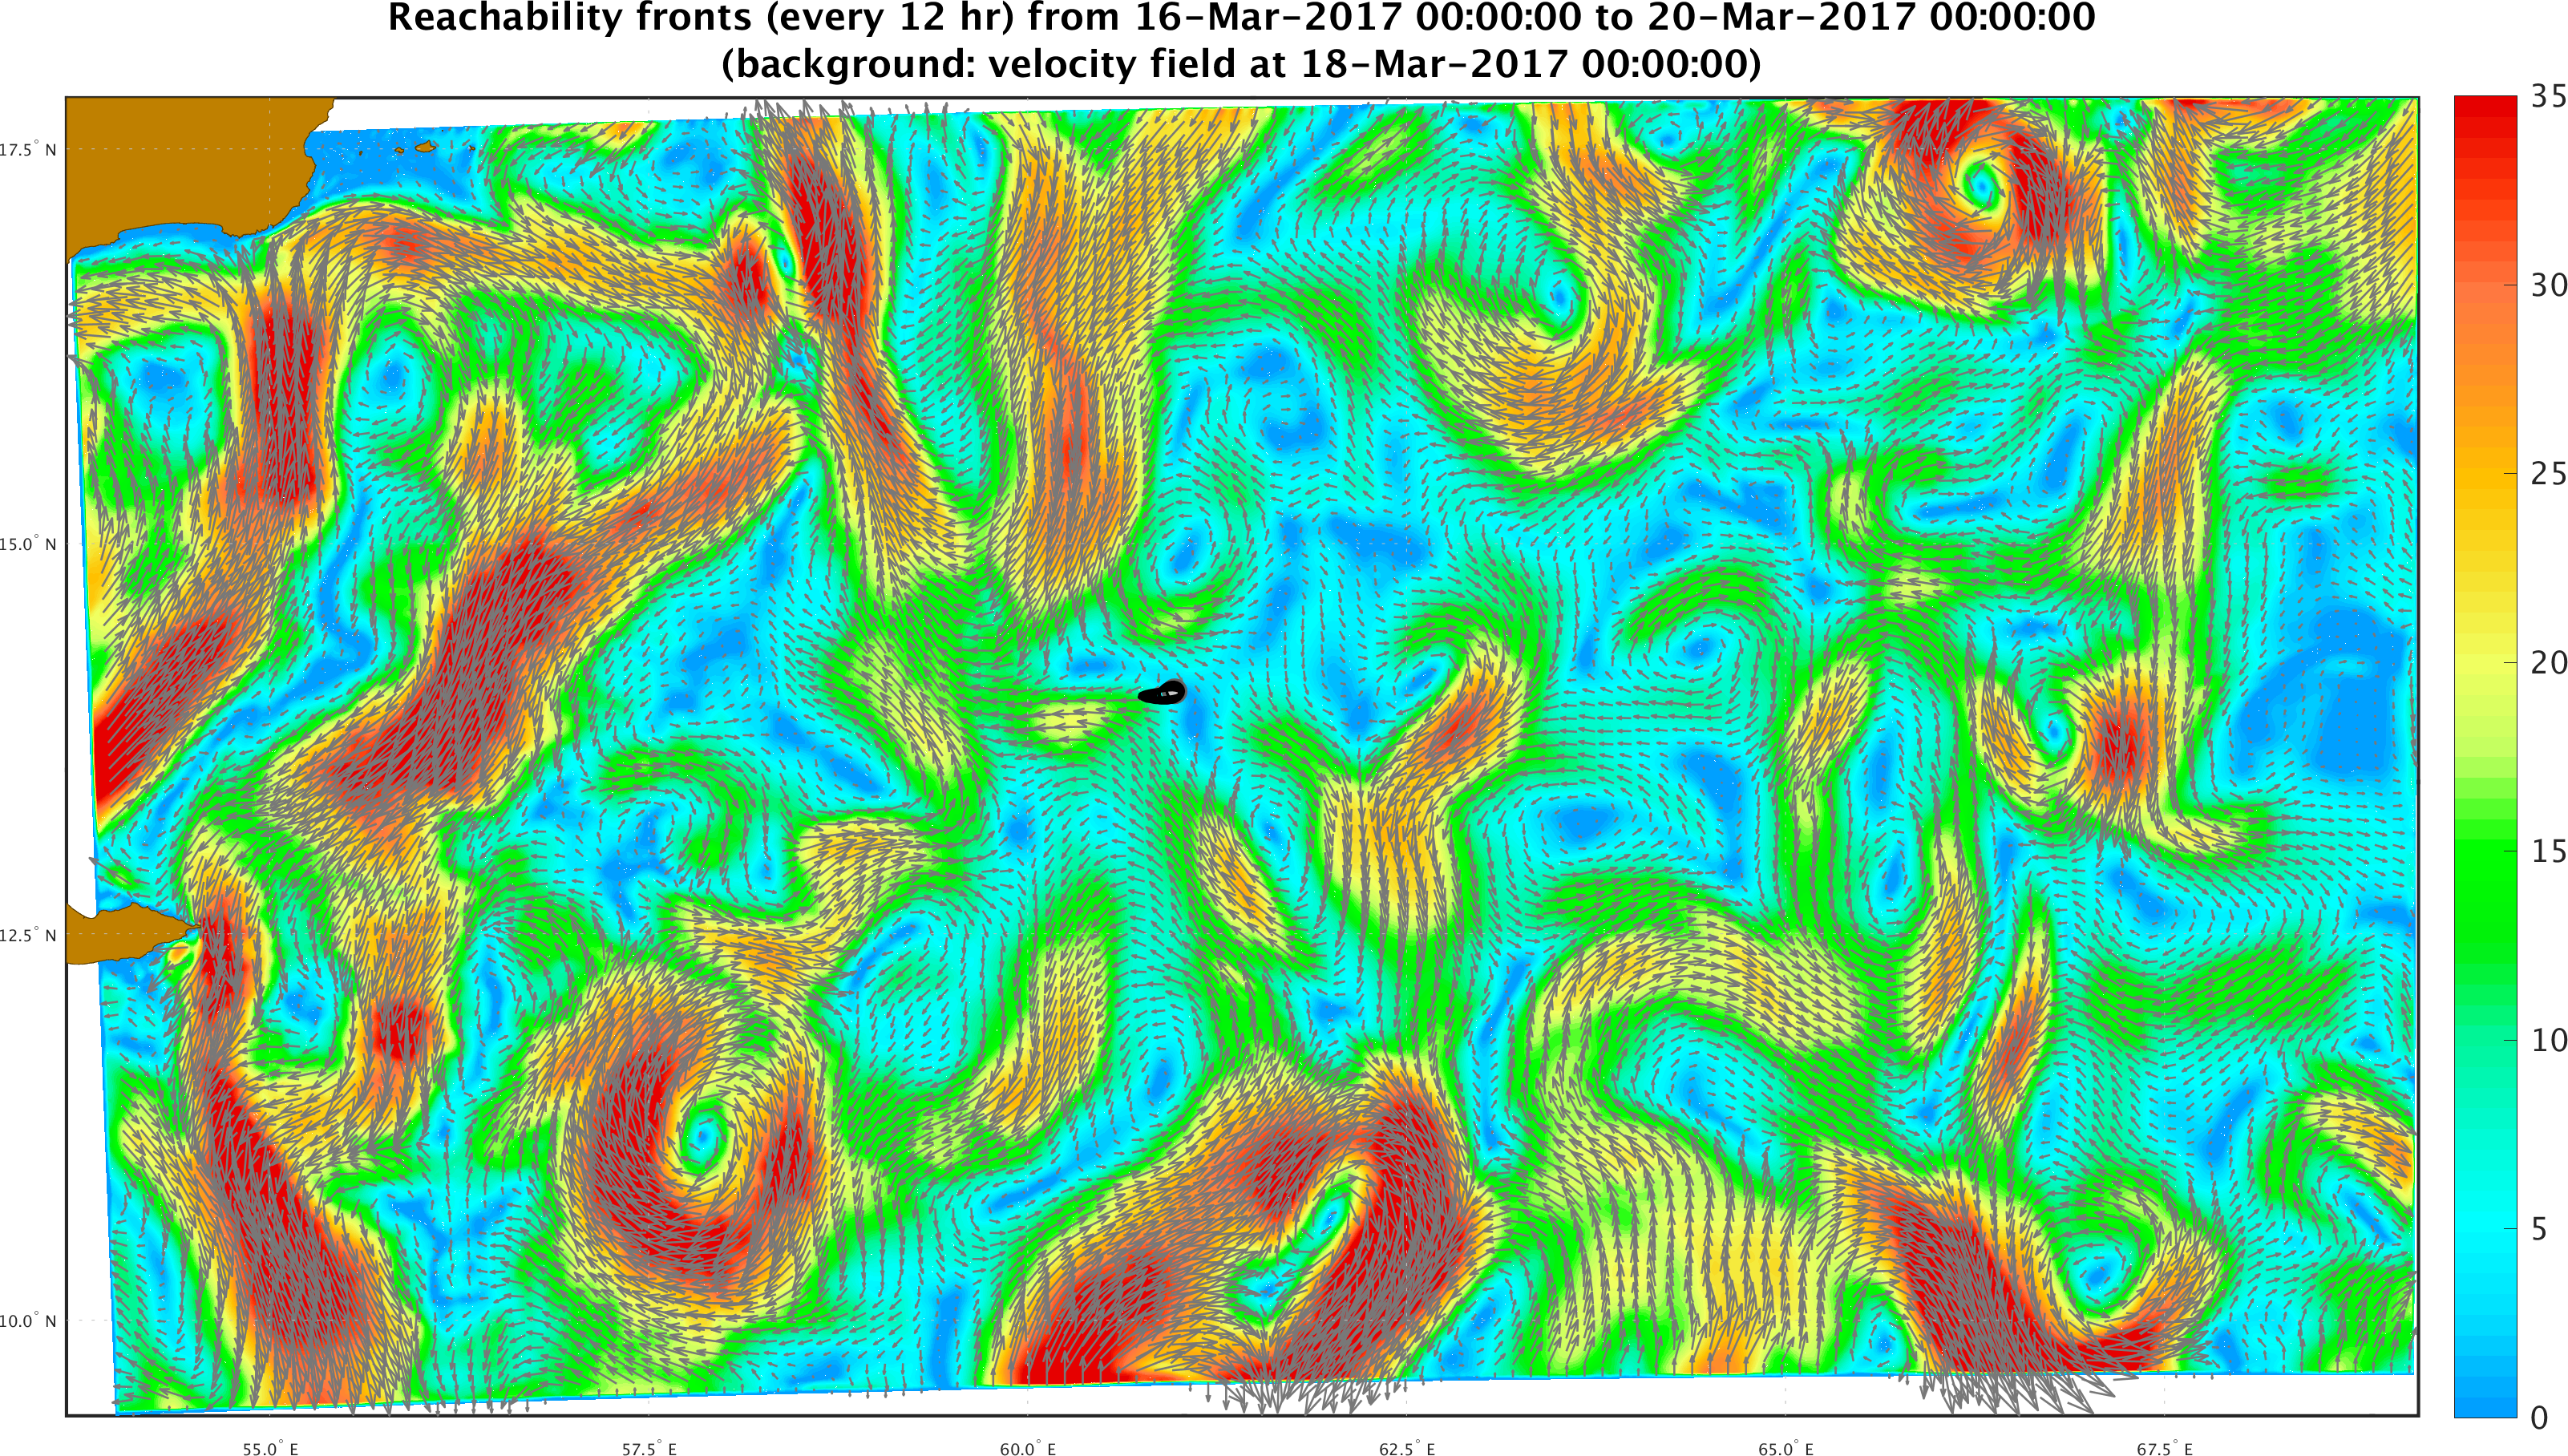

The black contours shown are reachability front forecasts, at 12 hour intervals (12hr to 96h forecasts). The reachability front is the boundary of the largest set (the reachability set) that the float can reach within that duration. It is computed using our modified level-set time-optimal PDE which is the exact governing PDE for this reachability front. Two forecasts are shown: one where the initial circle has a radius of 5.4 km (3-cell) and of 3.6 km (2-cell). The actual track (available after the forecast is issued is plotted for evaluation in the rightmost column.
| Starting Location: 14.053837°N, 60.966801°E | ||||
|---|---|---|---|---|
| Starting circle with 3-cell radius | Starting circle with 2-cell radius | Actual Track | ||
| Zooms on Operational Area of Interest | Zooms on Operational Area of Interest | |||
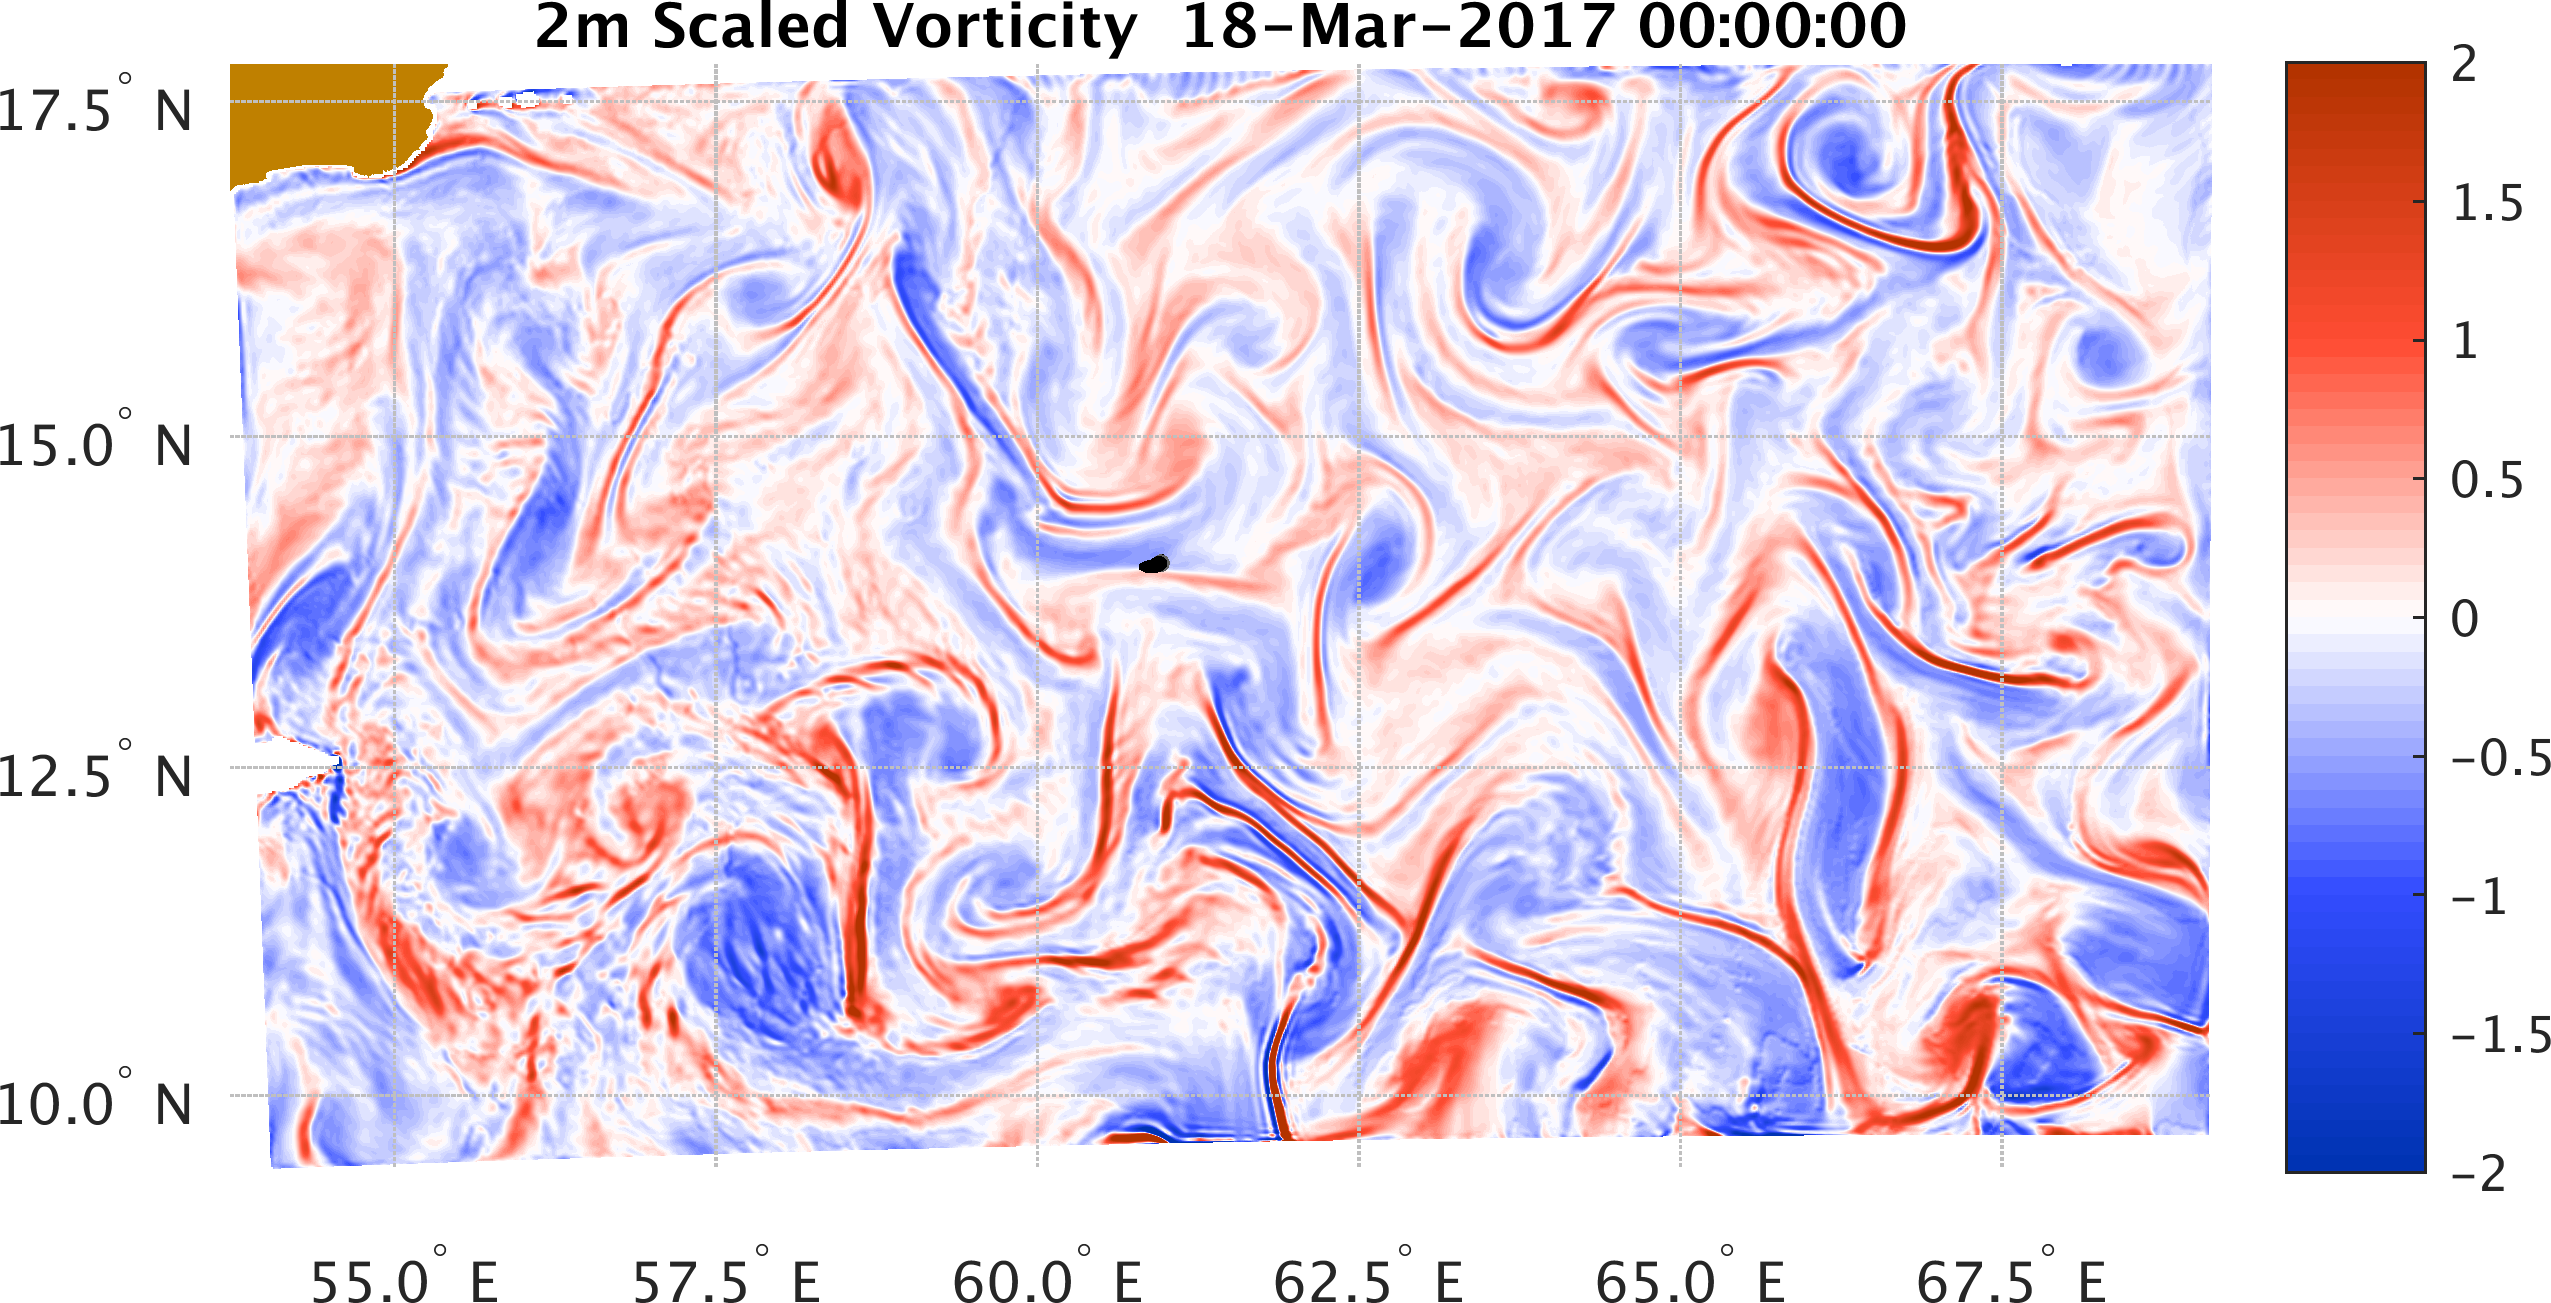
| 2m Vorticity Background | Surface Velocity Background | 2m Vorticity Background | Surface Velocity Background | |
|
|
|
|
|
|
| Interior Northern Arabian Sea Domain | Interior Northern Arabian Sea Domain | |||
| 2m Vorticity Background | Surface Velocity Background | 2m Vorticity Background | Surface Velocity Background | |
|
|
|
|
|
|