Glider Reachability Maps for 04 Mar 0000Z to 08 Mar 0000Z 2017, Issued 04 Mar 2017
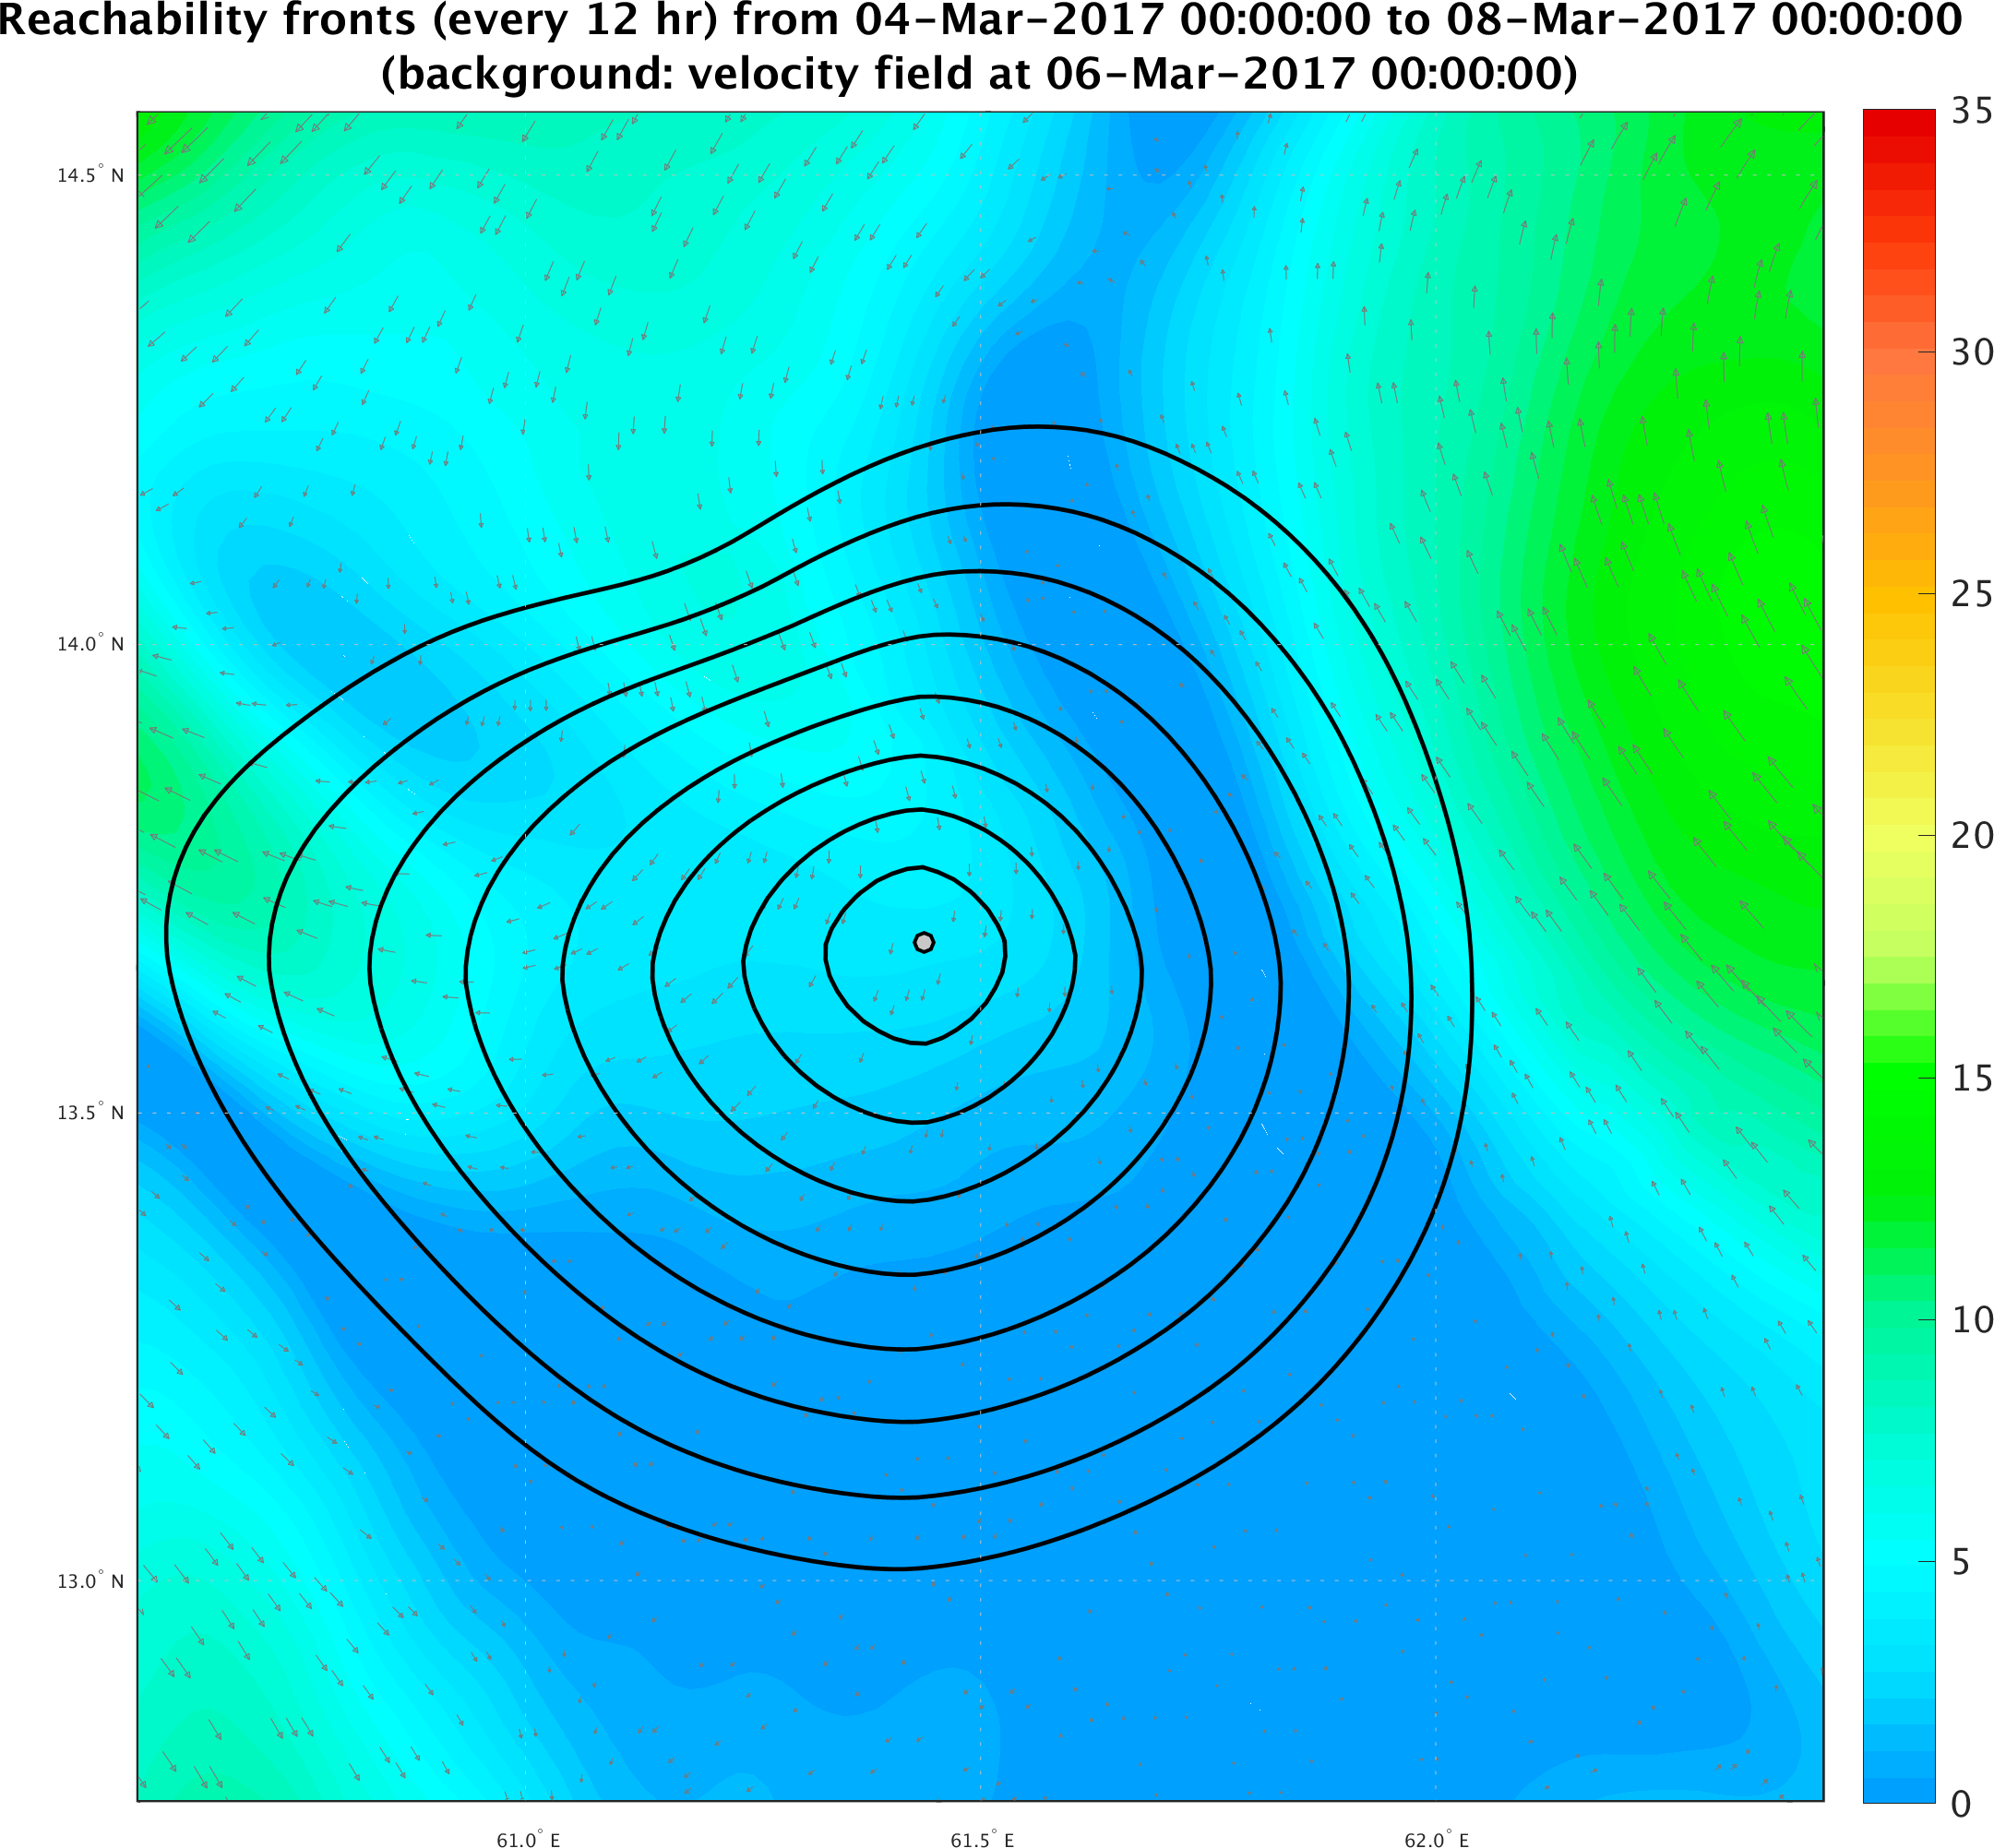
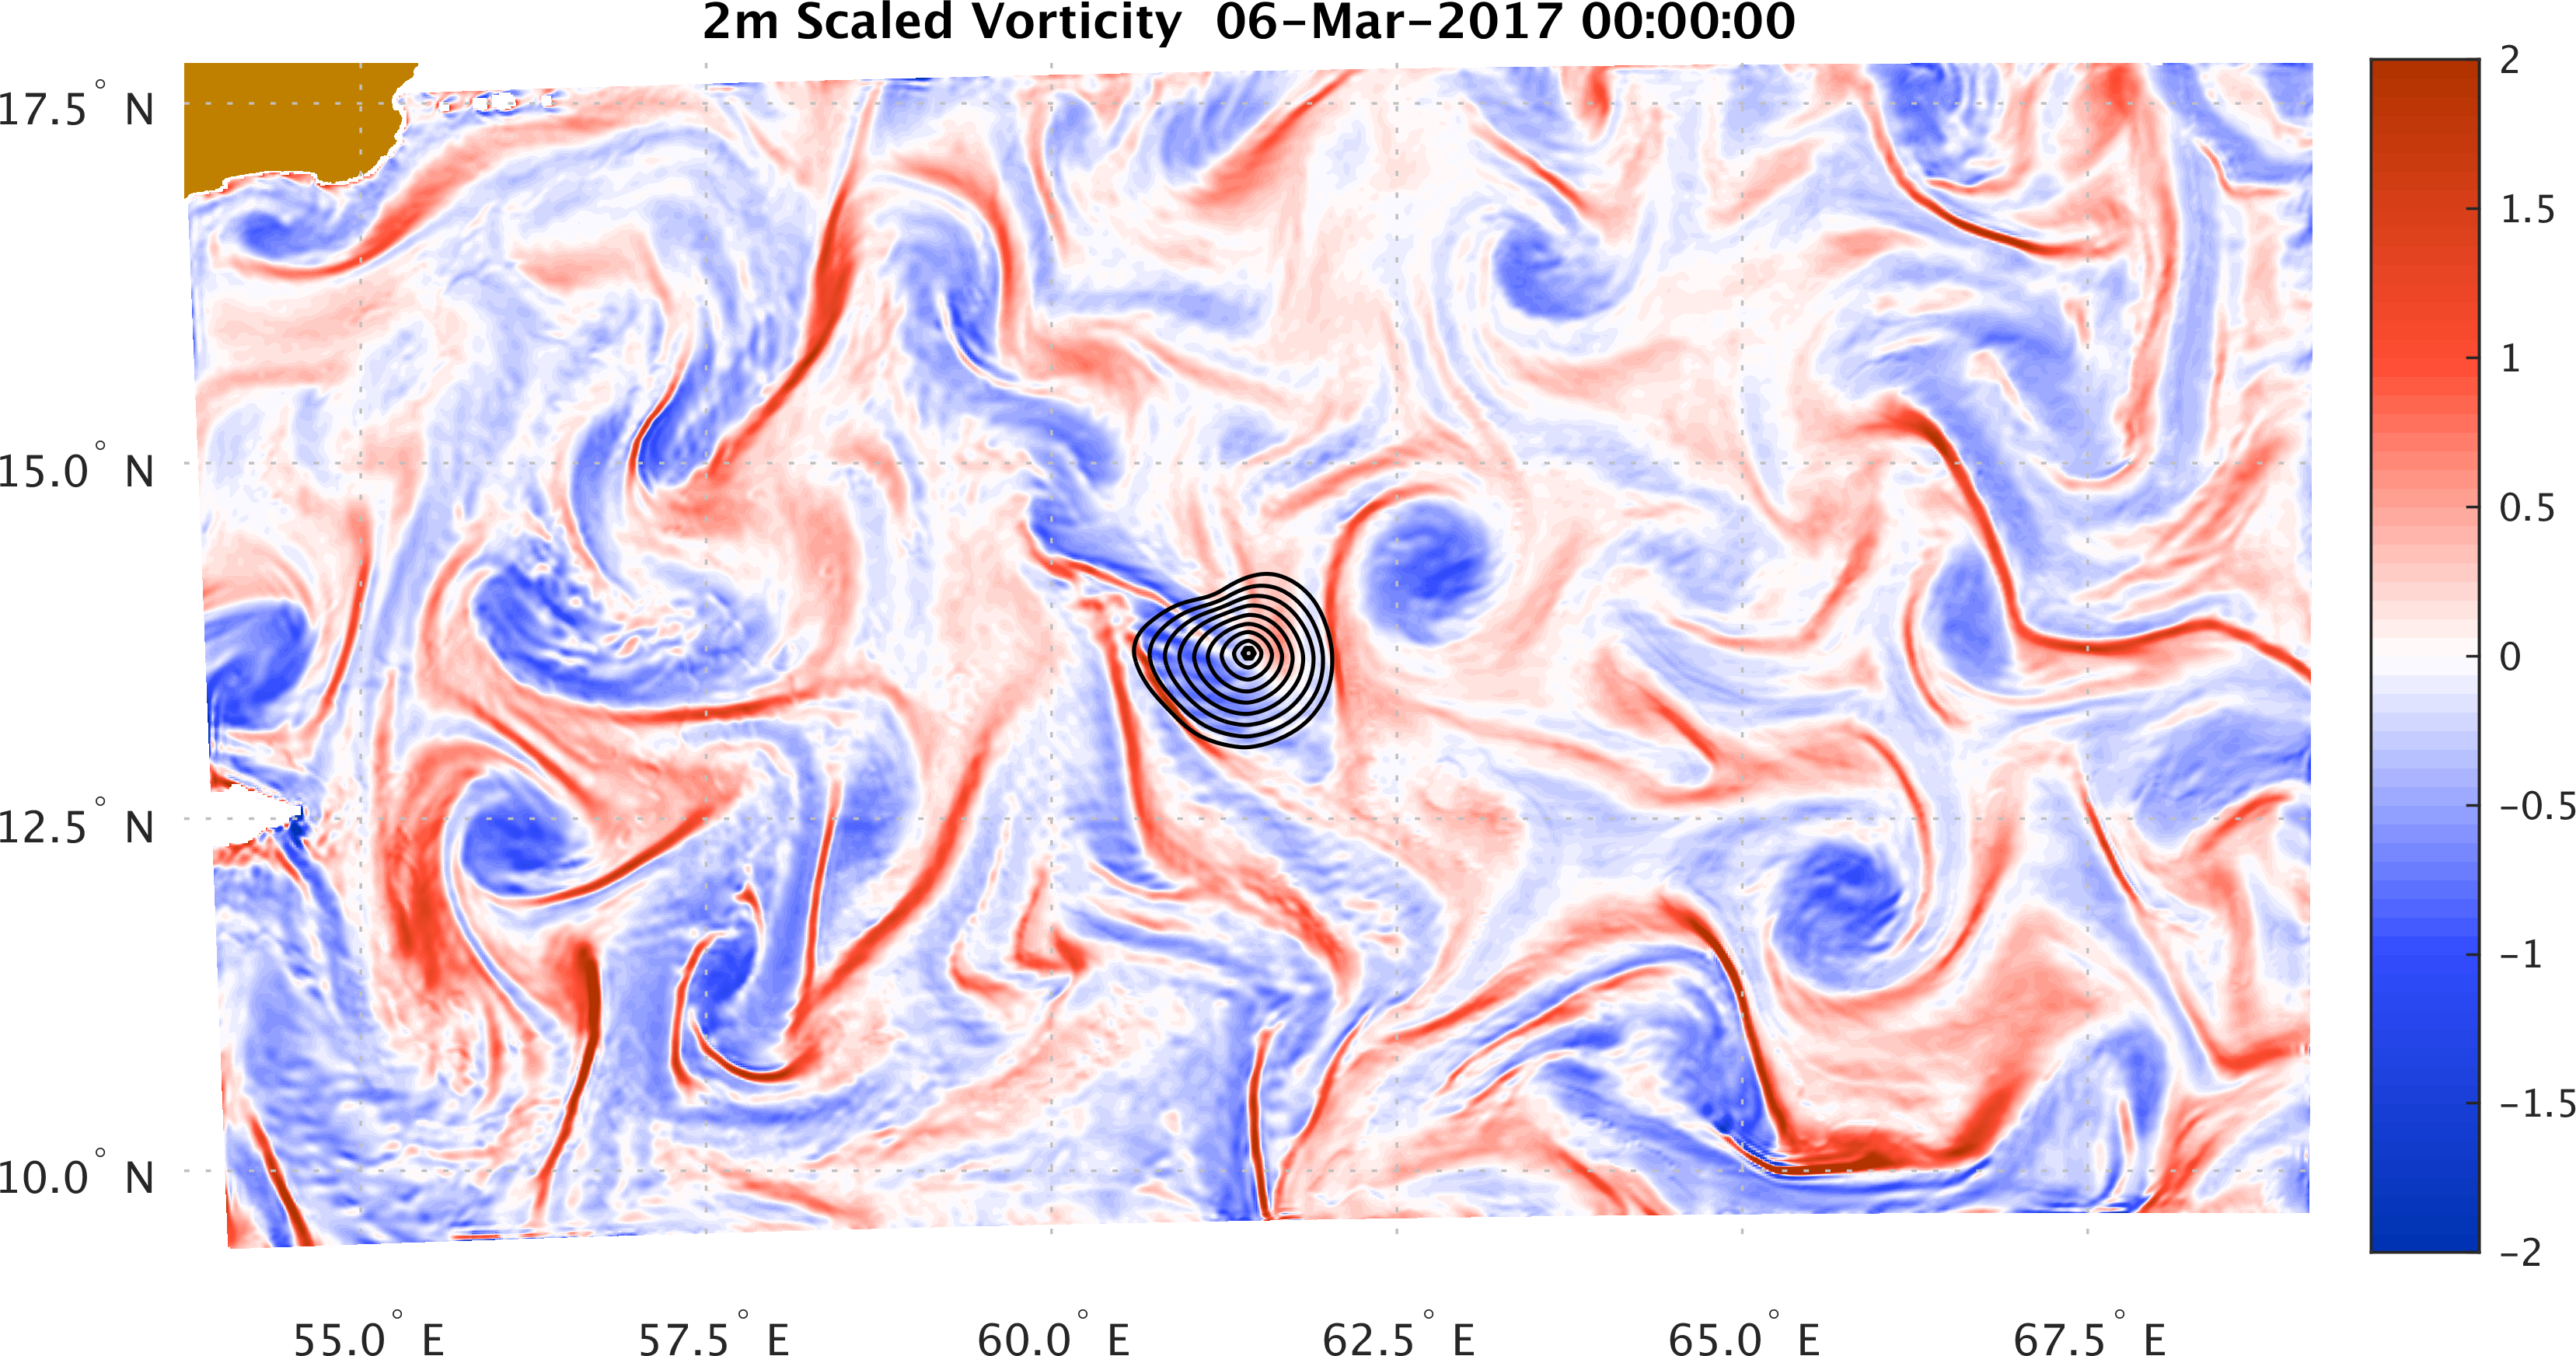
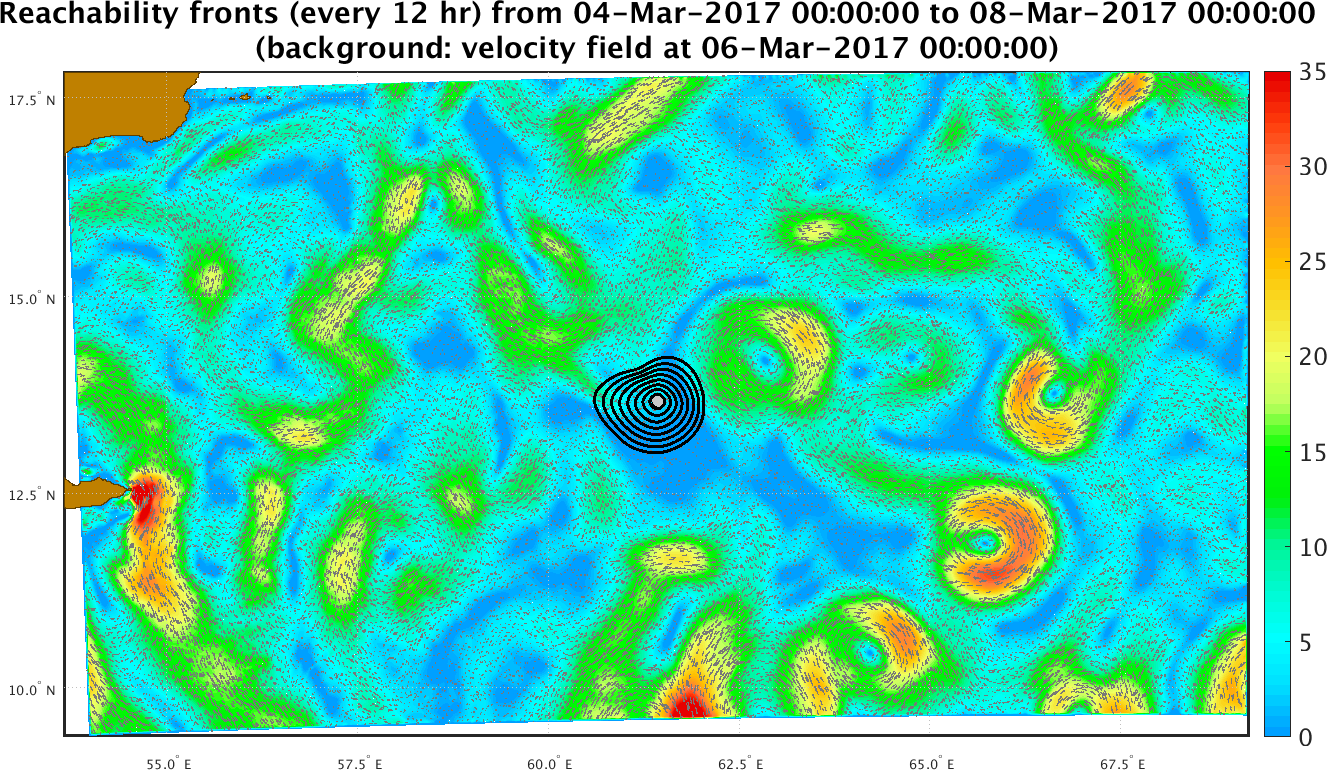
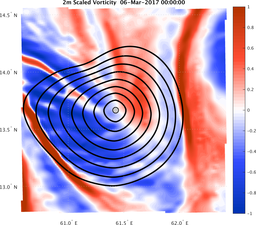
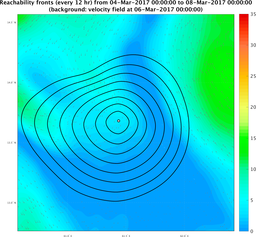
The black contours shown are reachability front forecasts, at every 12 hour intervals (12hr to 96h forecasts). The reachability front is the boundary of the largest set (the reachability set) that the glider can reach within that duration. It is computed using our modified level-set time-optimal PDE which is the exact governing PDE for this reachability front.
| Zooms on Operational Area of Interest |
| 2m Vorticity Background |
Surface Velocity Background |
|
|
| Full Modeling Domain |
| 2m Vorticity Background |
Surface Velocity Background |

|

|