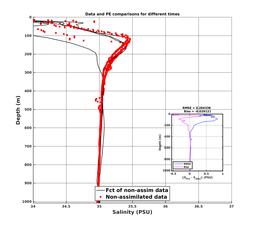
MSEAS-PE Fct - Data comparison for Jul 31

Forecasts for 27 Jul 0000Z to 02 Aug 0000Z 2024, Issued 29 Jul 2024

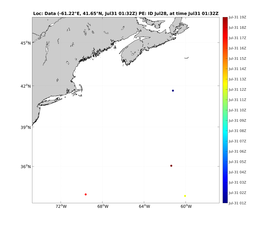
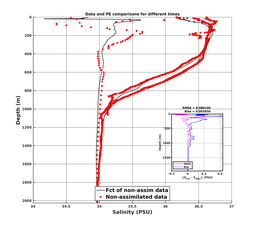
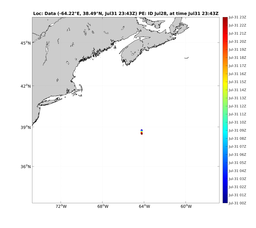
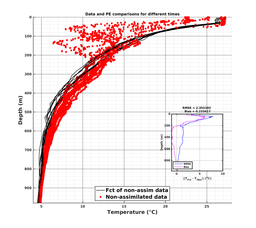
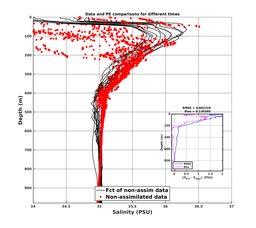
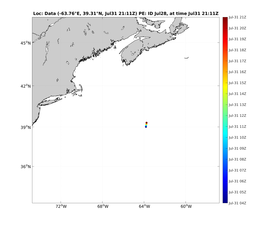
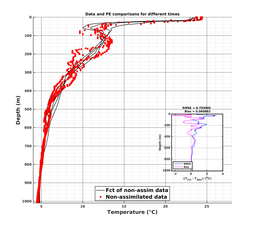
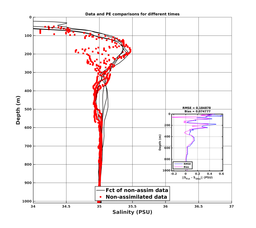
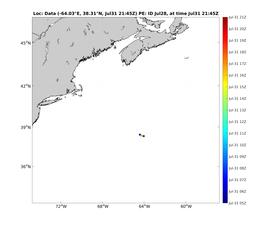
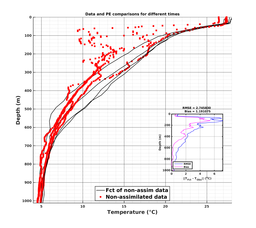
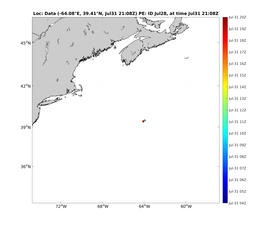
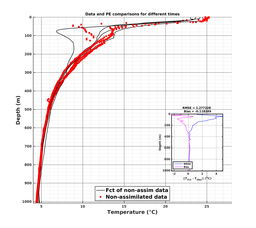
Comparisons of MSEAS-PE model forecasts to data at data locations. Black lines denote MSEAS-PE forecasts of the unused (i.e., independent) data; Gray lines denote MSEAS-PE forecasts of the used data (e.g., assimilated, if enabled for the run); Red dots denote unused (i.e., independent) data; and Green dots denote used data.

Data TypeLocationTemperatureSalinity
ARGO Nesma0p022deg0003/ARGO-20240731T013253_prof_all004_PEid-Jul28_PEtime_20240731_0132Z_Cen_1L_dd.png
Nesma0p022deg0003/ARGO-20240731T013253_prof_all004_PEid-Jul28_PEtime_20240731_0132Z_Cen_2T_dd.png
Nesma0p022deg0003/ARGO-20240731T013253_prof_all004_PEid-Jul28_PEtime_20240731_0132Z_Cen_3S_dd.png
ELECTA Nesma0p022deg0003/ELECTA-20240731T234309_prof_all012_PEid-Jul28_PEtime_20240731_2343Z_Cen_1L_dd.png
Nesma0p022deg0003/ELECTA-20240731T234309_prof_all012_PEid-Jul28_PEtime_20240731_2343Z_Cen_2T_dd.png
Nesma0p022deg0003/ELECTA-20240731T234309_prof_all012_PEid-Jul28_PEtime_20240731_2343Z_Cen_3S_dd.png
SP007 Nesma0p022deg0003/SP007-20240731T211114_prof_all004_PEid-Jul28_PEtime_20240731_2111Z_Cen_1L_dd.png
Nesma0p022deg0003/SP007-20240731T211114_prof_all004_PEid-Jul28_PEtime_20240731_2111Z_Cen_2T_dd.png
Nesma0p022deg0003/SP007-20240731T211114_prof_all004_PEid-Jul28_PEtime_20240731_2111Z_Cen_3S_dd.png
SP065 Nesma0p022deg0003/SP065-20240731T214504_prof_all004_PEid-Jul28_PEtime_20240731_2145Z_Cen_1L_dd.png
Nesma0p022deg0003/SP065-20240731T214504_prof_all004_PEid-Jul28_PEtime_20240731_2145Z_Cen_2T_dd.png
Nesma0p022deg0003/SP065-20240731T214504_prof_all004_PEid-Jul28_PEtime_20240731_2145Z_Cen_3S_dd.png
SP066 Nesma0p022deg0003/SP066-20240731T210830_prof_all004_PEid-Jul28_PEtime_20240731_2108Z_Cen_1L_dd.png
Nesma0p022deg0003/SP066-20240731T210830_prof_all004_PEid-Jul28_PEtime_20240731_2108Z_Cen_2T_dd.png
Nesma0p022deg0003/SP066-20240731T210830_prof_all004_PEid-Jul28_PEtime_20240731_2108Z_Cen_3S_dd.png