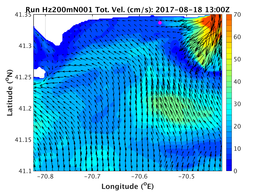
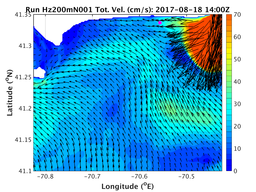
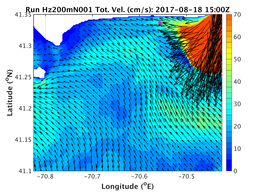
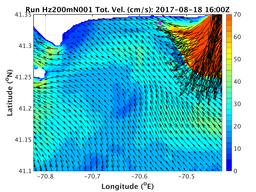
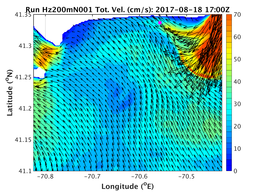
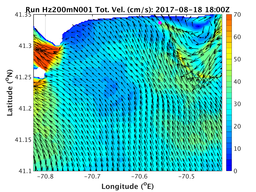
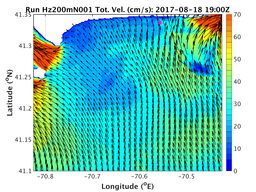
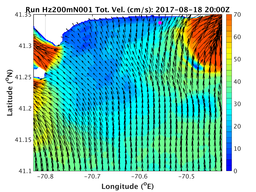
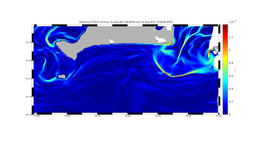
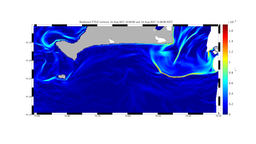
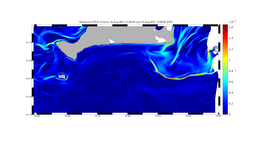
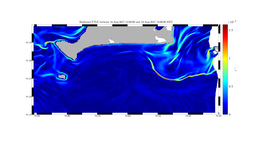
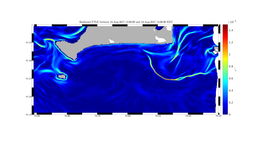
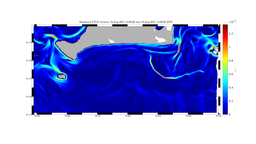
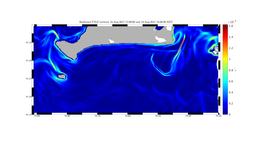
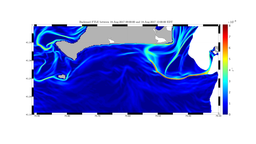
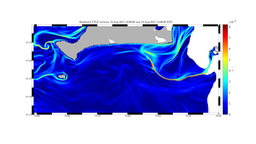
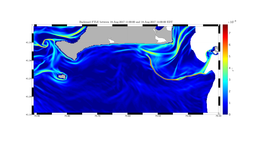
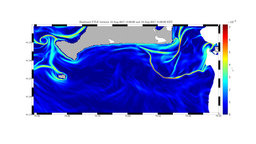
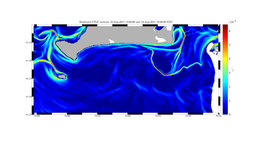
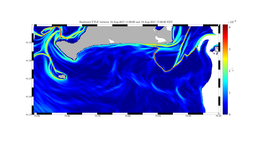
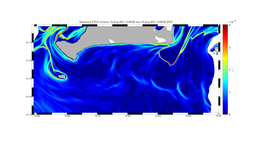
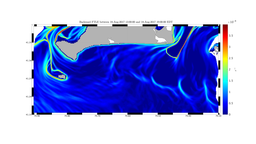
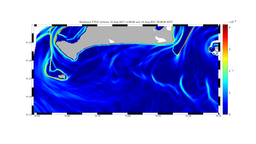
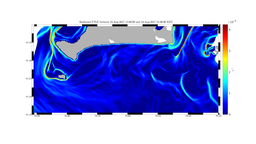
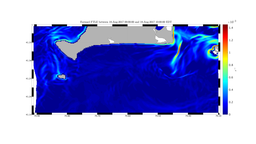
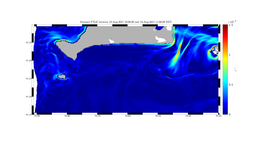
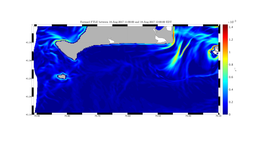
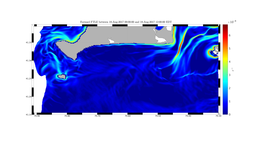
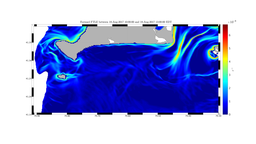
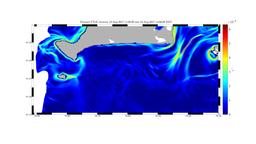
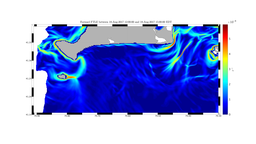
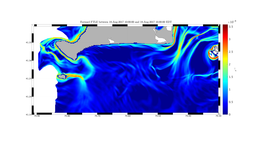
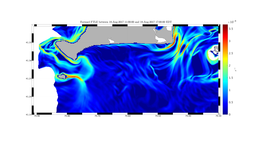
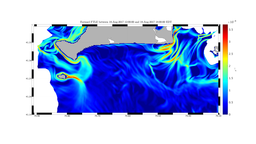
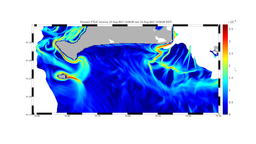
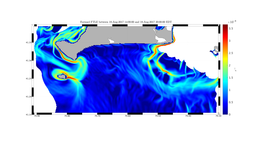
The following figures show the MSEAS PE forecasts of horizontal velocities snapshots in a region covered by the HF-radar, ever hour, extracted out of the 200m simulation (with implicit 2-way nesting in a 600 m simulation). Also shown are the FTLE but in the full 200 m simulation domain.
As a reminder, 12:00Z = 08:00 EDT, i.e., local time is 4 hours behind Zulu time.
The MSEAS PE forecasts of horizontal velocities snapshots (velocity vectors overlaid on velocity magnitude) are shown every hour in a region covered by the HF-radar.
 |
 |
 |
 |
 |
 |
 |
 |
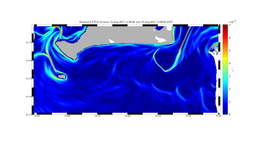
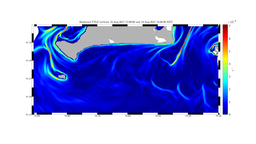
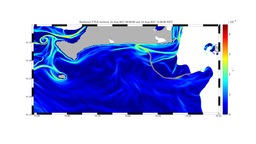
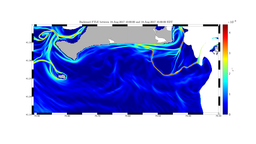
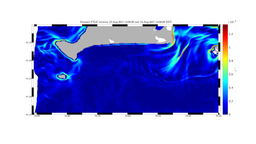
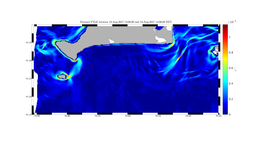
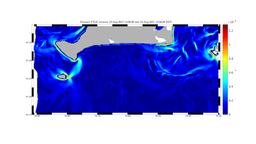
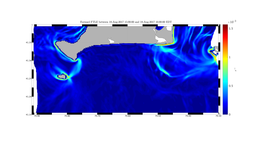
The FTLE computations are for a time window of 1, 3, or 6 hours for the forecast of 18 August 2017 to 19 August 2017. The window center shifts in 1 hour intervals. The flow maps were calculated using a PDE based approach by using 5th order spatial and 3rd order temporal schemes, and a novel composition based approach. As a reminder, 12:00Z = 08:00 EDT, i.e., local time is 4 hours behind Zulu time.
| 0 m |
| Time Window | 13:00Z | 14:00Z | 15:00Z | 16:00Z | 17:00Z | 18:00Z | 19:00Z |
|---|---|---|---|---|---|---|---|
| 1-hour window |
 |
 |
 |
 |
 |
 |
 |
| 3-hour window |
 |
 |
 |
 |
 |
 |
 |
| 6-hour window |
 |
 |
 |
 |
 |
 |
 |
| Time Window | 13:00Z | 14:00Z | 15:00Z | 16:00Z | 17:00Z | 18:00Z | 19:00Z |
|---|---|---|---|---|---|---|---|
| 1-hour window |
 |
 |
 |
 |
 |
 |
 |
| 3-hour window |
 |
 |
 |
 |
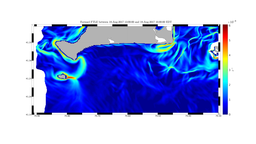 |
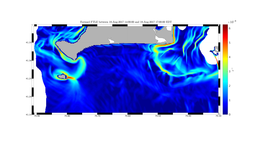 |
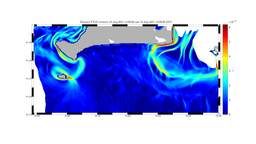 |
| 6-hour window |
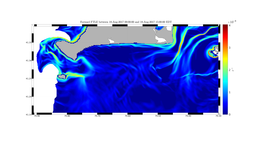 |
 |
 |
 |
 |
 |
 |