Real-Time QPE Simulations
QPE Pilot Study Ocean Physics Forecast
Forecast for 8 September 2008, Issued 6 September 2008
This web page presents the output from two 8 day free surface simulations forced with a
combination of COAMPS (wind stress) and NOGAPS (heat-flux, E-P) atmospheric forcing, initialized using
the Taiwanese
in situ data and a summer
climatology created using June-August profiles and the
HydroBase2 software. The bathymetry used is the NCOR bathymetry.
In our simulations so far, an uncertainty source is still the transport just north of
Taiwan. We have decided to change one of the 2 forecasts types we issued today: one still
has an initial 1Sv northward transport but the other now has an initial 1Sv southward
transport through the Strait (instead of the data-driven freely computed transport of
2.5Sv S). Of course, these boundary transports change with time, based on the interior
flows and open boundary conditions. A second uncertainty source is the impact of tidal
effects on the mesoscale hydrographic and circulation features in the forecasts,
especially just north of Taiwan. We have several simulations which include tides which we
are currently studying and comparing.
From the OR2 and OR3 data we have from last week, the SST data and our varied model
simulations which assimilate the OR2-OR3, we still believe there is some upwelling of
deeper Kuroshio water on the shelf just north of Taiwan, with nice filaments being
advected north-eastward along the shelfbreak on the edge of the Kuroshio (this seems to
match the older SST analyses from the Taiwan Central Weather Bureau). This would indicate
that subtidal currents just north of Taiwan are westward. Associated with this is a relatively
classic situation of a meander of the Kuroshio in the QPE area. In summary, this means that the
forecast
initialized with a "1Sv southward transport in the Taiwan Strait" should be closer to the
truth. However, we are not yet certain; more study is needed, including the impact of
tidal forcing.
Acoustic simulations from each of these two dynamical simulations, with vertical sections
of transmission loss (TL) and sound speed, can be found
here.
| Nowcasts and Forecasts of Environmental Conditions |
|---|
| Initial Transport |
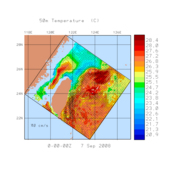
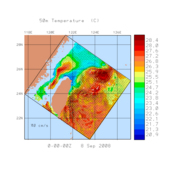
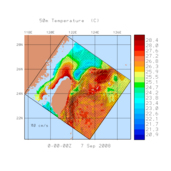
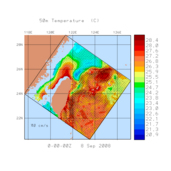
50m Temperature |
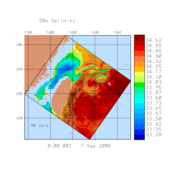
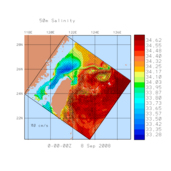
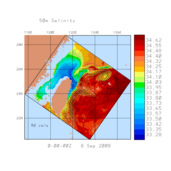
50m Salinity |
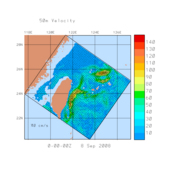
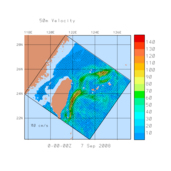
50m Velocity |
Complete set of Plots |
| Nowcast - 7 September |
Forecast - 8 September |
Nowcast - 7 September |
Forecast - 8 September |
Nowcast - 7 September |
Forecast - 8 September |
1.0Sv S |
 |
 |
 |
 |
 |
 |
X |
1.0Sv N |
 |
 |
 |
 |
 |
 |
X |