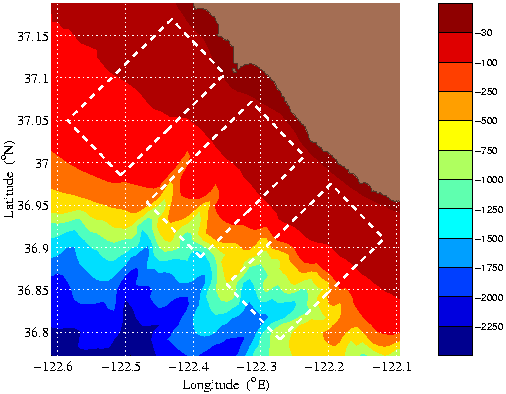
ASAP OSSE: Experiment 1
Fixed Tracks, Variable Number of Gliders

The first OSSE is a preliminary quick look, using software already in hand. That software was designed to extract pseudo-CTDs from a running HOPS Primitive Equation simulation at pre-specified locations and times. The extracted casts are the temperature and salinity in the nearest vertical column in the HOPS grid at the nearest time step.
| SIO | WHOI |
| 1.59 km | 0.325 km |
| 2.26 hr | 0.631 hr |
Using this software, a zeroth order glider model was constructed as a set of positions and times to mimic a glider moving around one of the three canonical paths, shown at right, at a constant speed. To guide this model, the average spacing in distance & time were computed for profiles collected by gliders during AOSN-II (Table to left). Given that the HOPS model resolution for the AOSN-II simulation is only about 1.5km, the numbers for the SIO gliders were chosen as the starting point, with the profile distance reduced to the model resolution. From these values, the time for a single glider to traverse one of the tracks shown was determined to be about 3.6 days. The temporal spacing was reduced to ~1.85 hr to reduce the total travel time to an even 3 days.
These gliders were then used in a variant of the HOPS AOSN-II re-analysis simulation. The simulation used here differs from the standard re-analysis in 2 essential details:
| Synoptic | Mean | |
| Spatial Decay (km) | 5 | 25 |
| Zero Crossing (km) | 12.5 | 50 |
| Temporal Decay (days) | 3 | 80 |
5 simulations were run, each with a different number of gliders per track (1, 2, 3, 4 or 5). For each of these data sets, the pseudo-CTDs were objectively analyzed at 1200Z on 10 days: August 08, 11, 14, 17, 20, 23, 26, 29 and September 01 & 04, 2003, using the correlation parameters given in the table to the right. These particular days were chosen since they represent the center of the 3-day blocks it takes the single glider per track to complete one cycle. Each objective analysis (OA) was made using a temporal subsample of the particular dataset. The sub-sampling was done so that each OA only used 1 circuit worth of data (e.g. for the single glider per track dataset, only data within ±1.5 days of the analysis time were used; for the 5 gliders per track dataset, only data within ±0.3 days of the analysis time were used.). The OA fields are then compared to the corresponding instantaneous snap-shot of the simulated true ocean using difference field plots at select levels and bias & RMS statistics horizontally averaged over the entire domain.
The original 5 data sets were then augmented with 2 "large number" sets. The first, 12 gliders per track, was chosen so that the OA only needed a quarter day's worth of data (±0.125 days). The second set was chosen to "fill" the tracks. Since each track described above turned out to have 39 distinct points, 39 gliders were run along each track in an attempt to have the OA work with a snapshot. What actually occurred was that the analysis times fall exactly half-way between 2 sampling times, so the OAs are an average of both.
When RMS statistics integrated over the entire simulation were examined, it was revealed that 12 gliders per track achieved essentially the same accuracy as 39 gliders per track and that both were significant improvements over 5 gliders per track. "Fill-in" runs (6, 7, 8, 9, 10 & 11 gliders per track) were then made and simulation integrated statistics computed. The results of these runs reveals that the RMS error reduction essentially asymptotes at 8 gliders per track.
| Temperature | Salinity |