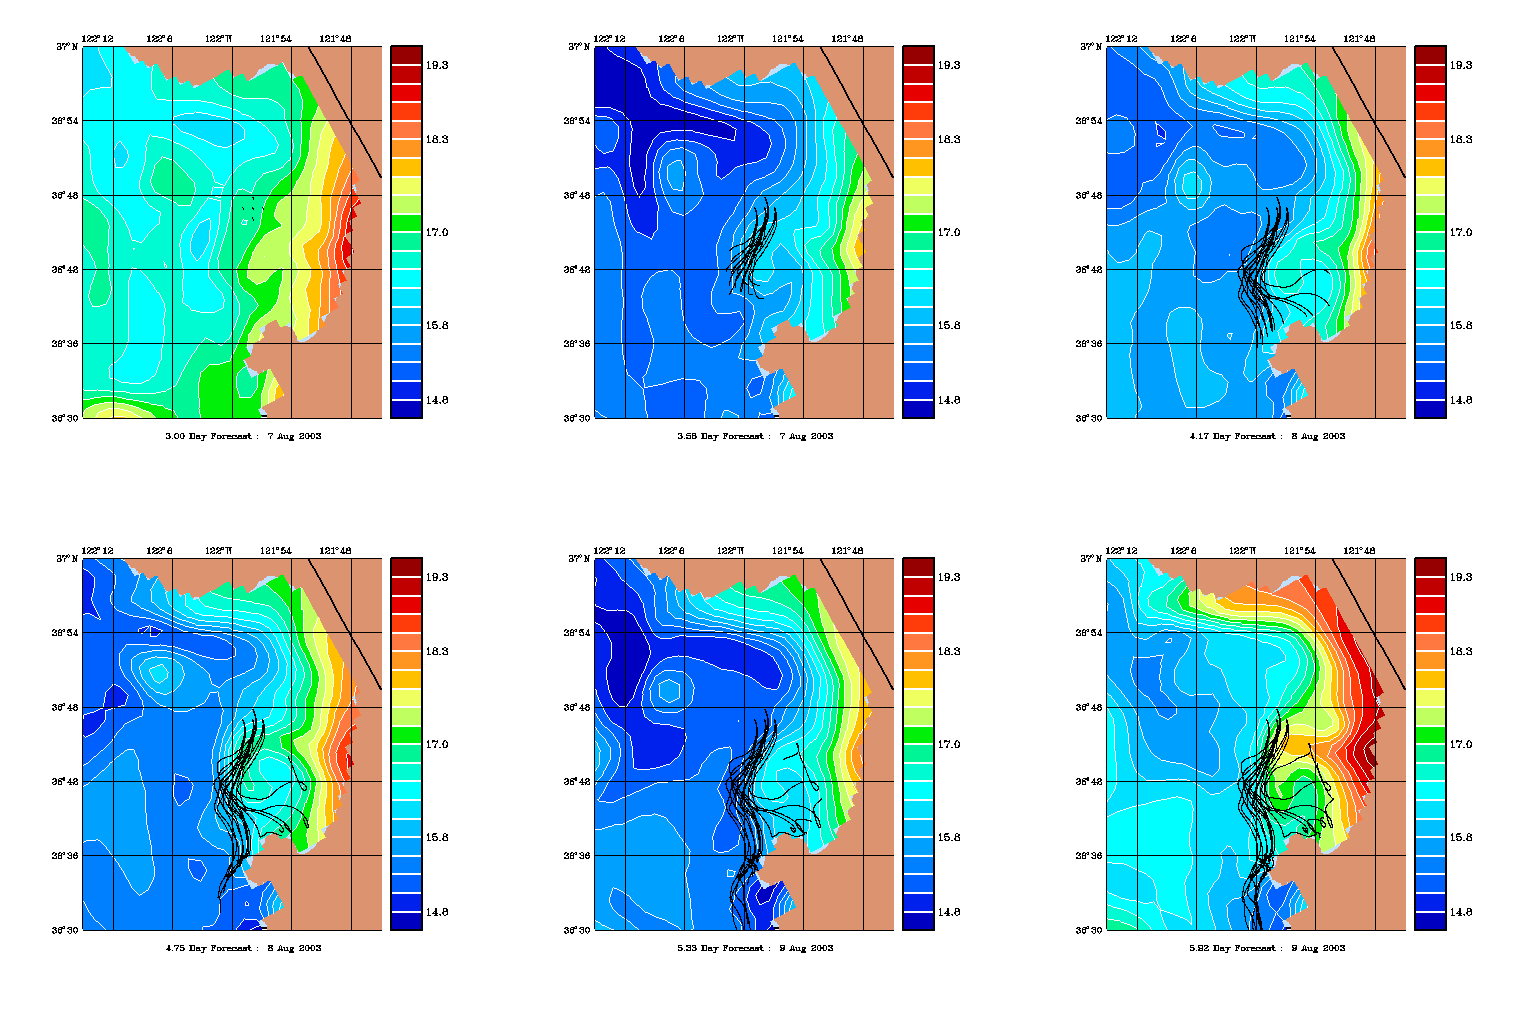

In order to predict the path of the real drifter deployed by Francisco Chavez and to provide an estimate of uncertainty in this prediction, a total of 15 simulated drifters were deployed in the HOPS simulation:

|

|
Each set of 5 were placed in a "cross" pattern
where the 1.5km was chosen as it equalled the model grid spacing.
The spread of the 15 drifter paths are indicative of the uncertainty. Overall, the initial motion is the same for all drifters: south by southwest. However 5 of the drifters are swept back into Monterey bay, the remaining 10 are carried south.
The plot immediatley to the right shows color contours of surface temperature, with the drifter tracks superimposed in black. The plot to the far right shows the individual tracks, with the colors indicating the release time and the letters identifying the release location. Click on the plots to enlarge them.
Return to the AOSN-II Monterey Bay zoom product page for 8 August 2003