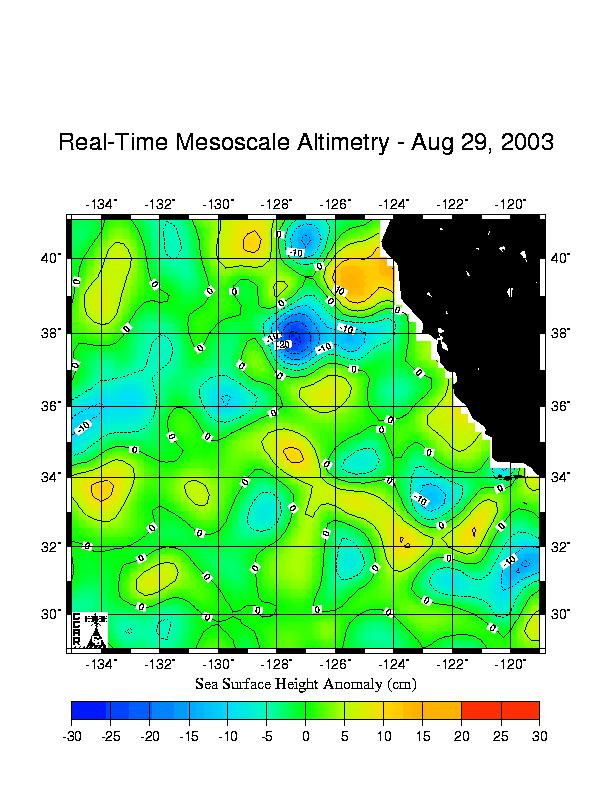
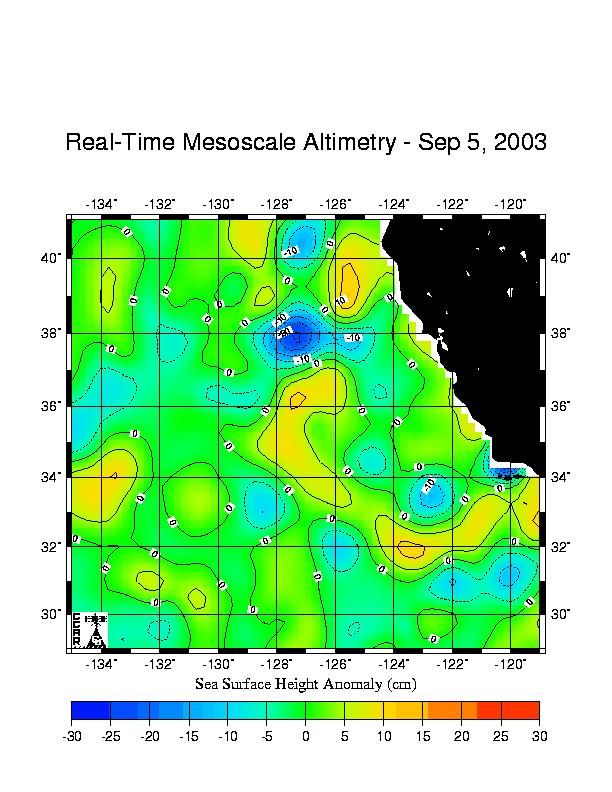
This first set of plots presents a picture of the large region in which AOSN-II is set.
|
|
|
|
|
|
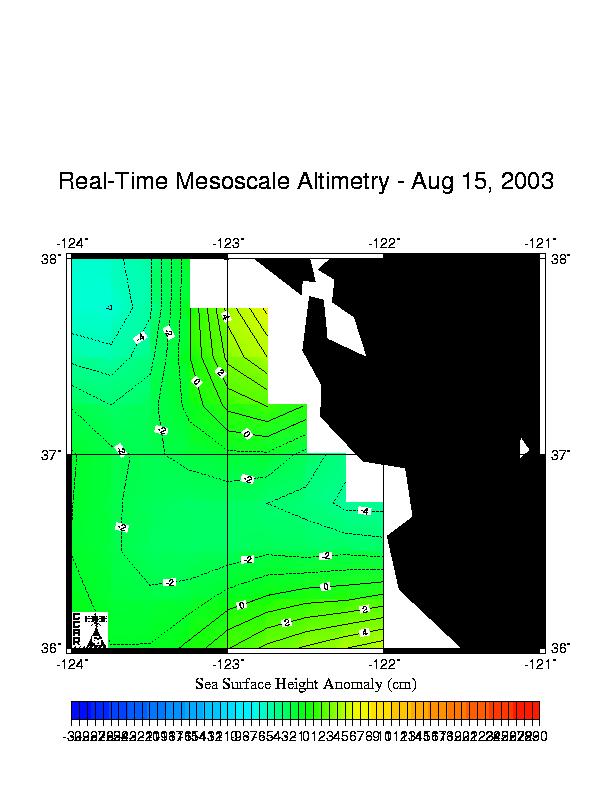
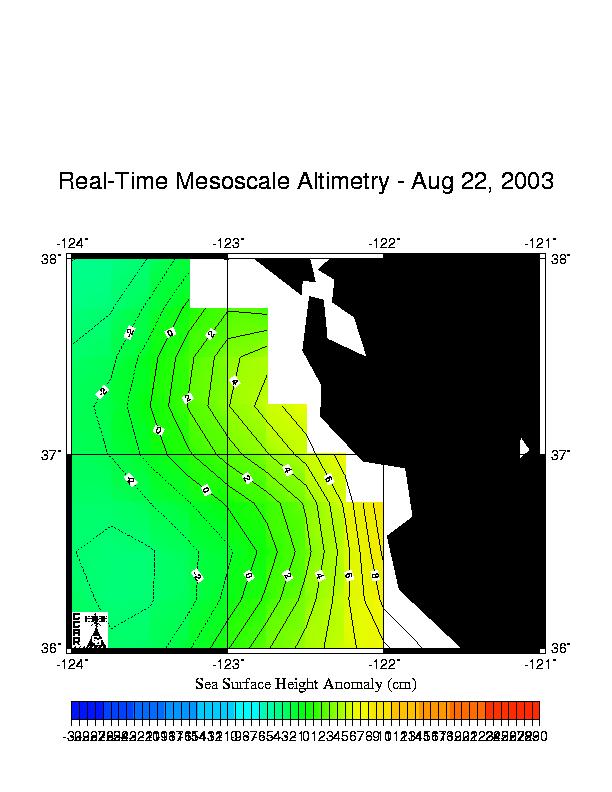
This second set of plots zooms into an area just slightly larger than the HOPS Data Domain for AOSN-II.

|

|
|
|

|

|
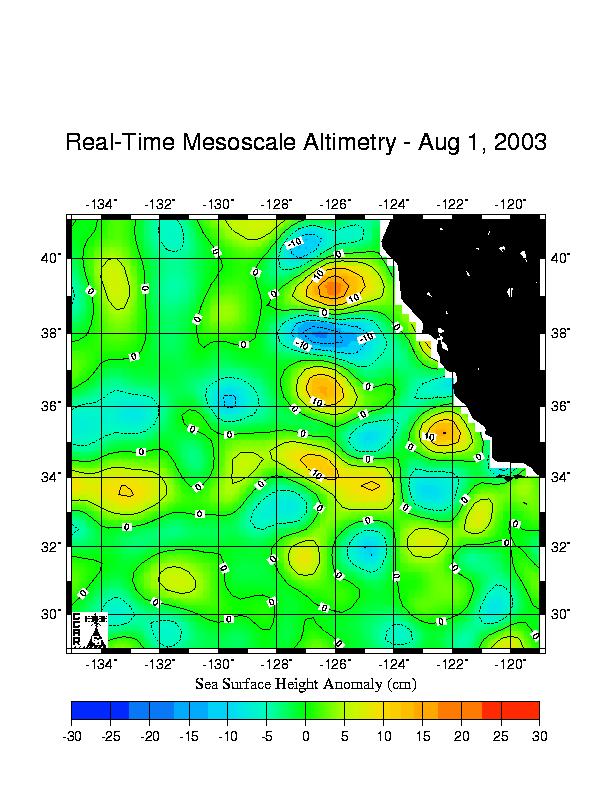
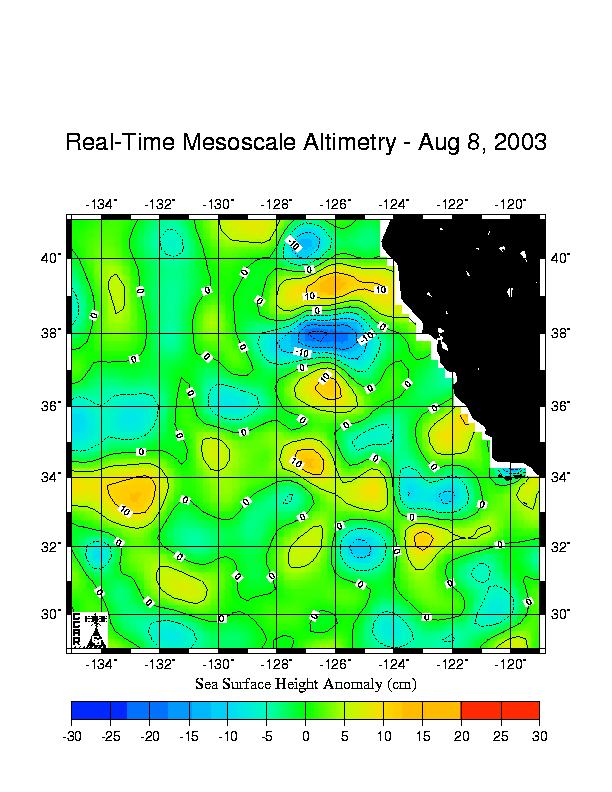
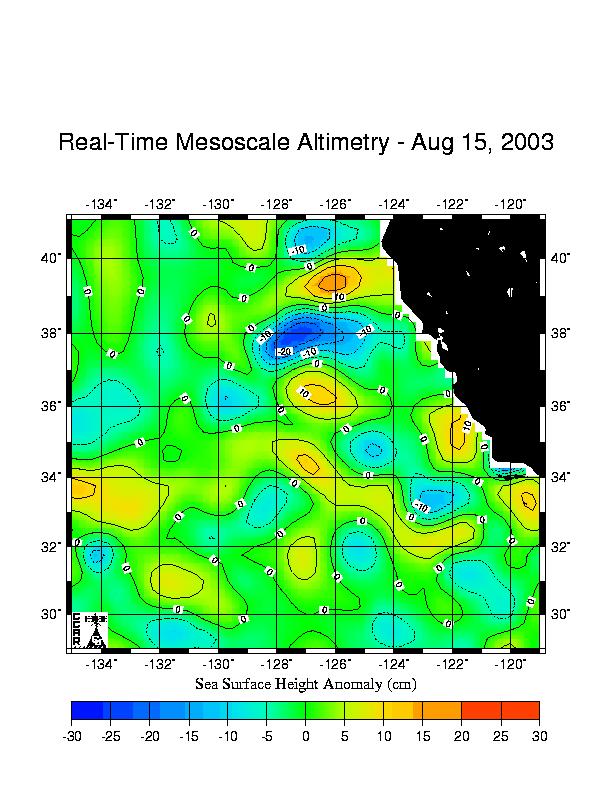
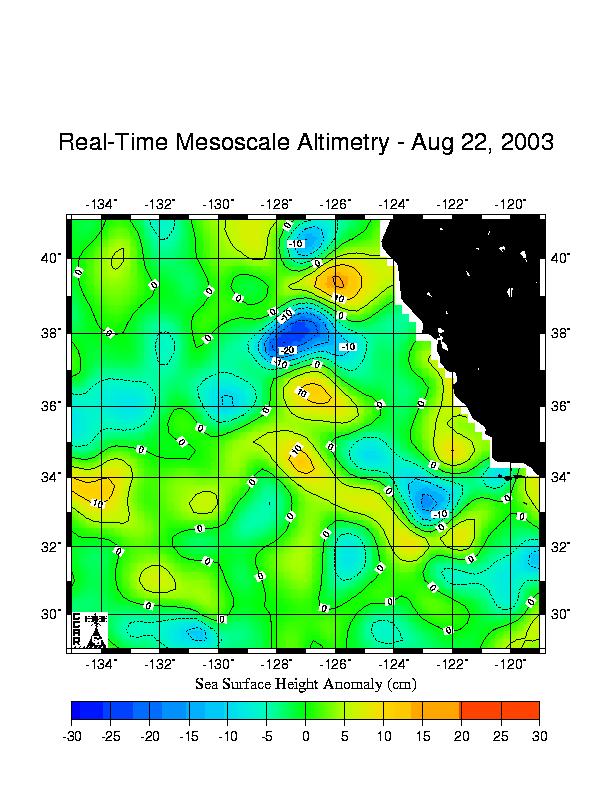
The following plots were acquired from the Colorado Center for Astrodynamics Research altimetry viewer web page (http://www-ccar.colorado.edu/~realtime/gsfc_global-real-time_ssh/). Note that these are plots of SSH anomaly.
From their page: "Welcome to the CCAR Global Near Real-Time Sea Surface Anomly Data Viewer. This page allows you to view maps of the sea surface anomaly for any region in the global ocean (70°S to 70°N latitude). Maps are produced from Jason, TOPEX/POSEIDON(T/P), Geosat Follow-On(GFO) and ERS-2 altimeter data processed in near real-time, usually within 12 to 36 hours of overflight. An analysis product is based on the latest 10 days of Jason and T/P, 17 days of GFO and 35 days of ERS-2 sampling, if available. "
This first set of plots presents a picture of the large region in which AOSN-II is set.
|
|
|
|
|
|
|
|
This second set of plots zooms into an area just slightly larger than the HOPS Data Domain for AOSN-II.
|
|
|
|
|
|
|
|