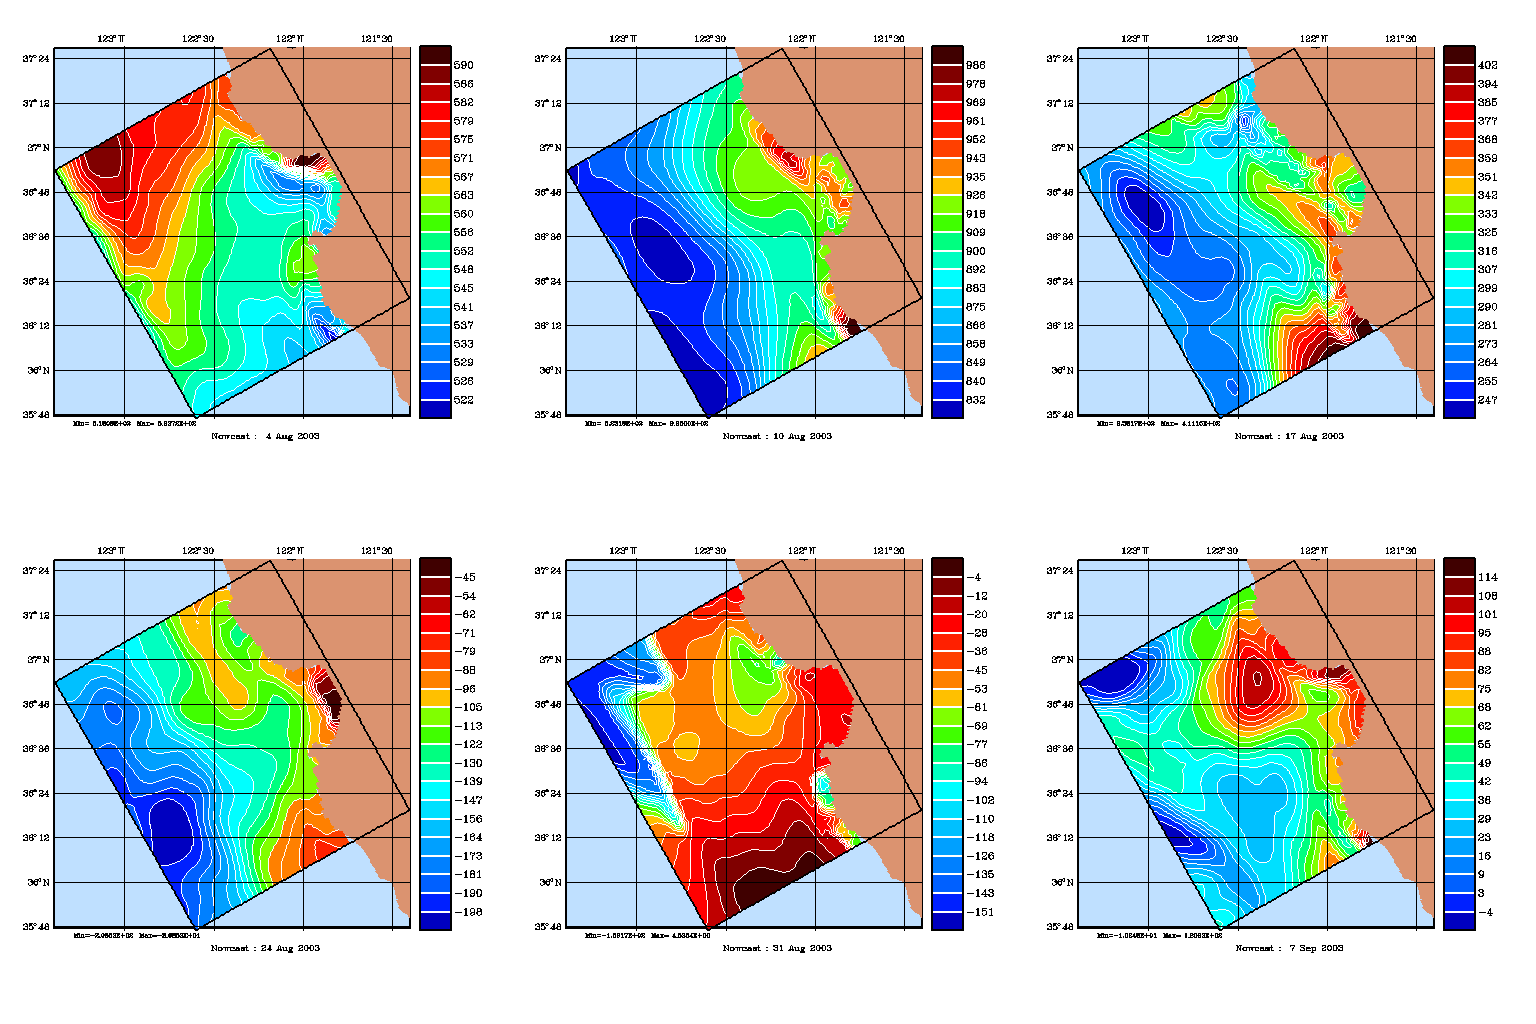
COAMPS analysis and 72 hour forecast fields received from ftp.nrlmry.navy.mil on a twice a day basis were used to generate forcings for AOSN-II HOPS runs. The COAMPS fields were available on four different resolution lambert conformal projection COAMPS grids and included:

|
airtmp_zht (2 m air temperature (C) )
dataht_sfc (data information file)
grdtmp_sfc (surface temperature (K) over land and water)
lahflx_sfc (surface latent heat flux w/m**2)
lndsea_sfc (land sea table - Note that the "water pts=0" and "land pts=1")
lonflx_sfc (longwave radiation at surface w/m**2)
relhum_zht (relative humidity at 2 m per cent)
seatmp_sfc (sea surface temperature)
sehflx_sfc (surface sensible heat flux W/m**2)
slpres_ml (sea level pressure hPa)
solflx_sfc (shortwave radiation at sfc w/m**2)
stresu_sfc (u component of surface stress N/m**2)
stresv_sfc (v component of surface stress N/m**2)
ttlpcp_sfc (total precipitation mm)
uuwind_zht (u component of 10-m wind m/s)
vvwind_zht (v component of 10-m wind m/s)
wstres_sfc (total surface stress N/m**2)
The surface net heat flux [Watt/m^2] was calculated as net = shortwave + longwave + sensible + latent; downward flux is positive, i.e. ocean heating is positive.
The plots are nowcasts at hourly intervals from 4 August - 7 September 2003. Each day begins at 0000Z (1700 PDT). The plots have varying contours of heat flux as constant contours masked all structure.