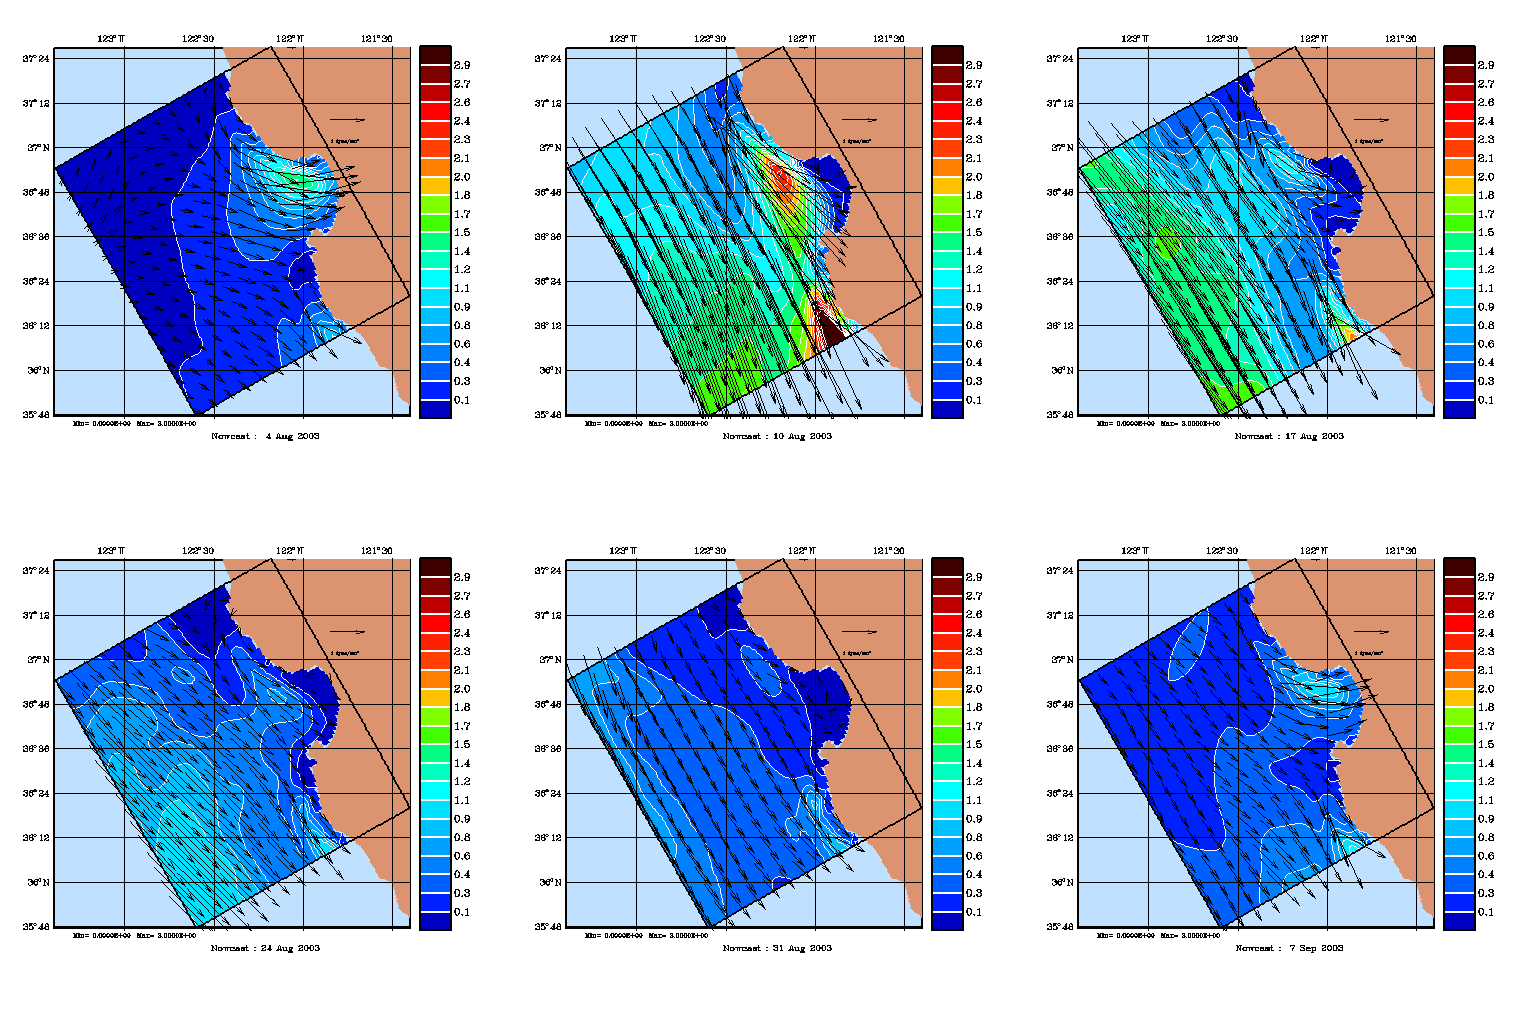
COAMPS analysis and 72 hour forecast fields received from ftp.nrlmry.navy.mil on a twice a day basis were used to generate forcings for AOSN-II HOPS runs. The COAMPS fields were available on four different resolution lambert conformal projection COAMPS grids and included:

|
airtmp_zht (2 m air temperature (C) )
dataht_sfc (data information file)
grdtmp_sfc (surface temperature (K) over land and water)
lahflx_sfc (surface latent heat flux w/m**2)
lndsea_sfc (land sea table - Note that the "water pts=0" and "land pts=1")
lonflx_sfc (longwave radiation at surface w/m**2)
relhum_zht (relative humidity at 2 m per cent)
seatmp_sfc (sea surface temperature)
sehflx_sfc (surface sensible heat flux W/m**2)
slpres_ml (sea level pressure hPa)
solflx_sfc (shortwave radiation at sfc w/m**2)
stresu_sfc (u component of surface stress N/m**2)
stresv_sfc (v component of surface stress N/m**2)
ttlpcp_sfc (total precipitation mm)
uuwind_zht (u component of 10-m wind m/s)
vvwind_zht (v component of 10-m wind m/s)
wstres_sfc (total surface stress N/m**2)
The wind stress forcings for HOPS were the interpolated COAMPS (stresu_sfc,stresv_sfc) fields, scaled to convert from N/m^2 to dyne/cm^2 and rotated for the HOPS grid domain. Special care was taken to resolve the mismatch of HOPS and COAMPS land masks. COAMPS wind stress values are on average order of magnitude higher over the land than over the sea. Hence, land masks mismatch might lead to bogus high values of the wind stress in HOPS near the coasts. Extrapolation from sea values was used to avoid this problem.
The plots are nowcasts at hourly intervals from 4 August - 7 September 2003. Each day begins at 0000Z (1700 PDT). The plots have constant contours of wind stress.