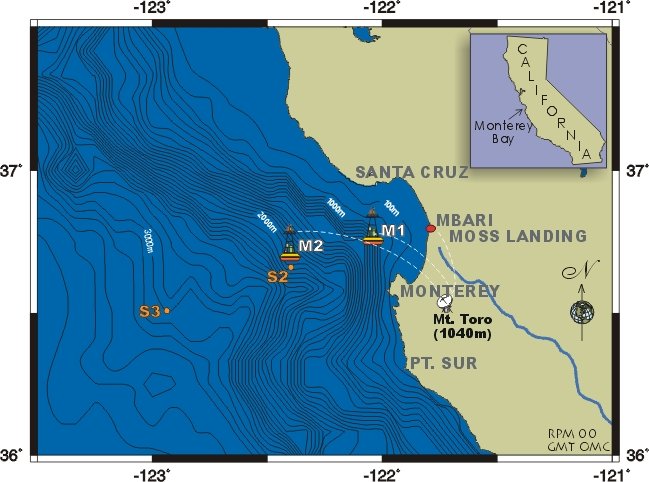
Data from Moorings M1 and M2
The data on this page represents the observations from moorings M1 and M2
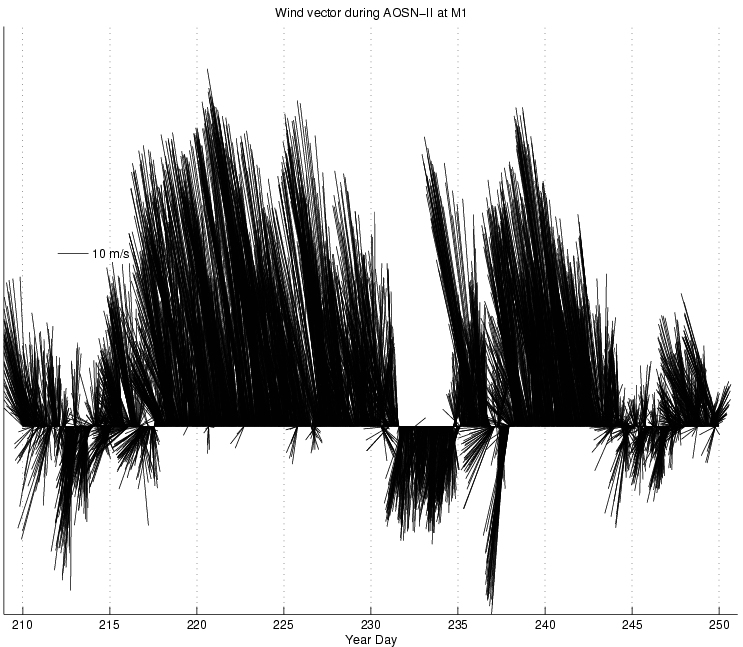
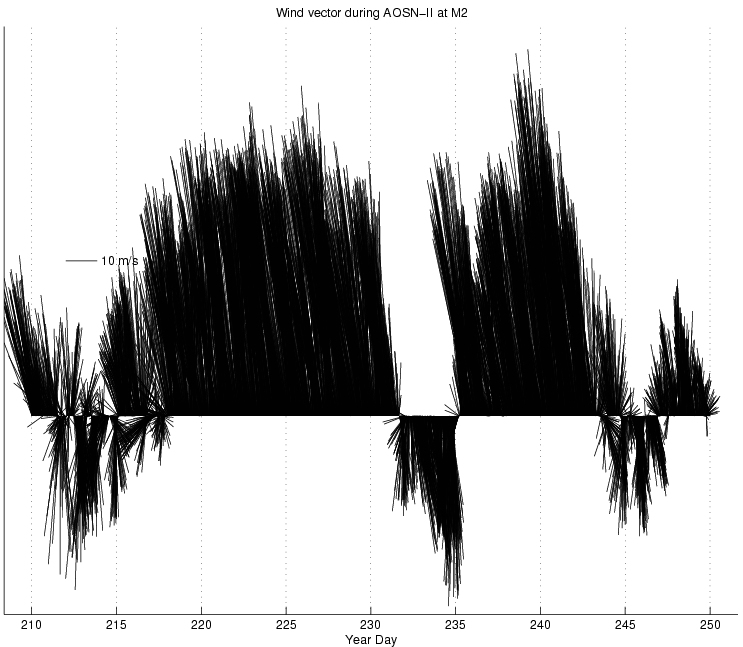
from 29 July - 6 September 2003. The first two plots are the wind vectors
at each mooring. Periods of upwelling favorable and relaxation are clear.
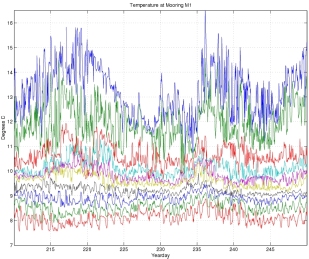
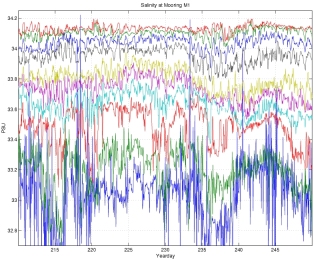
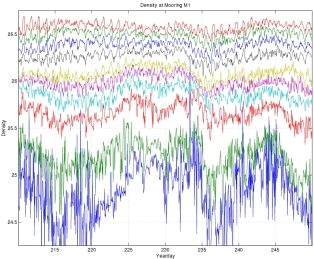
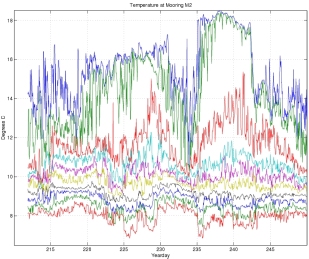
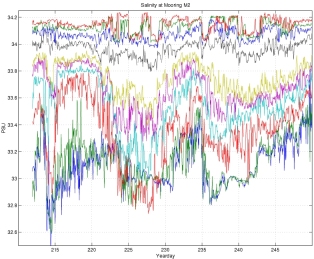
The plots below depict temperature, salinity and potential density at each
of the moorings over the same time period. Responses to changes in wind
forcing are obvious. The scale vector on the wind plots is incorrect. The
maximum wind speeds at the moorings are approximately 27-28 knots.
|
|
| M1 |
M2 |
| 29 July - 6 September 2003 |

|

|
|
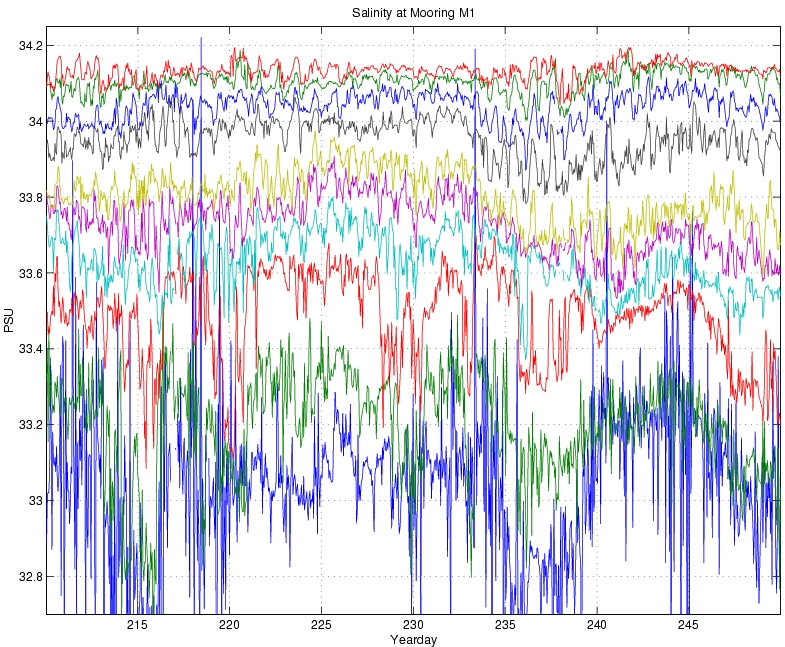
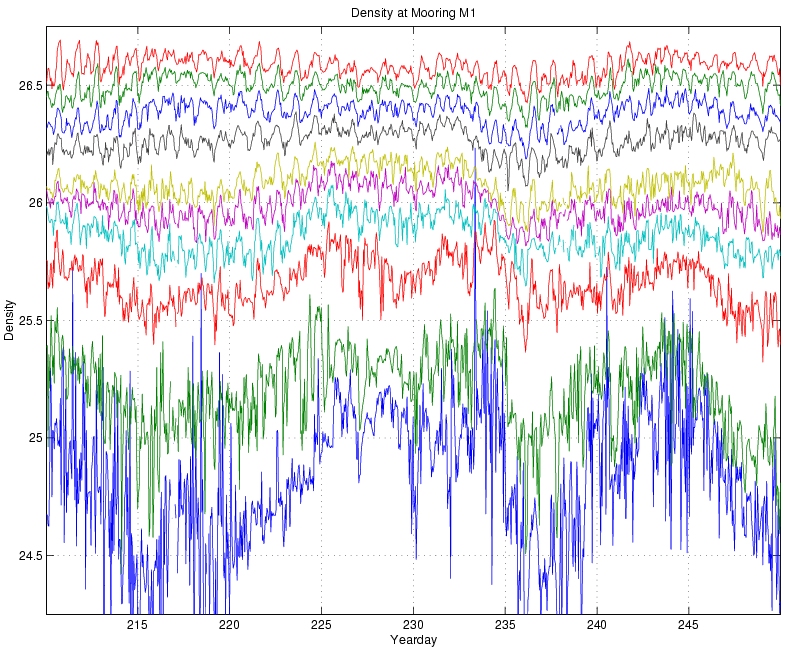
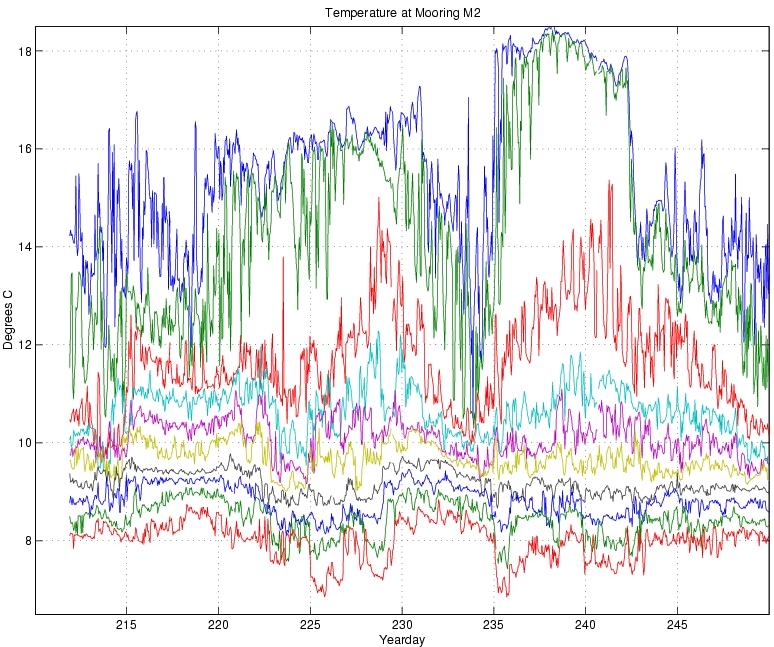
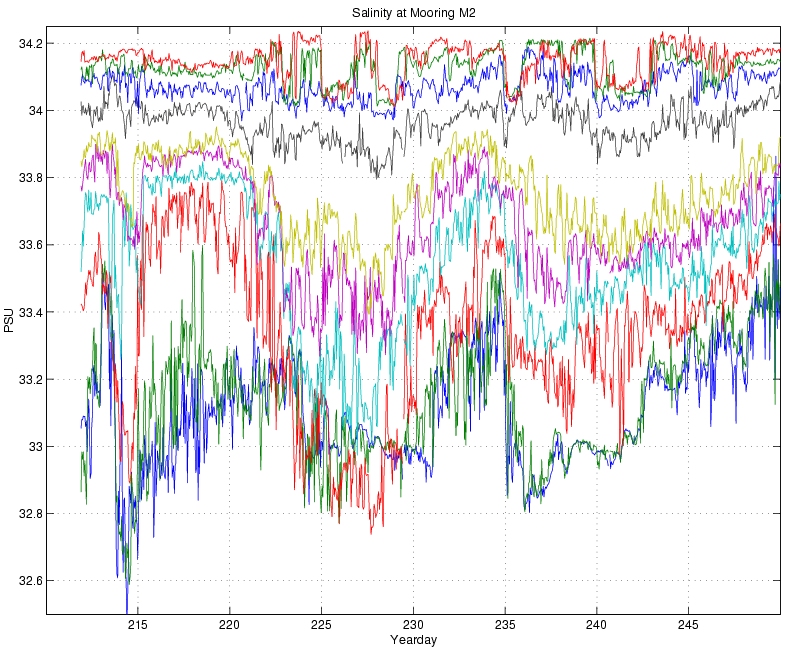
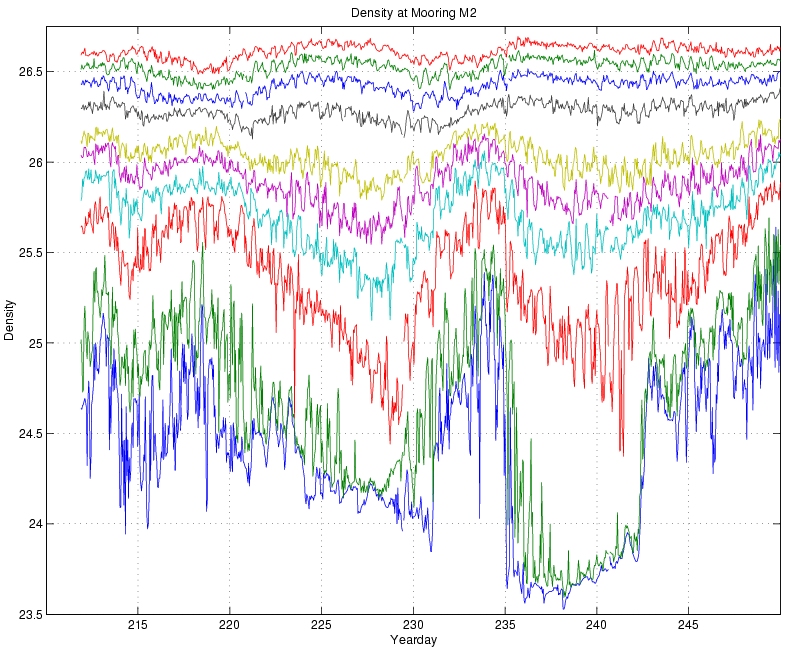
Each of the plots below consists of a time series of a quantity at 10 depths: 10m, 20m, 40m,
60m, 80m, 100m, 150m, 200m, 250m and 300m. The x-axis indicates yearday.
| Temperature |
Salinity |
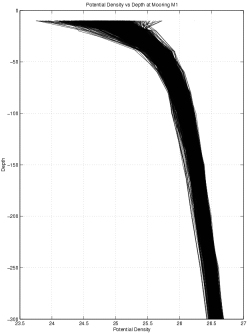
Potential Density |
| 29 July - 6 September 2003: M1 |
|
|
|
| 29 July - 6 September 2003: M2 |
|
|

|
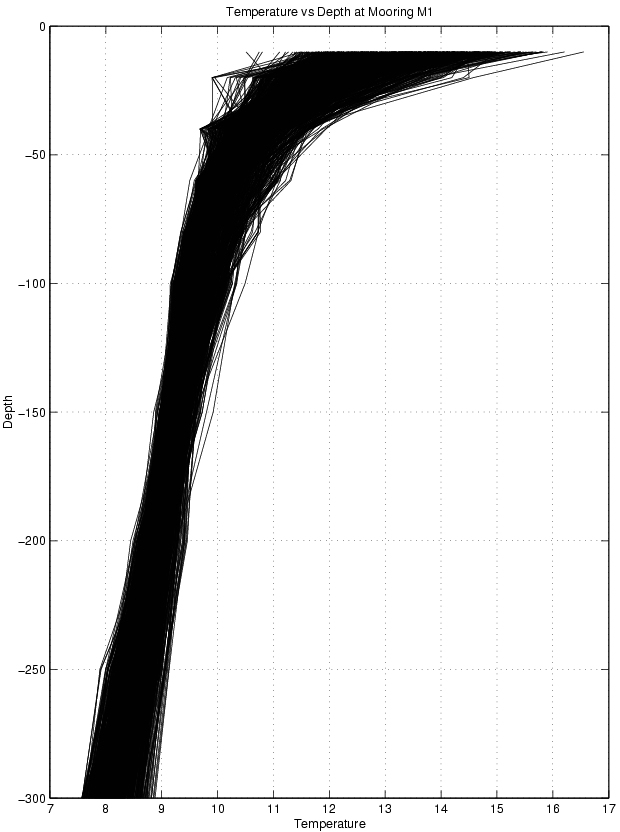
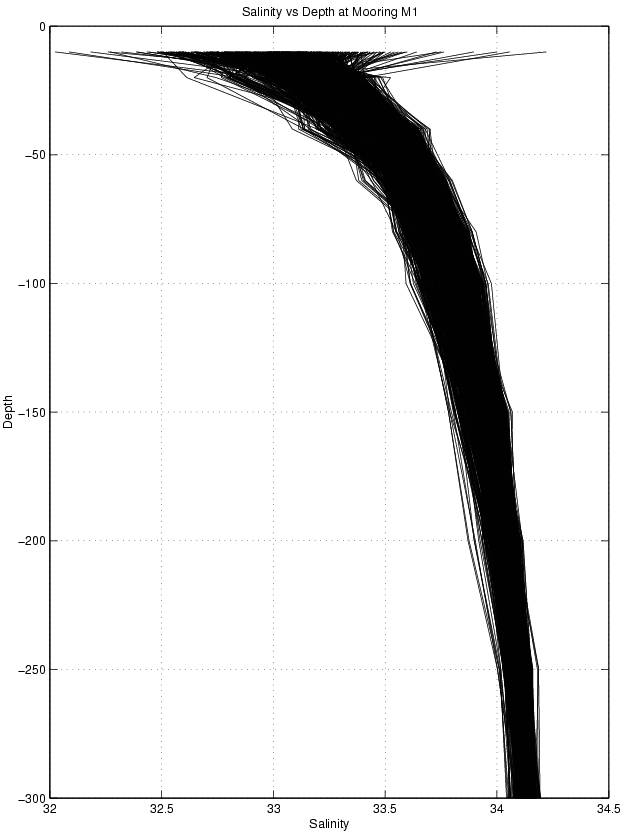
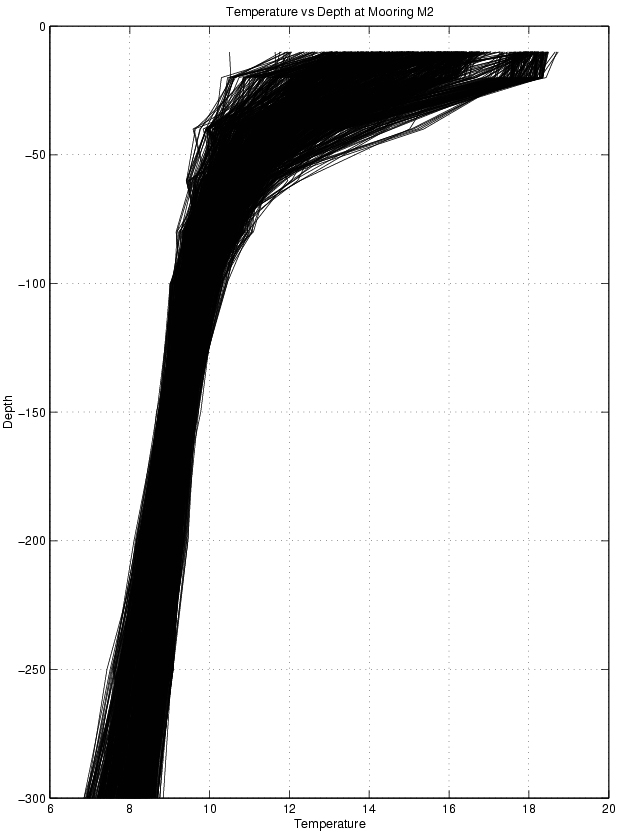
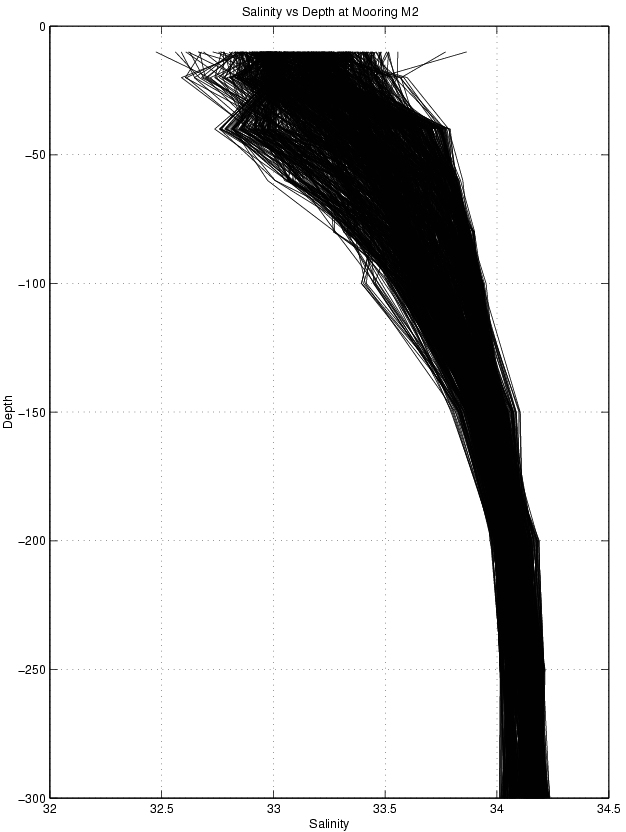
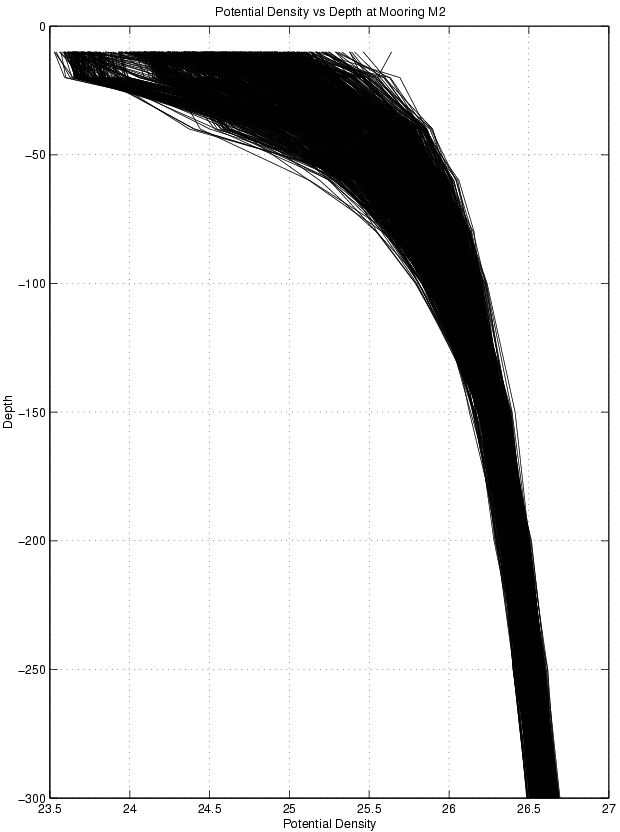
Each of the plots below consists of the time series data above plotted as a series of
vertical profiles. Plotting the data in this fashion provides an indication of the range
of data values at each depth over the course of the experiment.
| Temperature |
Salinity |
Potential Density |
| 29 July - 6 September 2003: M1 |

|

|
|
| 29 July - 6 September 2003: M2 |

|

|

|