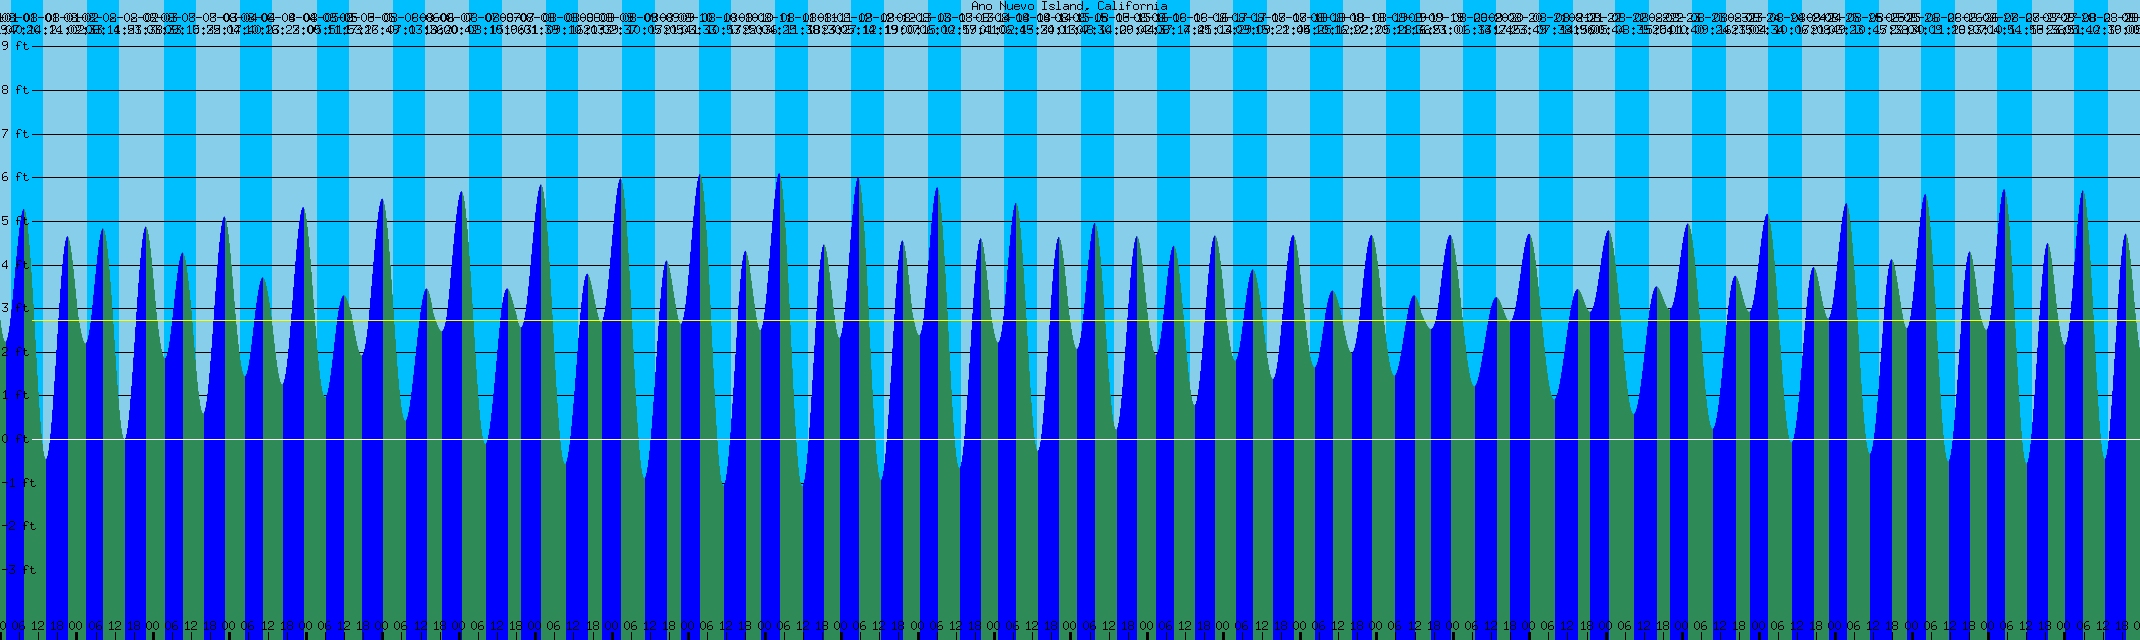
| Ano Nuevo Island |
|
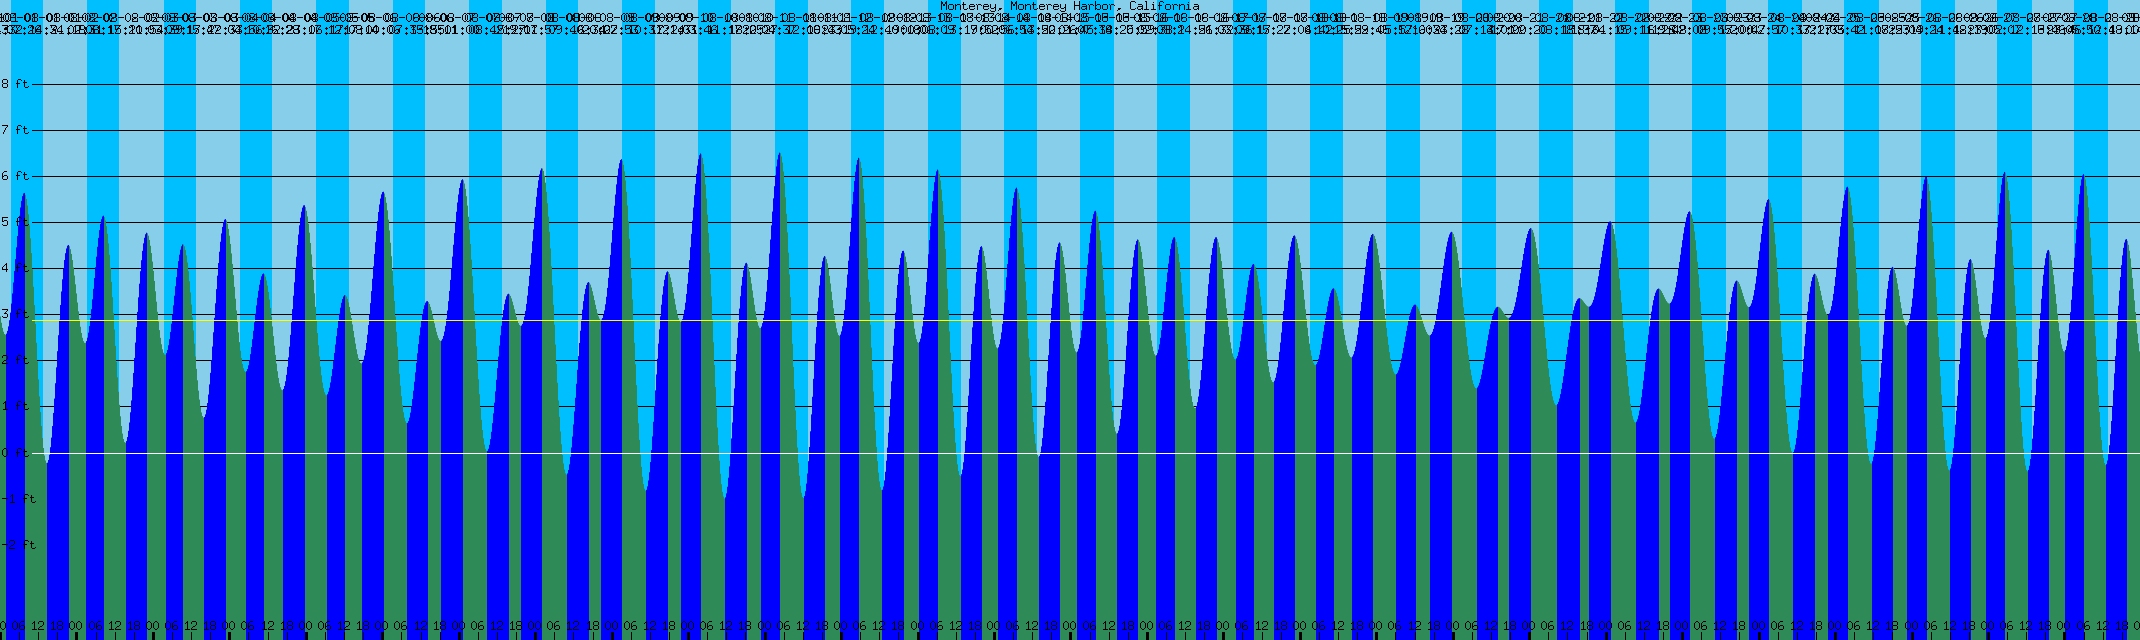
| Monterey Harbor |
|
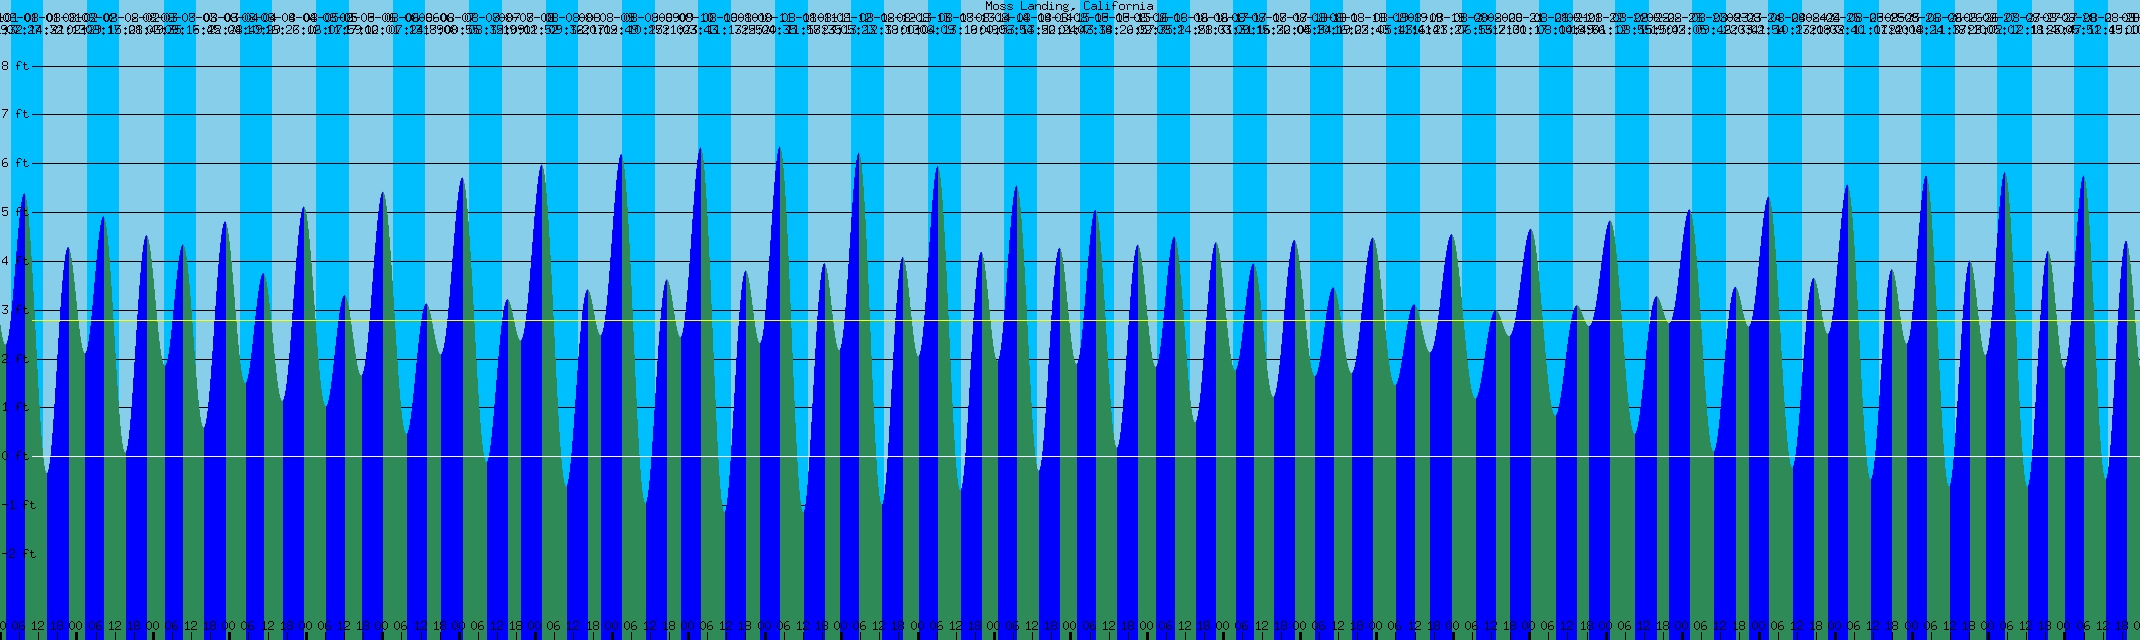
| Moss Landing |
|
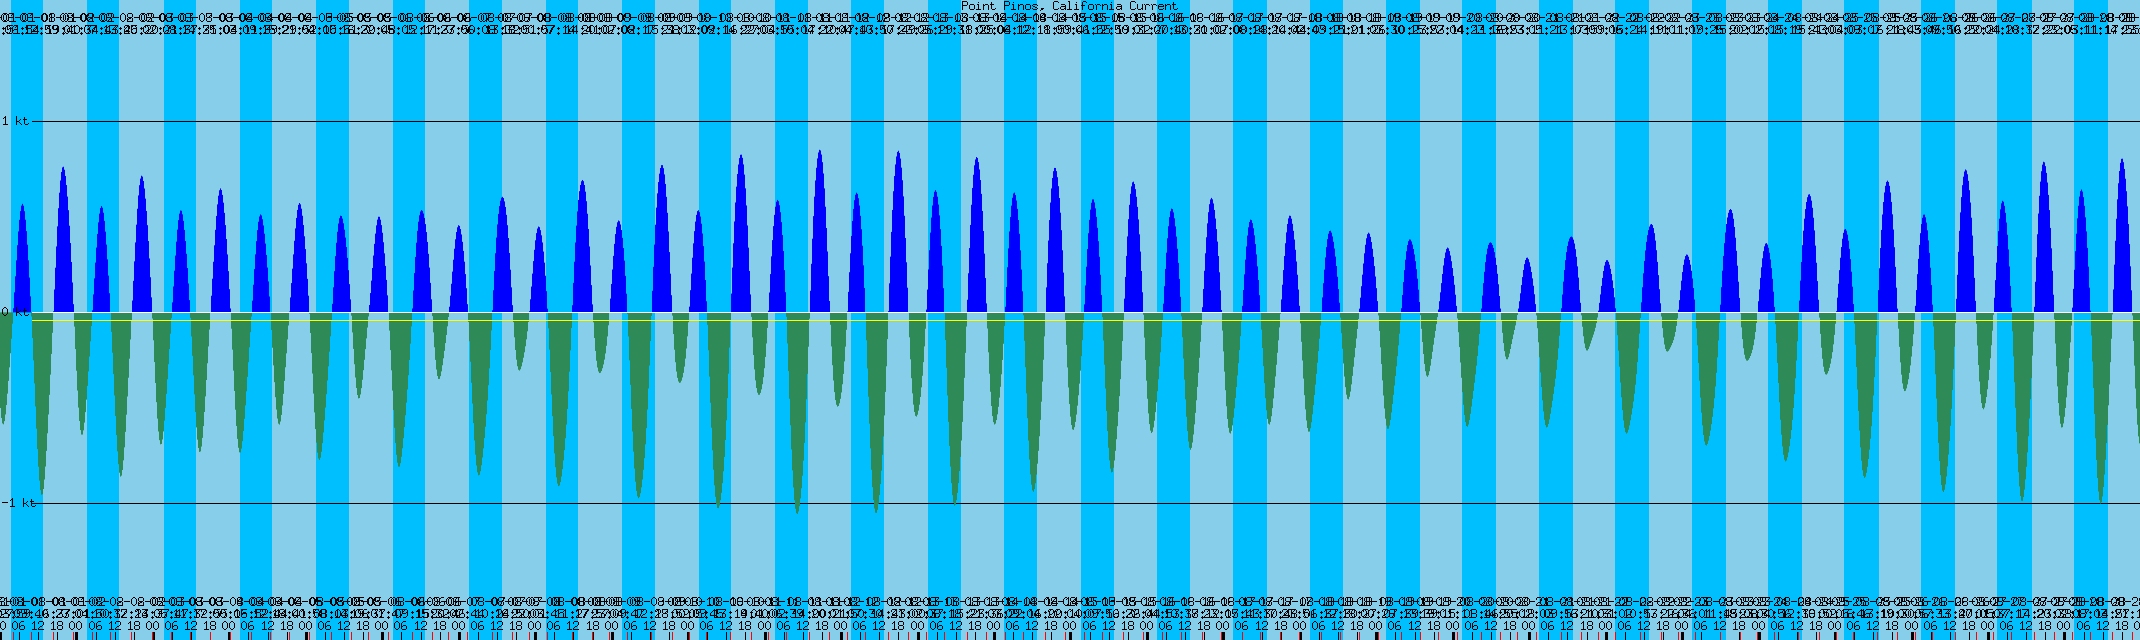
| Point Pinos (Velocity) |
|
The following plots were generated by the WWW Tide and Current Predictor at http://tbone.biol.sc.edu/tide/. These locations chosen are meant to act as examples only. The plots are for a 4 week period beginning at 0Z on 1 August. These are predictions from software, not measurements.
| Ano Nuevo Island |
|
|
| Monterey Harbor |
|
|
| Moss Landing |
|
|
| Point Pinos (Velocity) |
|
|