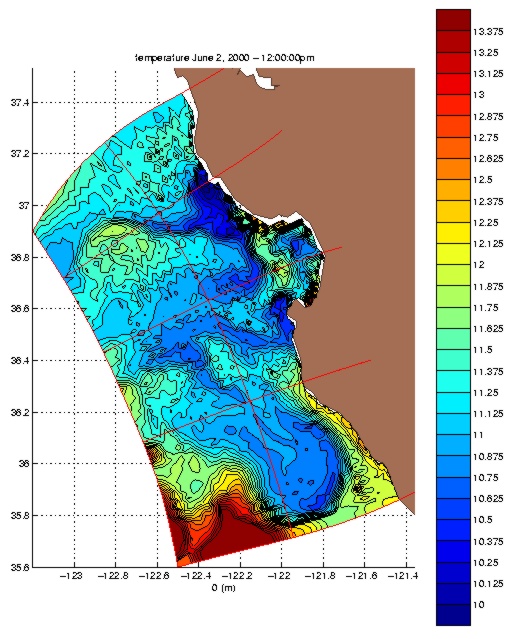
ICON Model Output - Temperature
All ICON output is courtesy of Igor Shulman, Univ. of Southern Mississippi
Contour intervals are fixed for each level over the entire duration of the simulation
Temperature - 0m - June-August 2000
Temperature - 20m - June-August 2000
Temperature - 50m - June-August 2000
Temperature - 100m - June-August 2000
Map of Section Locations
Northern Boundary Temperature Section - June-August 2000
W-E Temperature Section to Point Ano Nuevo - June-August 2000
W-E Temperature Section through M1 - June-August 2000
W-E Temperature Section to Point Sur - June-August 2000
Southern Boundary Temperature Section - June-August 2000
Western Boundary Temperature Section - June-August 2000
N-S Temperature Section through Domain Center - June-August 2000
Temperature June 2000 - 0, 20, 50, 100m
Temperature July 2000 - 0, 20, 50, 100m
Temperature August 2000 - 0, 20, 50, 100m
Movie of temperature evolution - 0m - June-August 2000
Movie of temperature evolution - 20m - June-August 2000
Movie of temperature evolution - 50m - June-August 2000
Movie of temperature evolution - 100m - June-August 2000