full domain
Año Nuevo
domain
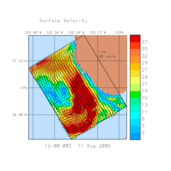
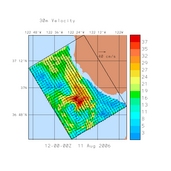
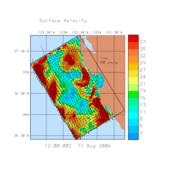
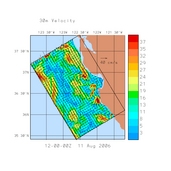
The table below contains links to HOPS output at 1hr resolution during the 2006 ASAP experiment. The files contains velocity data (cm/s) at the following 5 depths
Note: There are two type of output files, with different orientations for the velocity components:
| Plots | NetCDF files | |||
| surface V (6hr) | 30m V (6hr) | |||
| Nested, full domain |
|
|
Along Grid | peMBy_nst_270706_00_260806_19_01h.nc |
| Geographic | peMBy_geo_nst_270706_00_260806_19_01h.nc | |||
| Nested, Año Nuevo domain |
|
|
Along Grid | peAnN_nst_270706_00_260806_19_01h.nc |
| Geographic | peAnN_geo_nst_270706_00_260806_19_01h.nc | |||
The file names can be interpreted as follows:
 domain  start time           output frequency
  vvv     ddmmyy hh           hh
peAnN_nst_270706_00_260806_19_01h.nc
      ^^^           ddmmyy hh
   nest flag        end time
where nst indicates output from a nested run and sa indicates output from a non-nested (stand-alone) run.
To help extract data from these files in Matlab, we include the function readhopspe.m. To use this function, you'll also need to download
        /matlab/toolbox/local/mexnc
        /matlab/toolbox/local/netcdf_toolbox/netcdf
        /matlab/toolbox/local/netcdf_toolbox/netcdf/ncutility
        /matlab/toolbox/local/netcdf_toolbox/netcdf/nctype