(1.09Gbyte)
(1.09Gbyte)
(1.10Gbyte)
(1.10Gbyte)
| Domain | Tracer Fields | Velocity Fields |
| 0.5km Ano Nuevo | TSCanonuevo.nc (1.09Gbyte) |
Vanonuevo.nc (1.09Gbyte) |
| 1.5km AOSN-II | TSCaosnii.nc (1.10Gbyte) |
Vaosnii.nc (1.10Gbyte) |
| Contents | ||
| Temperature | Horizontal Velocity | |
| Salinity | Vertical Velocity | |
| Sound Speed | ||
| Domains | ||
|
| ||
To the right are outputs files of the Harvard Ocean Prediction System which can be used for a PLUSNet Virtual Ocean Environment. The ocean model utilized is a Primitive-Equation model. It is driven by atmospheric forcing and by in situ and remotely sensed ocean data collected during the AOSN-II exercise in Monterey Bay in August 2003.
The output files contain the hourly output of a 27 day (6 August 2003 at 00:00:00Z through 02 September 2003 at 00:00:00Z), two-way nested simulation of the 2003 AOSN-II experiment, forced with COAMPS atmospheric fluxes and the OTIS tidal fields over high-resolution topography. The format is NetCDF.
The table to the right also indicates the approximate size of each file and its contents. Both environmental fields and current fields are provided. This two-way nested ocean model output covers the two domains outlined in green in the figure to the right. In such a two-way nested simulation, the same ocean model is run simultaneously over each of the two domains with different resolution. The two runs exchange information at each time step, in two-ways: (i) the larger coarser AOSN-II domain provides boundary information to the smaller finer Ano Nuevo domain, and (ii) the high-resolution run in the Ano Nuevo domain feedbacks its fields to the larger coarser AOSN-II domain. The geometric parameters of the two nested model domains are:
To read/interpolate these fields in Matlab we also provide the script readhopspe.m. This script is based on the NetCDF Toolbox written by Chuck Denham. The script readhopspe allows the user to control the vertical extrapolation. When two telescoping nested domains are provided as inputs (for example, in this case, the Ano Nuevo and AOSN-II netcdf files), it automatically reads the two input files and selects the most accurate data from the two domains: i.e. it uses the finer resolution run for data requests of positions in the finer domain and the coarser resolution run for positions outside of the finer domain. A detailed description on the use of this readhopspe.m script is included in the comments in the top of the script.
To carry-out acoustic-related simulations in a set of environments representative of the various likely conditions in August 2006, an interesting strategy would be to sample each of the main states through which the ocean environment evolved during August 2003. These states can be roughly described as:
| Upwelling Favorable | August 6 → August 8, 2003 |
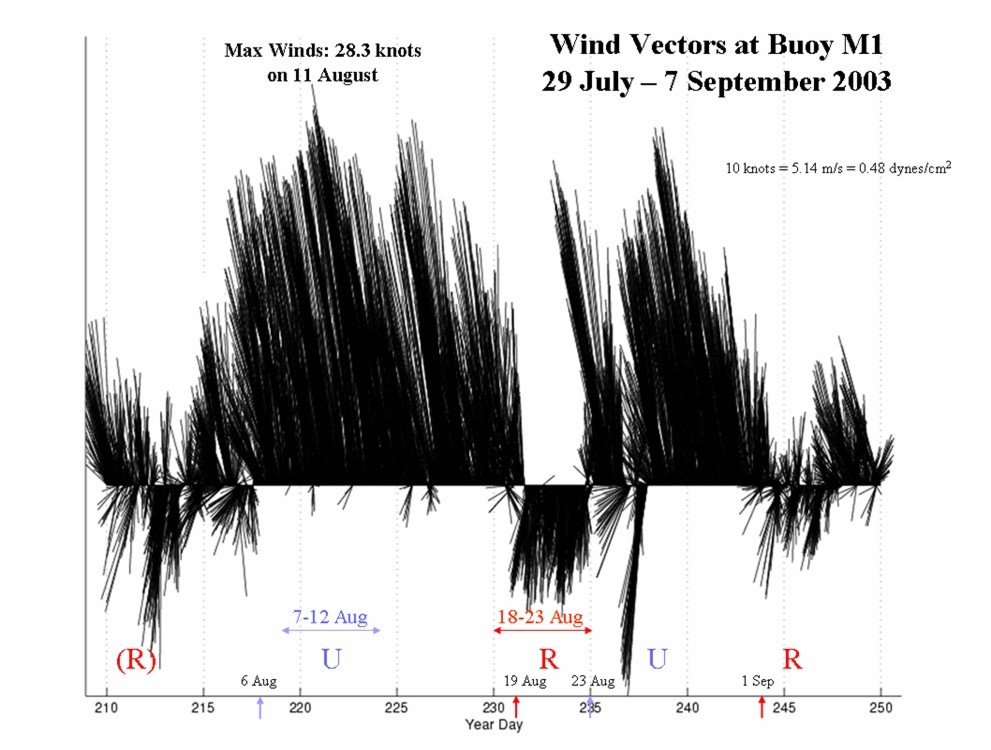 |
| Sustained Upwelling | August 9 → August 18, 2003 | |
| Relaxation | August 19 → August 23, 2003 | |
| Upwelling Favorable | August 24 → August 25, 2003 | |
| Upwelling | August 26 → September 1, 2003 | |
| Relaxation | September 2 → Onward |