

AFMIS

|
|

|
Nested Forecast Results (9-12 April 2000)
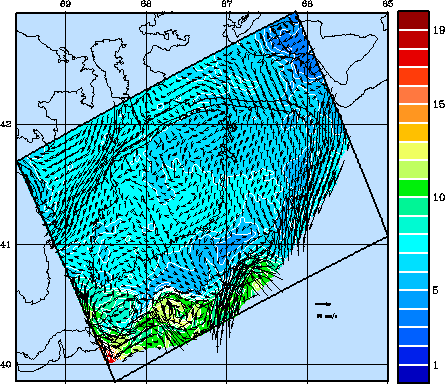
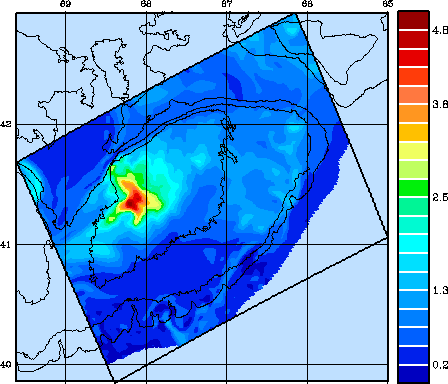
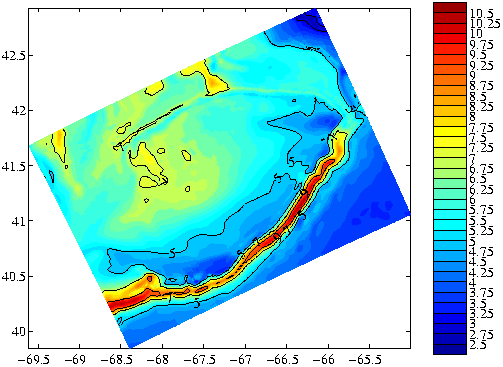
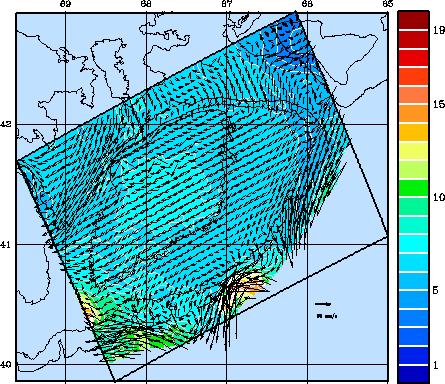
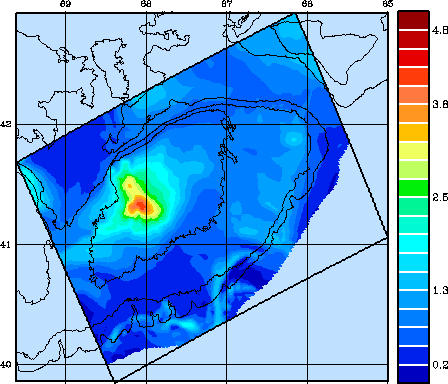
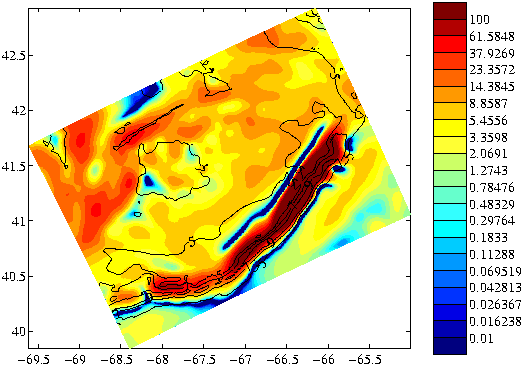
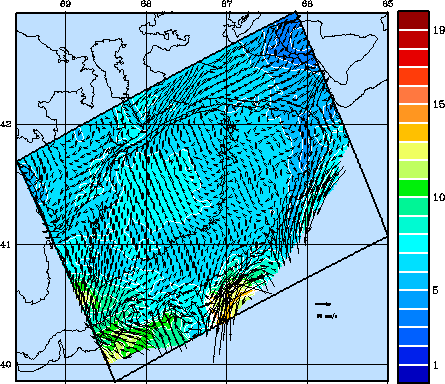
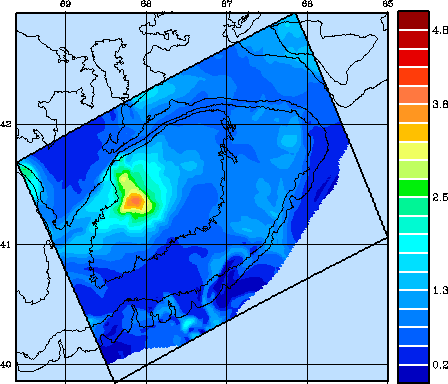
A real-time forecast for the period April 9-12, 2000 in the Georges Bank domain is demonstrated in the following figure with plots from April 9, April 11 and April 12. The left-hand column contains color contours of the temperature at a depth of 5 meters with superimposed velocity vectors. The middle column shows the value of chlorophyll at a depth of 20 meters. The top panel of the right-hand column is bottom temperature for April 9. The remainder of the right-hand column depicts relative Cod abundance with overlying contours of bottom temperature.
|
|
|
|
|
|
|
April 9, 2000
|
|
|
April 11, 2000
|
|
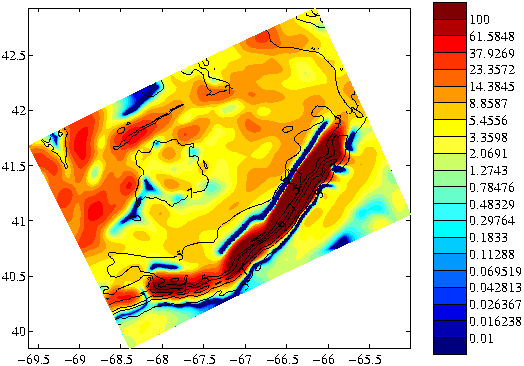
|
April 12, 2000