

AFMIS

|
|

|
Nested Forecast Results (26 March - 2 April 2000)
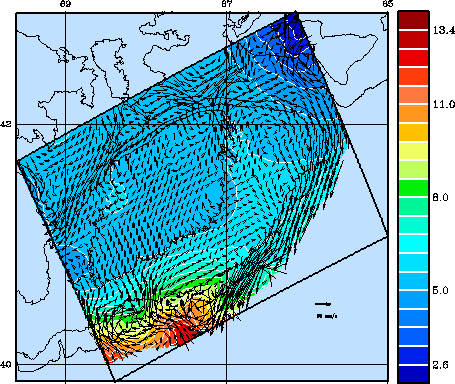
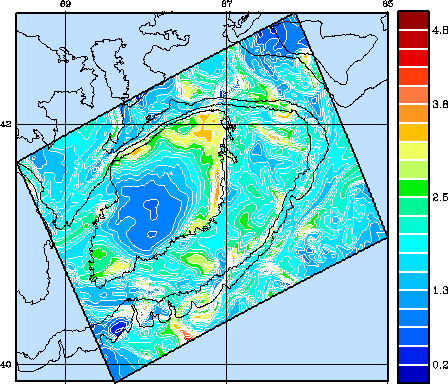
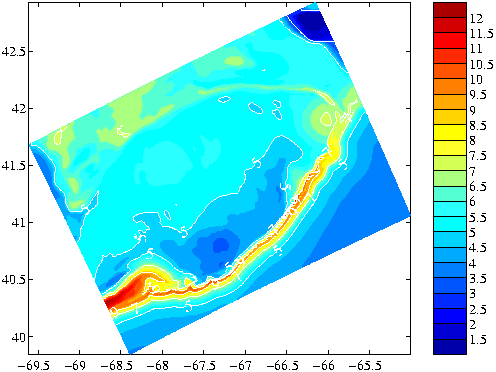
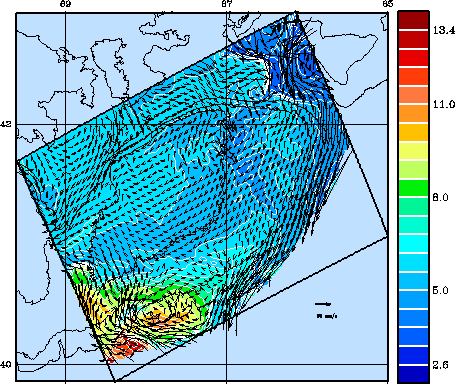
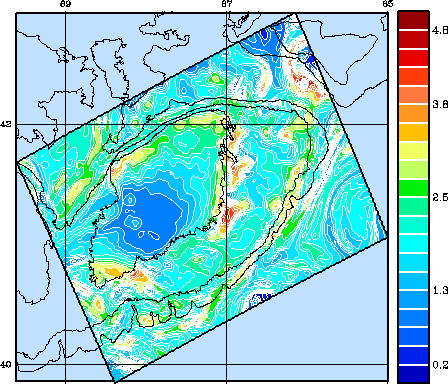
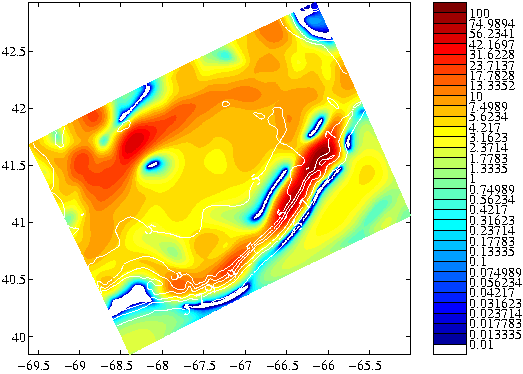
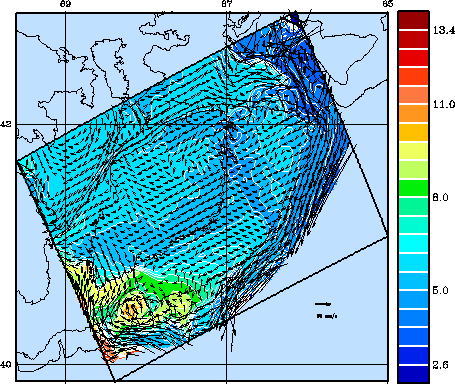
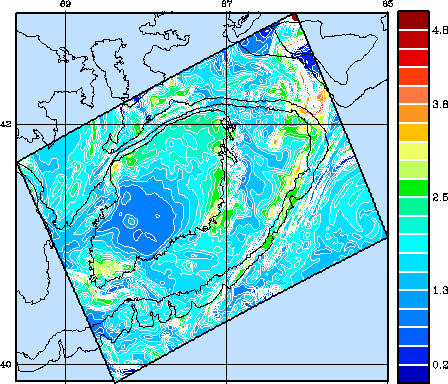
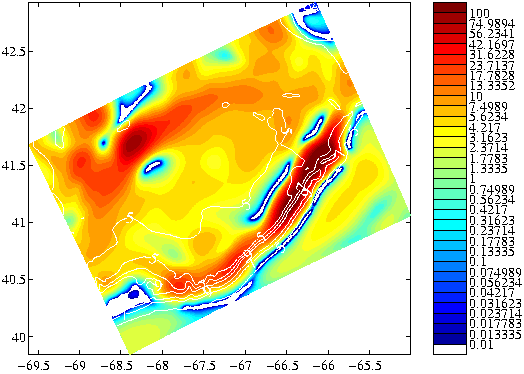
A real-time forecast for the period March 26 - April 2, 2000 in the Georges Bank domain is demonstrated in the following figure with plots from March 26, March 31 and April 2. The left-hand column contains color contours of the temperature at a depth of 5 meters with superimposed velocity vectors. The middle column shows the value of chlorophyll at a depth of 20 meters. The top panel of the right-hand column is bottom temperature for March 26. The remainder of the right-hand column depicts relative Cod abundance with overlying contours of bottom temperature.
The coupled physical/biological simulatioin is initialized with data from March 1998 and assimilates synoptic data from February 2000 and sea surface temperature (from AVHRR) for March 26, 2000. Surface forcing is from FNMOC; analyses from 24-27 March, with forecasts for the remaining period. In this simulation, Cod aggegrates in the southern slopes of Georges Bank and in the northwest corner in response to physical environmental conditions (temperature and advection).
|
|
|
|
|
|
|
March 26, 2000
|
|
|
March 31, 2000
|
|
|
April 2, 2000