

AFMIS
|
|
|
|
Georges Bank: April-May 2000
4 - 12 May 2000 GB Simulation (
Issued 10 May)Forecast description
The following pages present a coupled physical/biological(N-P-Z)/Cod simulation (with tides) which has produced a real-time nowcast and forecast for Georges Bank, including the effects of the assimilation of sea surface temperature (SST) and sea surface color (SSC) data. The product package includes daily maps of surface temperature (° C) with superimposed vectors of sub-tidal velocity; chlorophyll at 15m (m g/L); bottom temperature (° C) with superimposed vectors of sub-tidal velocity; and, Cod abundance (non-dimensional units, logarithmic scale) at the bottom. Additional forecast tendency products (change in a quantity from the nowcast day to the specific forecast day) are now included. This simulation was launched on Monday 8 May. There is no remotely sensed or real-time in situ data available to be included in the assimilation process for this simulation. The simulation includes the effects of previously assimilated remotely sensed data.
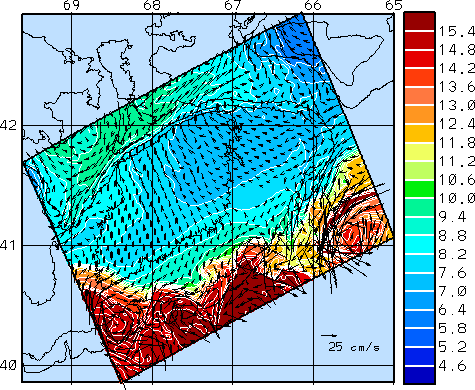
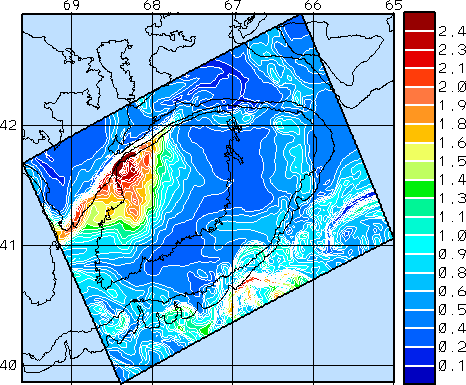
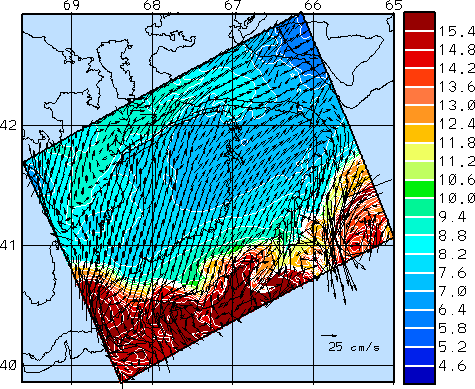
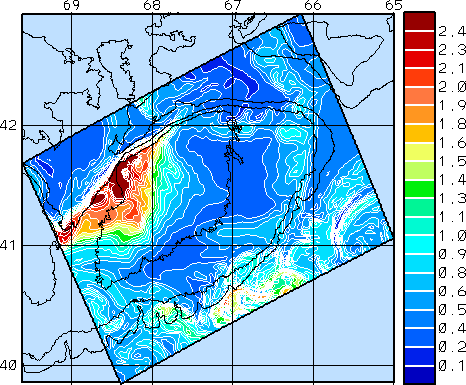
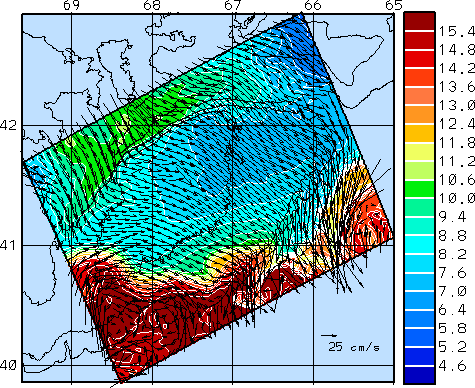
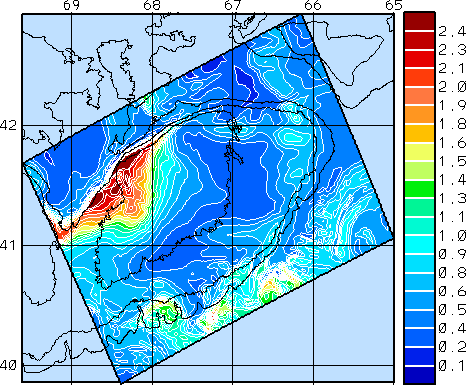
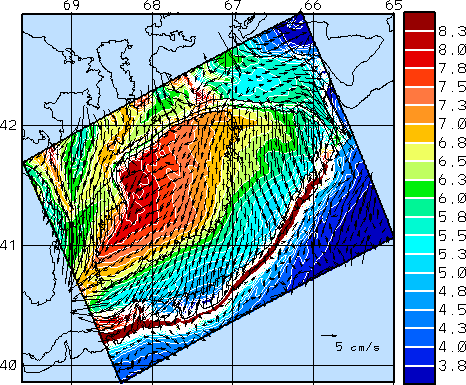
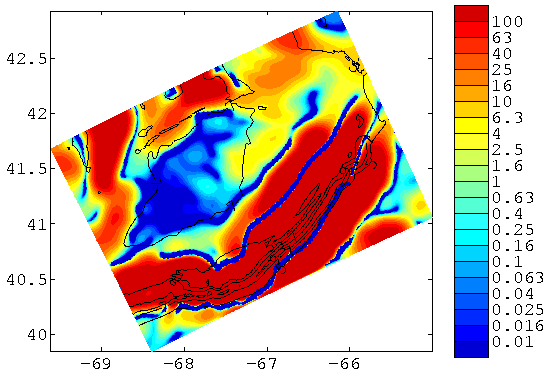
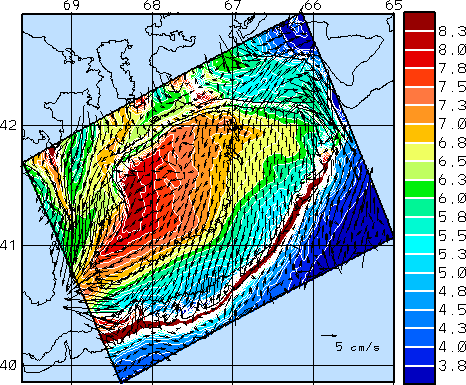
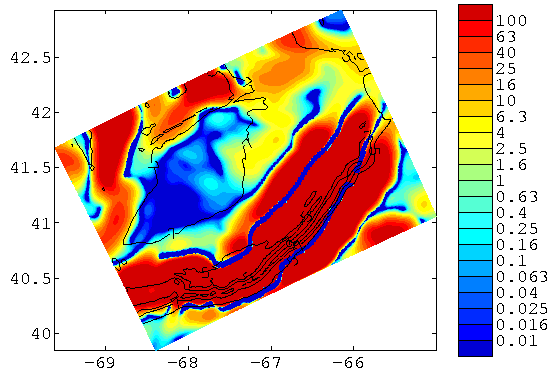
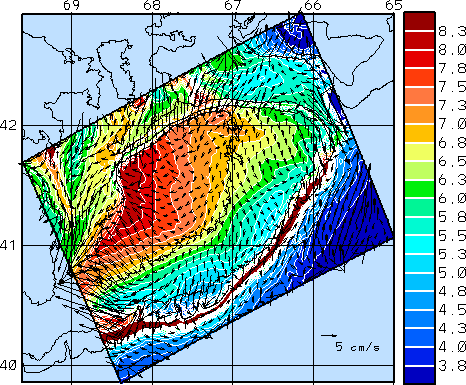
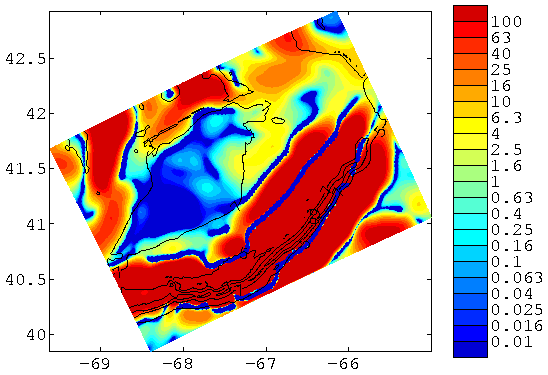
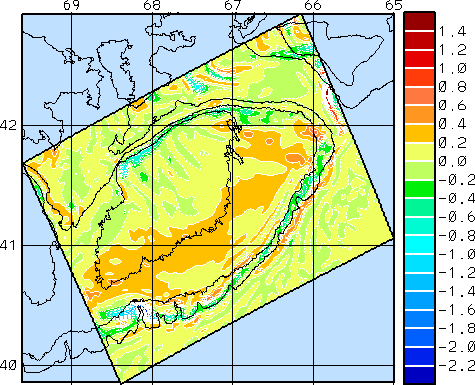
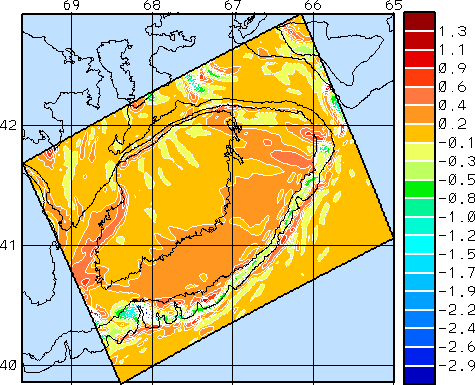
The figures presented here are a representation of the daily conditions of the domain. As noted above, the calculation includes the effects of tides (mixing, advection, etc.) but the tides have been removed (hence the use of the term sub-tidal) in order to have a better representation of the flows on a daily basis. The maps, which include velocity vectors, are presented so that the main quantity is depicted with color shading and white contours. Velocity vectors are superimposed and scaled according to a scale vector located in the lower right corner of the frame. Axes of each frame are in degrees west longitude and degrees north latitude. Note that the color bars for the forecast evolution plots vary from frame to frame.
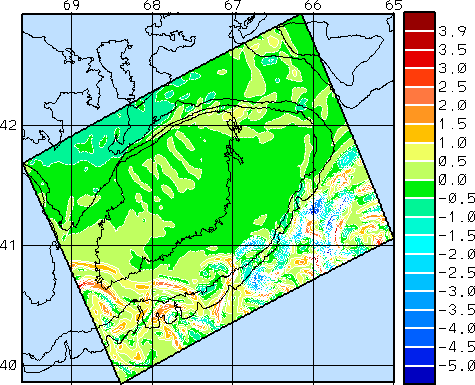
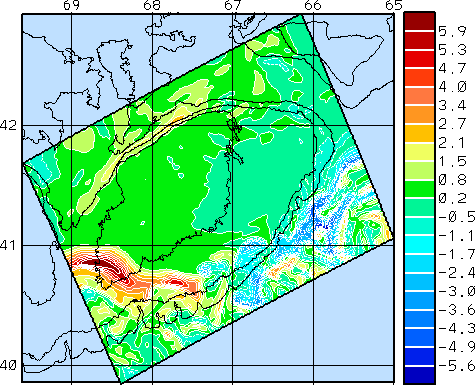
Discussion for 10-12 May 2000
As a result of relatively calmer winds during the initial part of the simulation period, a relatively classic buoyancy driven circulation is present at the surface on May 10 (the nowcast), except in the northeastern portion of Georges Bank, where the surface flow is weak and to the east-northeast. Note that in the nowcast field, several eddies, filaments and deep-socks continued to be formed along the shelf-break front (see forecast tendencies), closely following the curving border of Georges Bank (compare with the previous product of 8-9 May). Inside Georges Bank, the surface flow is weak and mainly to the north. It is later forecast to vary, primarily as a function of wind forcing. A storm of medium strength is forecast to pass over the domain on May 11 and May 12, leading to the variations in surface current. On May 12, notice the general warming trend on the northern edge of and to the north of Georges Bank. The apparent warming in the forecast tendency field on the southwestern corner of Georges Bank is due to a shift in frontal position.
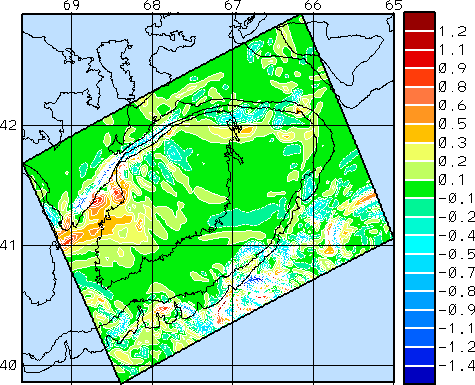
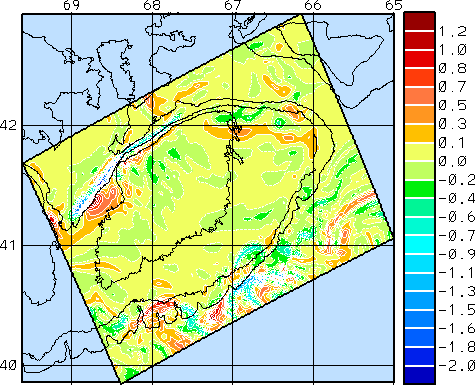
Chlorophyll at 15m is dominated by highest values on the northwestern corner of Georges Bank. In addition, there are chlorophyll patches in the filaments of the shelf-break front. Chlorophyll variation is generally small during the simulation period, although there is an increase in the strength of the major patch and some reduction in values along the 100m isobath. Over Georges Bank, bottom temperature shows highest values over the northwestern portion. Bottom temperature evolution is notable for general warming during the forecast period (e.g. from 0.2 to 0.4° C in most locations between the 60m and 100m isobaths over the two-day period, see tendencies). Cod abundance is designed to follow the tendency of Cod to be attracted to the 5° C isotherm. Patterns have remained similar to what they were before.
Forecast methodology
Each simulation runs for seven days. Products are issued on Monday and Wednesday of each week. A Monday product includes a nowcast and one day of forecast. A Wednesday product includes a nowcast and two days of forecast. Nominally, SSC is assimilated for the first 2 days of each simulation, and SST is assimilated for the second and third days. If not available, the last available data is assimilated. FNMOC atmospheric forcings are utilized on a twice-daily basis throughout the simulation with analyses used where possible and forecasts thereafter. The initialization field for each simulation is a restart from the previous week's simulation. Forecasts for Monday-Tuesday are initialized from the Tuesday fields of the previous Wednesday-Friday forecast period, while forecasts for Wednesday-Friday are initialized from the Friday fields of the previous Monday-Tuesday forecast period.
Nowcast - May 10, 2000
|
|
|
|
|
____________________________________________________________
Forecast - May 11, 2000
|
|
|
|
|
____________________________________________________________
Forecast - May 12, 2000
|
|
|
|
|
Nowcast - May 10, 2000
|
|
|
|
|
____________________________________________________________
Forecast - May 11, 2000
|
|
|
|
|
____________________________________________________________
Forecast - May 12, 2000
|
|
|
|
|
Forecast Tendency - Surface Temperature
|
|
|
|
|
____________________________________________________________
Forecast Tendency - Chlorophyll at 15m
|
|
|
|
|
____________________________________________________________
Forecast Tendency - Bottom Temperature
|
|
|
|
|
The Advanced Fisheries Management Information System (AFMIS) is intended to apply state-of-the-art multidisciplinary and computational capabilities to high-frequency operational fisheries management. The system development is aimed toward: 1) utilizing information on the "state" of ocean physics, biology, and chemistry; the assessment of spatially-resolved fish-stock population dynamics and the temporal-spatial deployment of fishing effort to be used in the operational management of fish stocks; and, 2) forecasting and understanding physical and biological conditions leading to recruitment variability. Systems components are being developed in the context of using the Harvard Ocean Prediction System to support or otherwise interact with the: 1) synthesis and analysis of very large data sets; 2) building of a multidisciplinary multiscale model (coupled ocean physics/N-P-Z/fish dynamics/management models) appropriate for the northwest Atlantic shelf, particularly Massachusetts Bay and Georges Bank; 3) the application and development of data assimilation techniques; and, 4) with an emphasis on the incorporation of remotely sensed data into the data stream.
AFMIS is designed to model a large region consisting of most of the Northwest Atlantic (NWA). Several smaller domains, including the Gulf of Maine (GOM) and Georges Bank (GB) are nested within this larger domain. This provides a capability to zoom into these domains with higher resolution while maintaining the essential physics which are coupled to the larger domain. AFMIS will be maintained by the assimilation of a variety of real time data. Specifically this includes sea surface temperature (SST), color (SSC), and height (SSH) obtained from several space-based remote sensors (AVHRR, SeaWiFS and Topex/Poseidon). The assimilation of these data will allow nowcasting and forecasting over significant periods of time.
The Real-Time Demonstration of Concept (RTDOC) nowcasting and forecasting exercise is intended to demonstrate important aspects of the AFMIS concept by producing real time coupled forecasts of physical fields, biological and chemical fields, and fish abundance fields. It is intended to verify the physics, to validate the biology and chemistry but only to demonstrate the concept of forecasting the fish fields, since the fish dynamical models are at a very early stage of development. In addition, it is intended to demonstrate the integrated system concept and to consider the implication of coupling a management model. The goals of the RTDOC are: 1) to demonstrate real-time nowcasting and forecasting of coupled physical, biochemical and fish distribution fields and 2) utilize the data obtained to produce information relevant to fisheries management. These goals are based on several hypotheses, including the assumption that a dedicated ocean prediction system (AFMIS) which properly incorporates the interaction processes and feedback between the three dynamics can nowcast and forecast state variables of interest and that fish abundance distributions vary over 1 to 2 week time scales in ways that are important for fisheries management and fishing. The demonstration of concept has been structured to directly address these hypotheses by providing results in near real time to a variety of users.
Observational System Simulation Experiments (OSSEs) continue to develop the additional capabilities for AFMIS. Such OSSEs have been carried out for over a year in three domains: GB, GOM and NWA. The OSSEs in the GB domain involved the implementation and calibration of the physical (tidal effects, turbulent mixing, etc.), biological (initial adjustment, rates and other parameter testing) and Cod models based on NMFS MARMAP and US GLOBEC data. As improvements to the AFMIS system are completed, the AFMIS products will be upgraded and expanded.
UMass.-Dartmouth: Brian J. Rothschild - Lead Principal Investigator, J. Bisagni, A. Cabeza, A. Gangopadhyay, H.-S. Kim, L. Lanerolle, G. Strout, and M. Sundermeyer.
Harvard University: Allan R. Robinson - Principal Investigator and RTDOC Chief Scientist, P.J. Haley, Jr., P.F.J. Lermusiaux, W.G. Leslie, and C.J. Lozano
Physical Sciences, Inc.: Merlin Miller - Principal Investigator
The AFMIS RTDOC is supported by NASA and ONR.