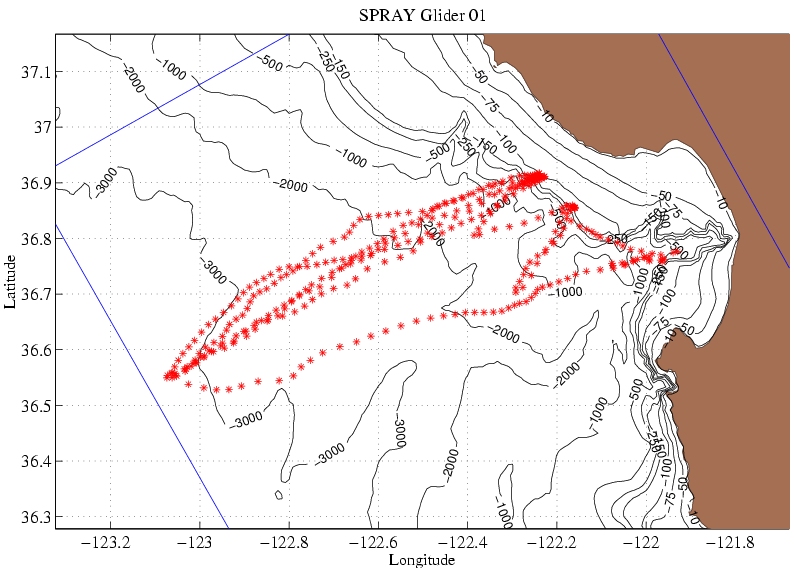
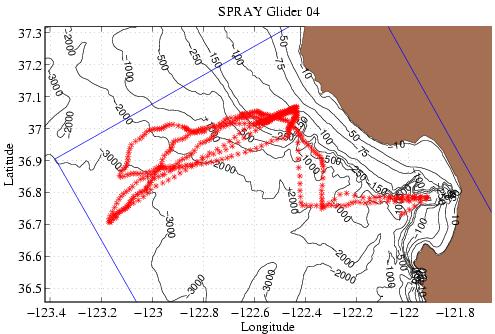
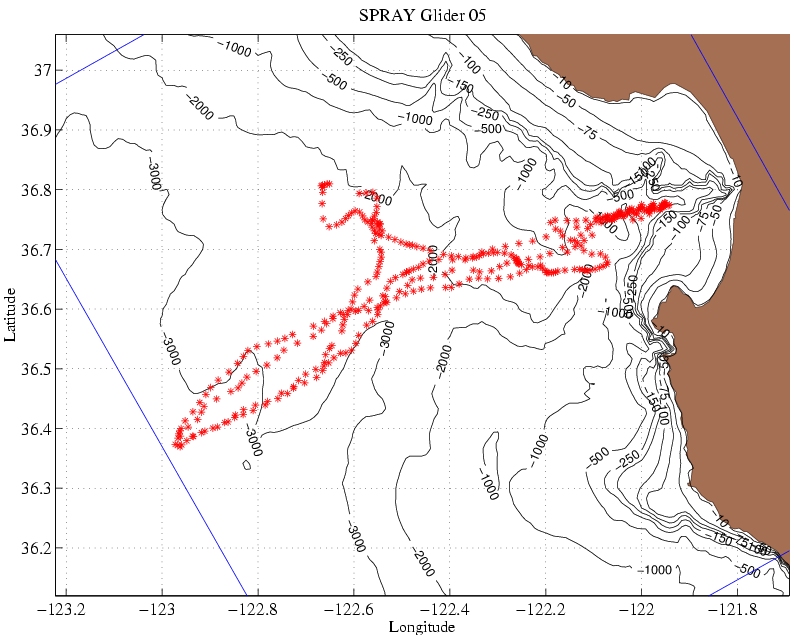
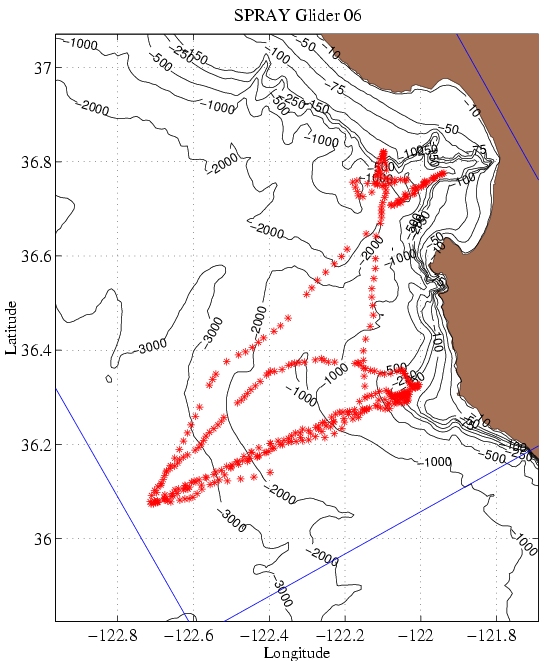
Scripps SPRAY Glider Data
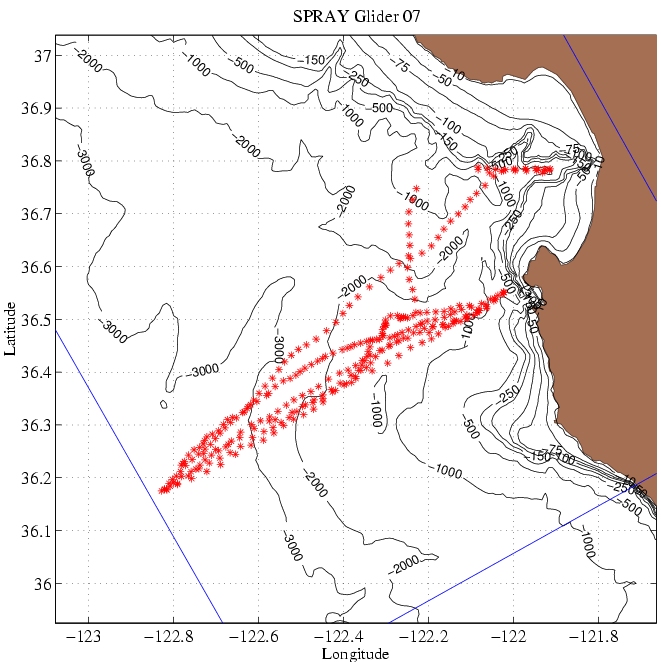
Plots of the positions, composite t(z), s(z), rho(z) and t-s for
all casts, and individual plots of t(z) and s(z) are available for
each glider below. Note that there are a couple of casts which
are limited to surface and deep points only, leading to a straight line which
connects the top and bottom of the cast. These casts will be eliminated before
further use. Clicking on the individual plots brings up a large version of the plot.
These plots have been generated utilizing the data released
on 8 December 2003.
Individual SPRAY Gliders