Detection Rate Improvements Through Understanding and Modeling Ocean Variability:
Surface Dynamic Uncertainty Characterization and Transfer (S-DUCT)


MIT-MSEAS Modeling and Data Products for 2018/2019 Phase I Option

P.F.J. Lermusiaux, P.J. Haley,
C. Mirabito, W.H. Ali
Massachusetts Institute of Technology
Center for Ocean Engineering
Mechanical Engineering
Cambridge, Massachusetts

P. Abbot, C. Emerson
OASIS, Inc.

C.-S. Chiu
Naval Postgraduate School
Presentations
Model output
Comparison with data
Data and Simulations Inputs
S-DUCT Project Main Research Page

This research is sponsored by NAVAIR.


Presentations (Phase I Option)

MIT-MSEAS S-DUCT slides (November 18, 2018) (pdf)

Top of page


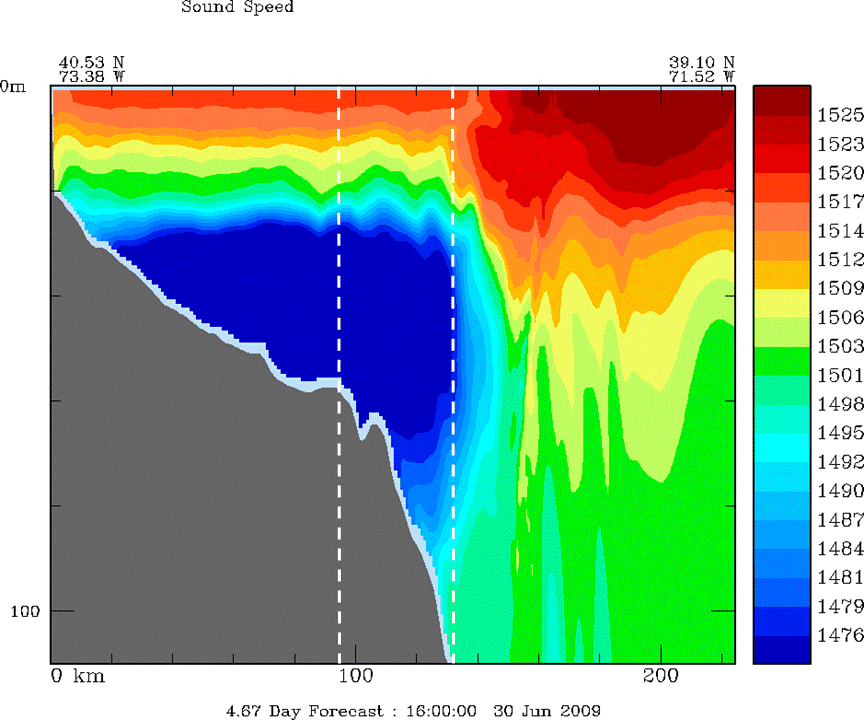
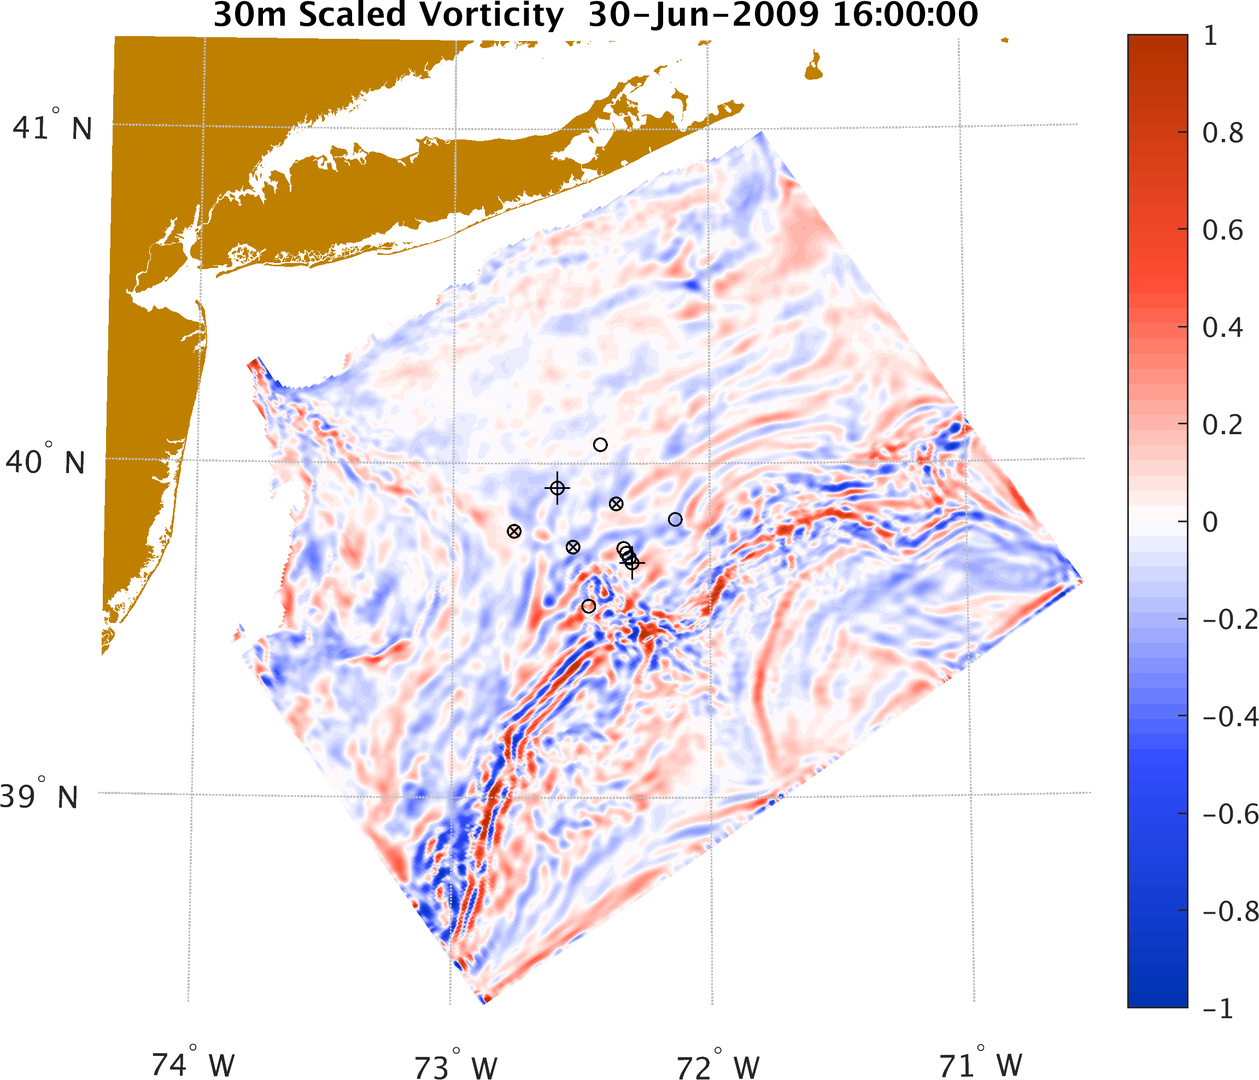
MIT-MSEAS Simulation Results (Phase I Option)

Top of page


Comparison of MIT-MSEAS Simulations to Data (Phase I Option)

Comparison of MIT-MSEAS Model Output with XBT Data, NDBC Buoy SST Data, and Image-Derived SST Data

Top of page


Data and Simulation Inputs utilized/processed (Phase I Option):

Synoptic Data

MSEAS-processed atmospheric forcing flux forecasts

NCEP NAM 32km June/July 2009
Daily average wind stress, E-P, heat flux, and SW Radiation (from 0Z forecast each day)
Flux snapshot plots (a single 60hr fct issued daily) 22 23 24 25 26 27 28 29 30 1 2 3 4 5 6 7
Forecast snapshot plots (Four 6-hour forecasts/day) 22 23 24 25 26 27 28 29 30 1 2 3 4 5 6 7

Top of page