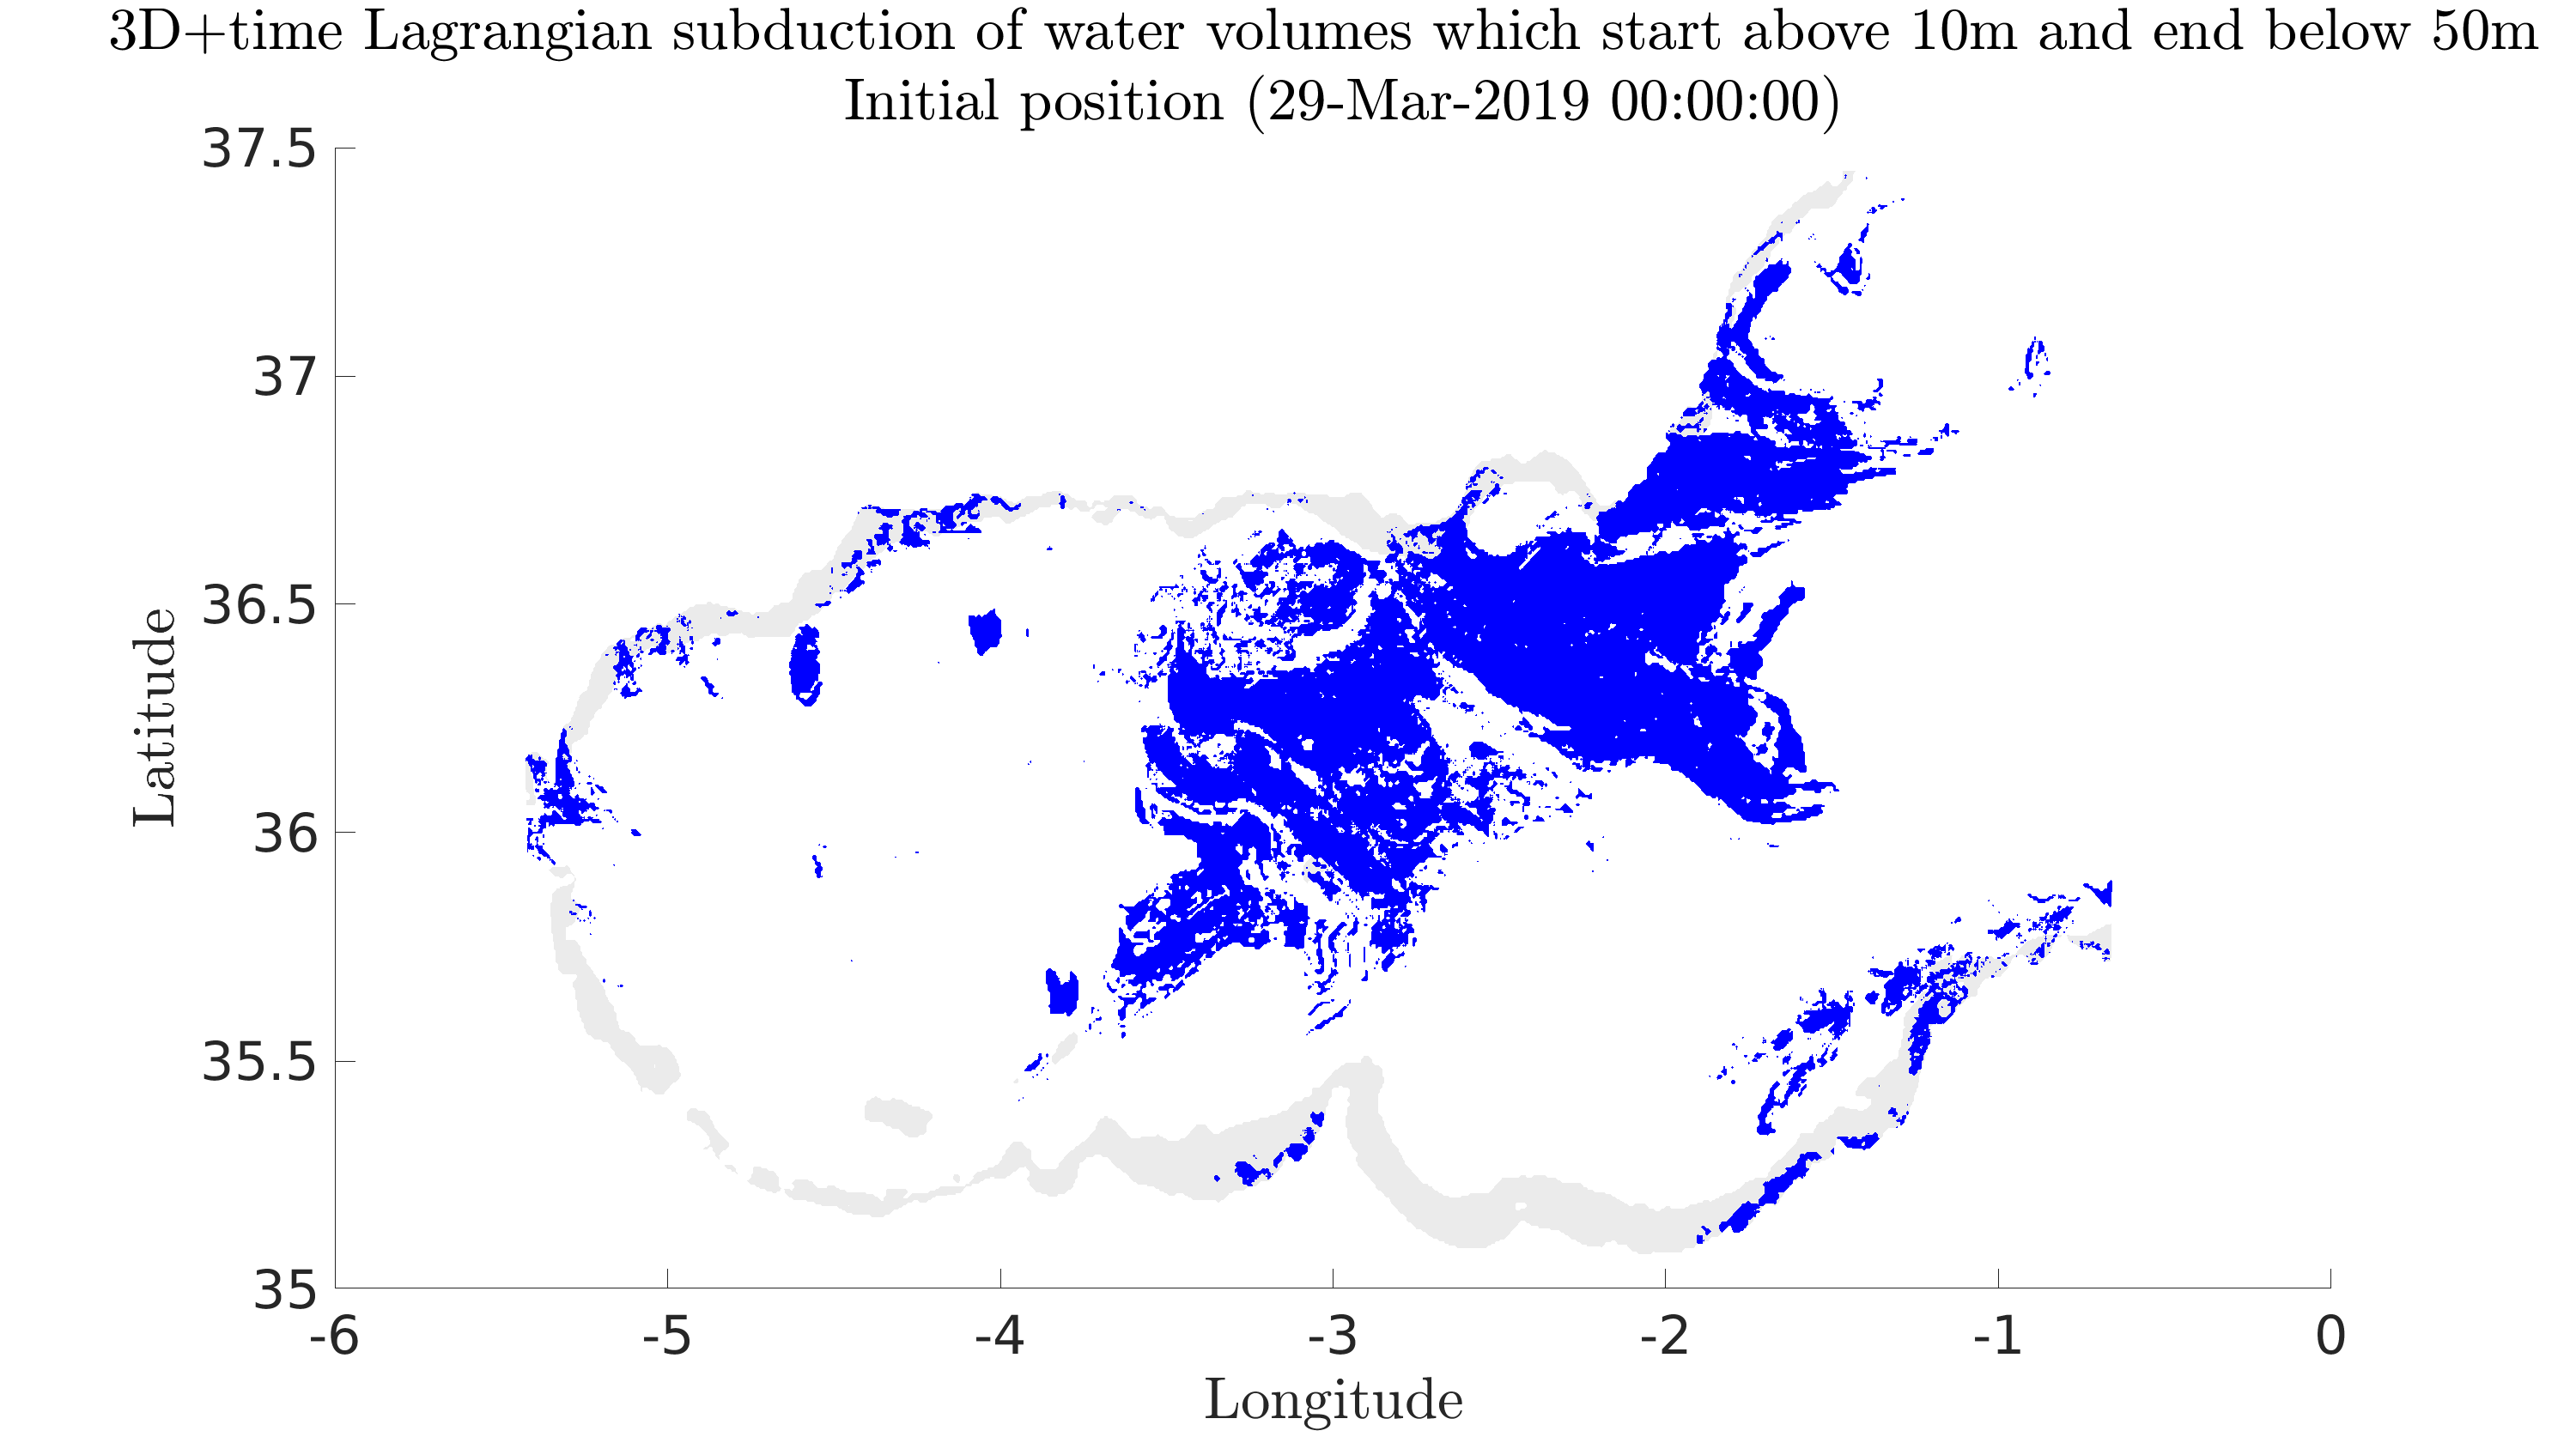
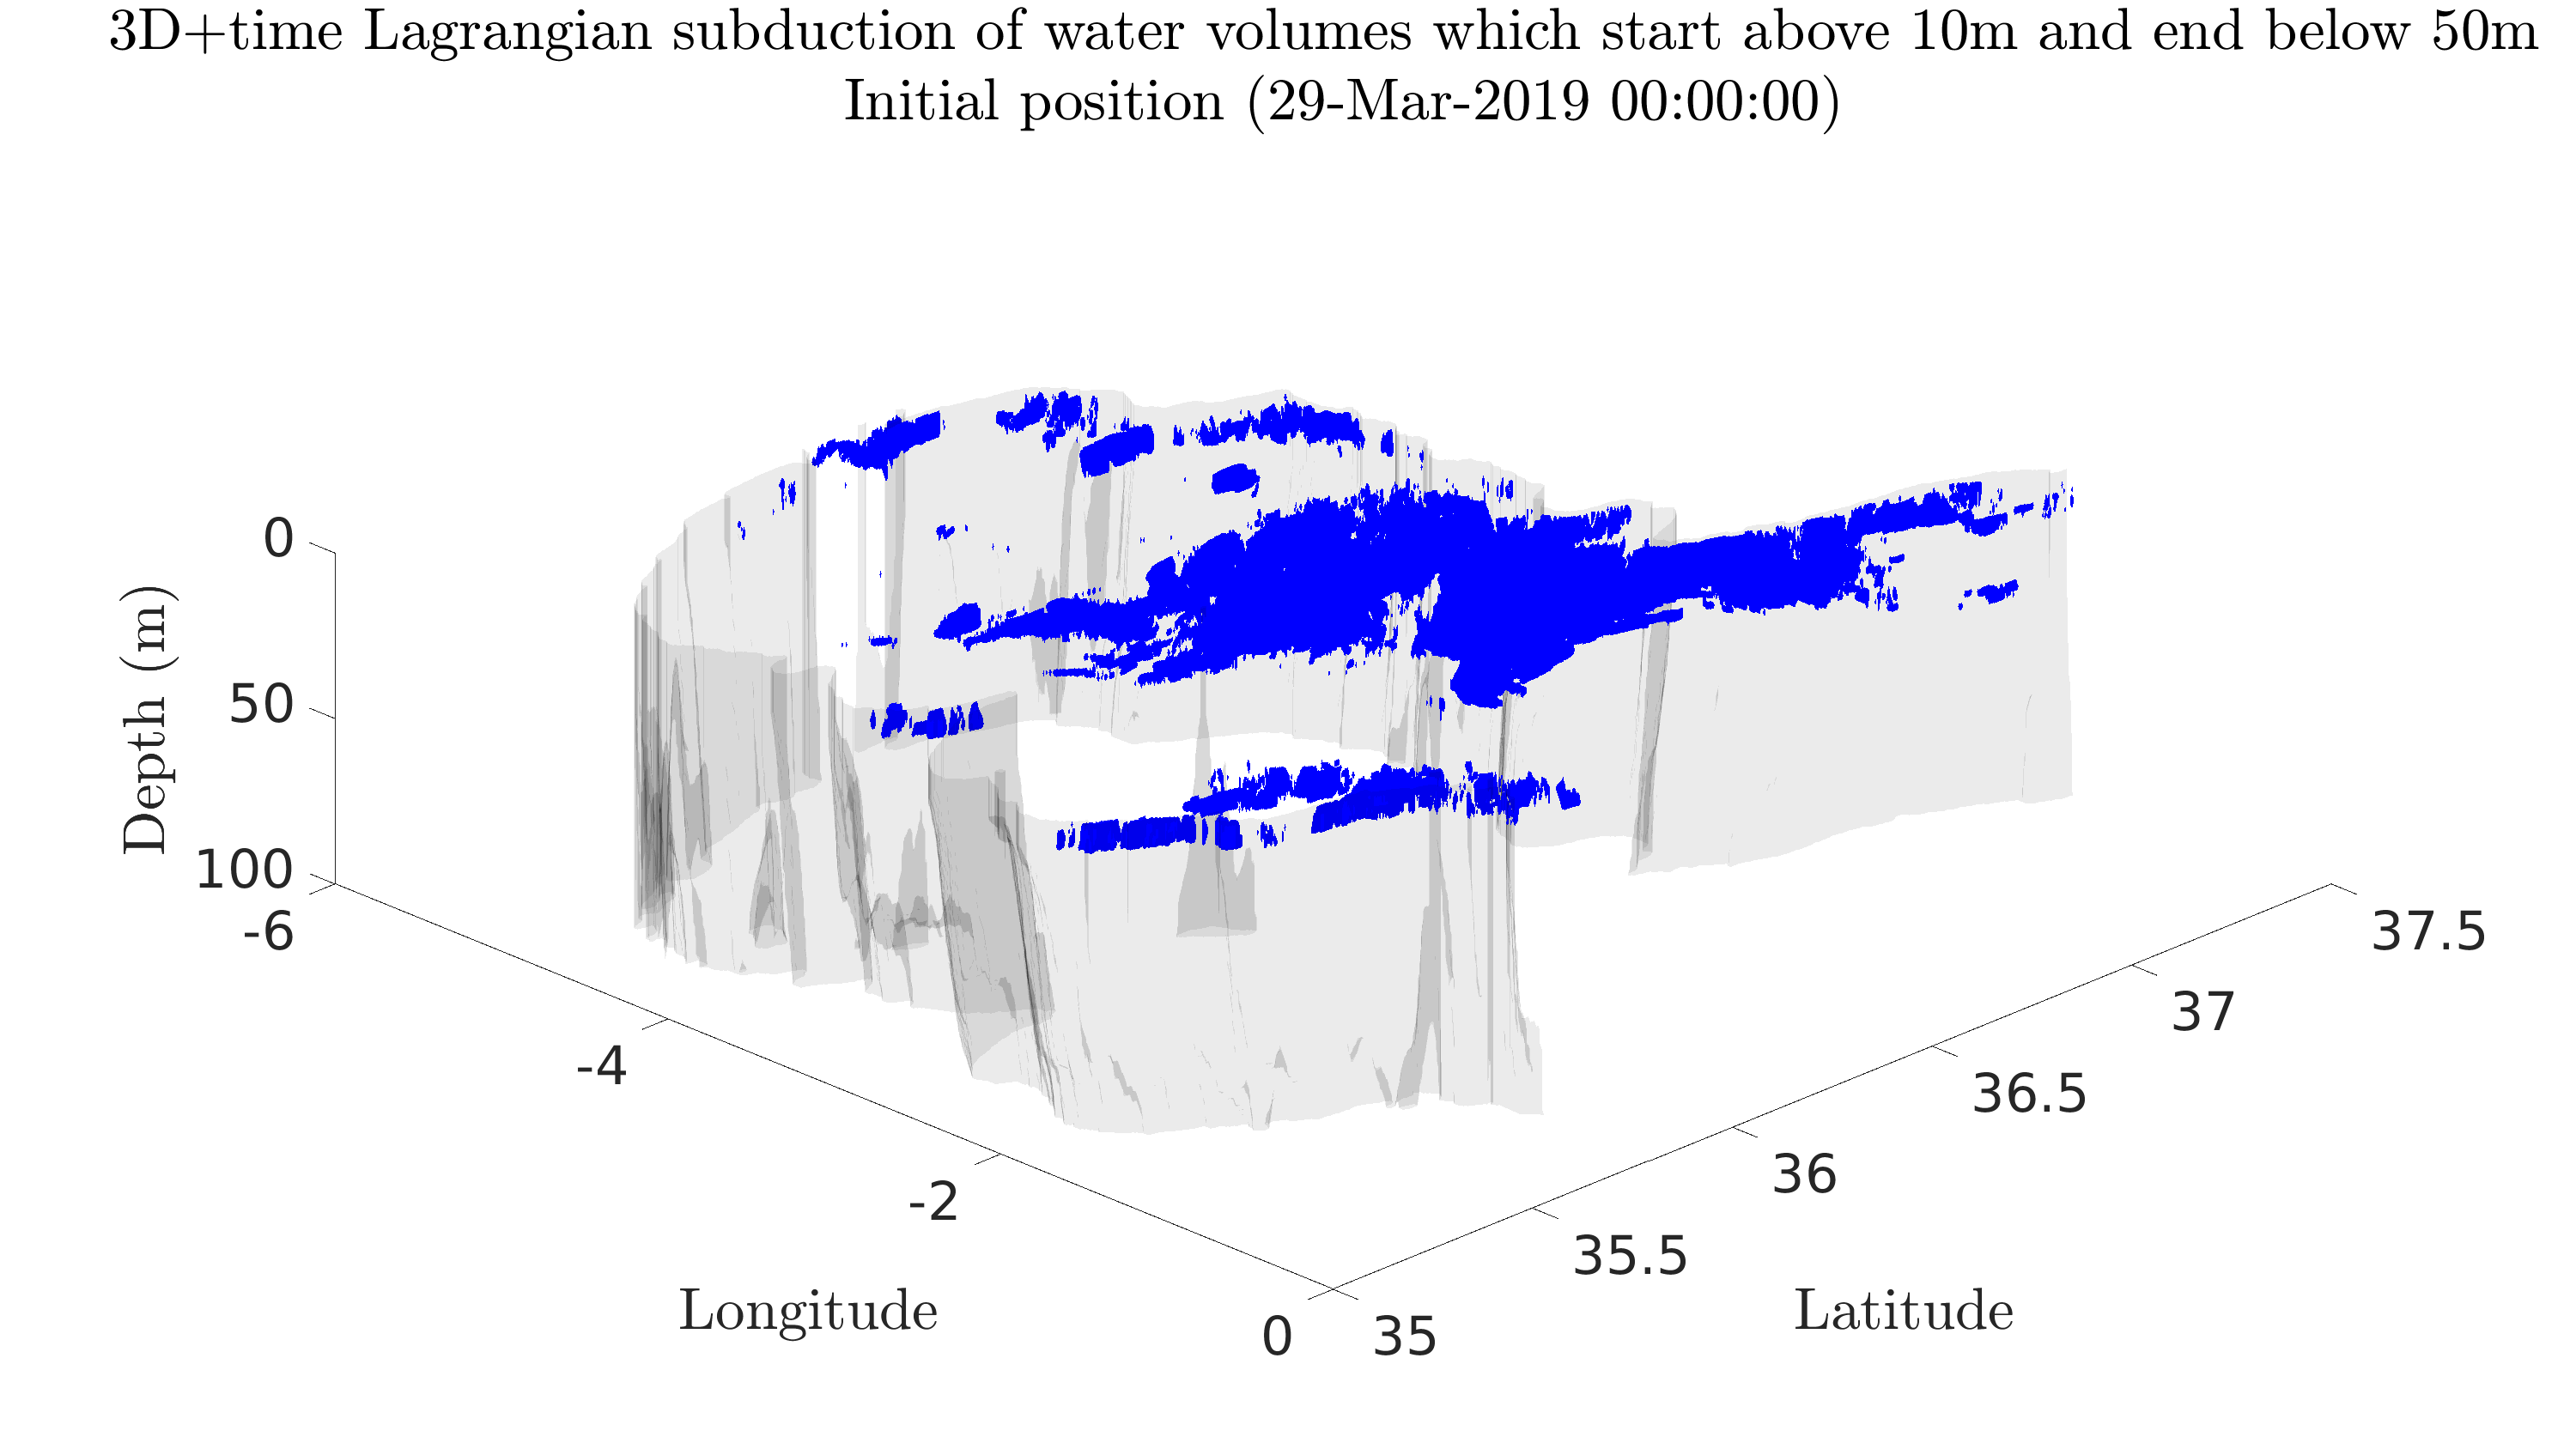
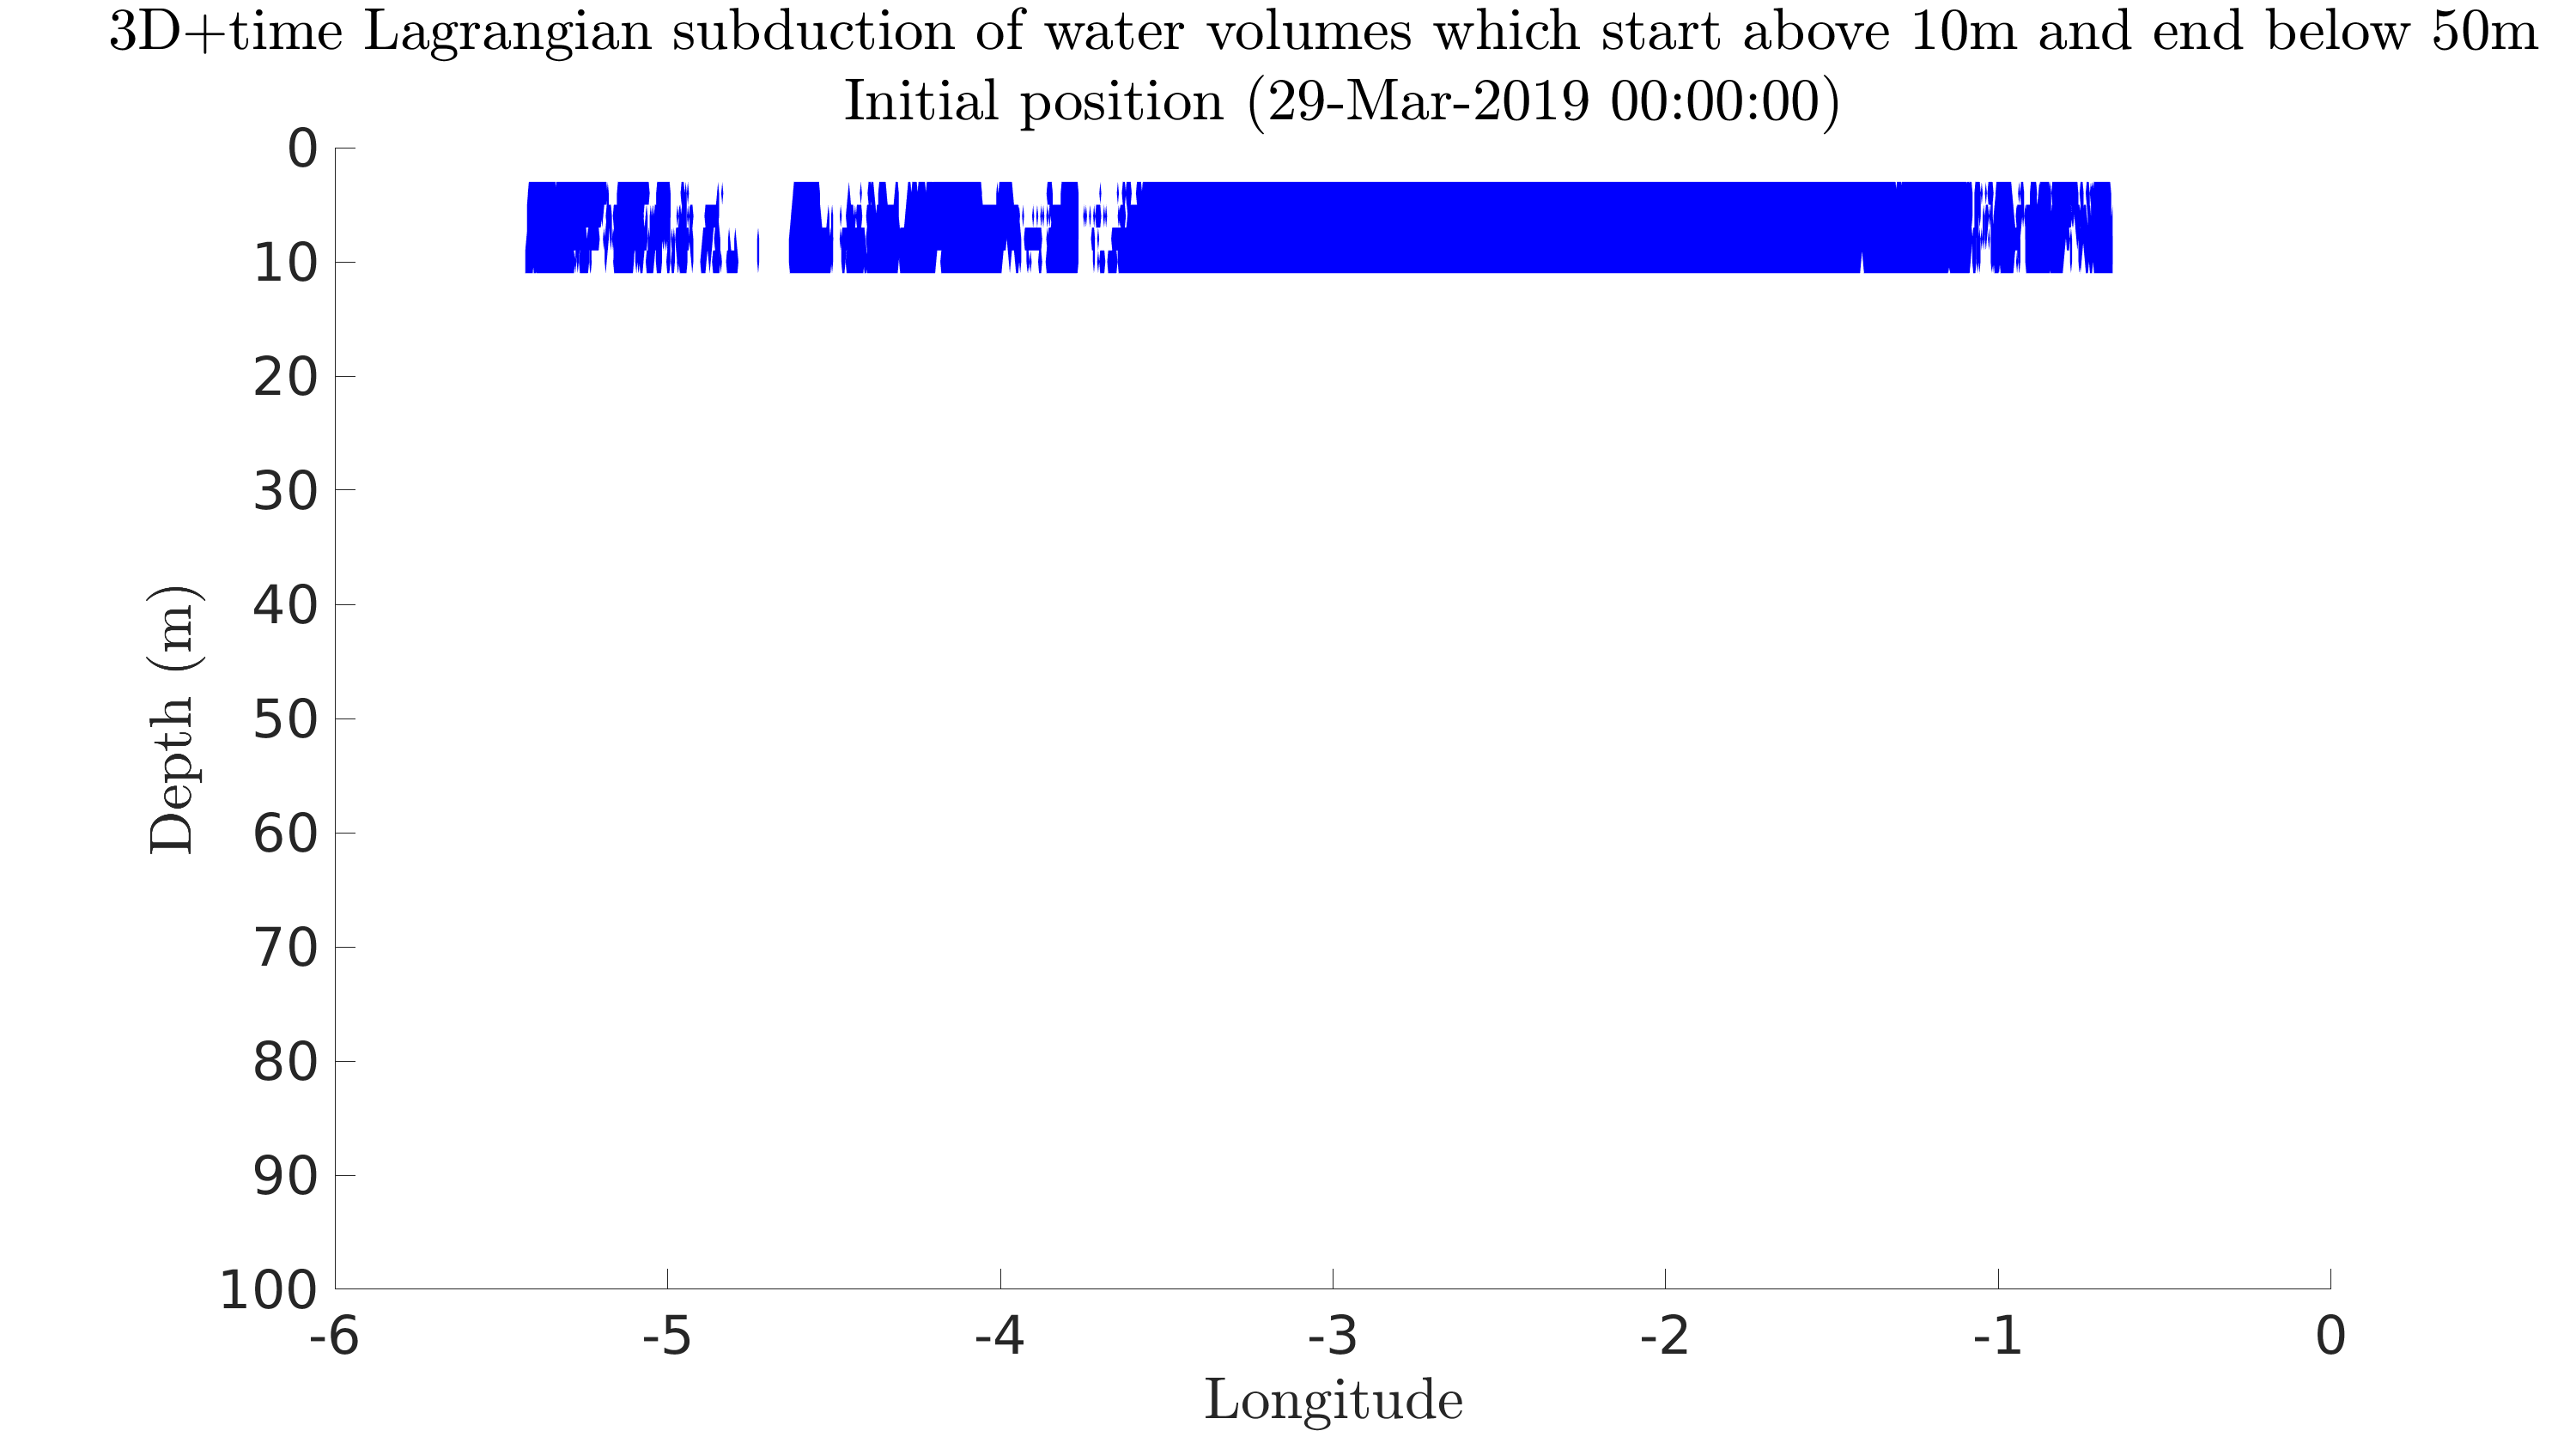
The following figures show the water volumes that are forecast to subduct in 3D (computed based on our MSEAS forward flowmap forecast) from the surface layers to deeper layers. They illustrate in 3D+time where these waters start, how they move, and where they end up.
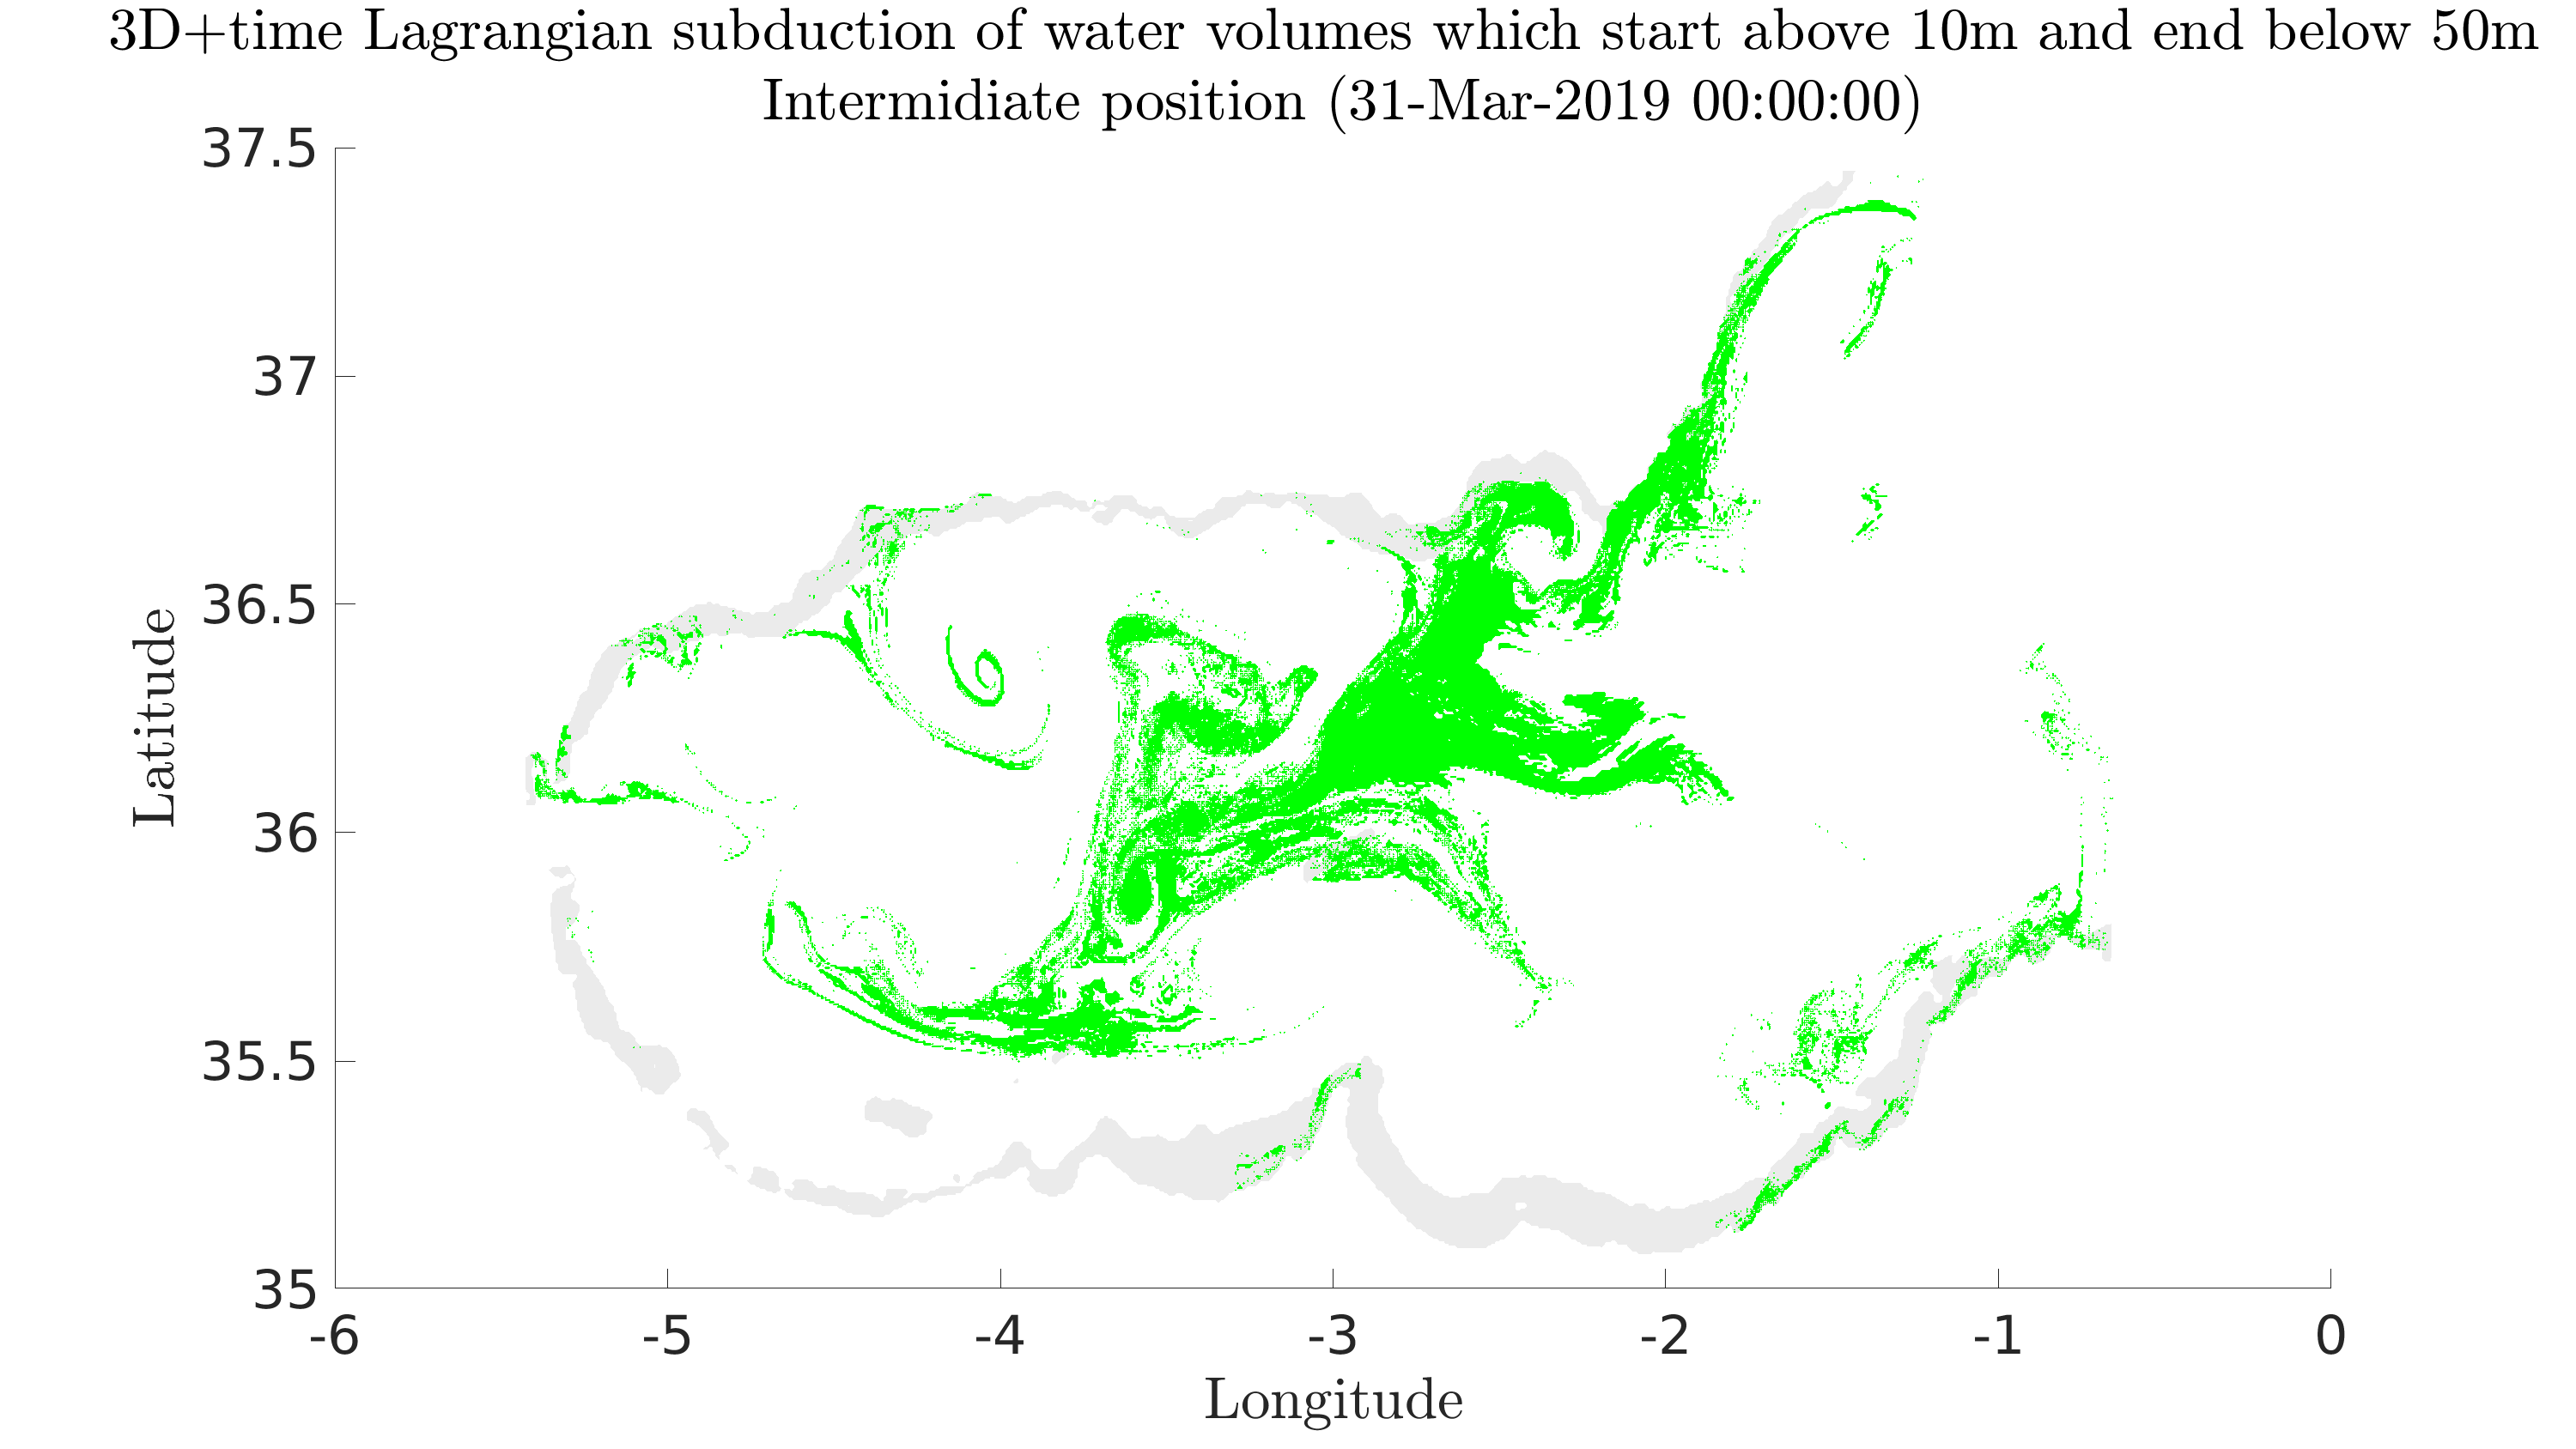
The waters that are plotted in this subduction analysis are only the volumes of water that start within the upper ocean layers (0-to-10 m depths) anywhere in our modeling domain and reach 60m after 4 days. This is all that is plotted, at 3 times (blue is day 0, green is day 2 and red is day 4).
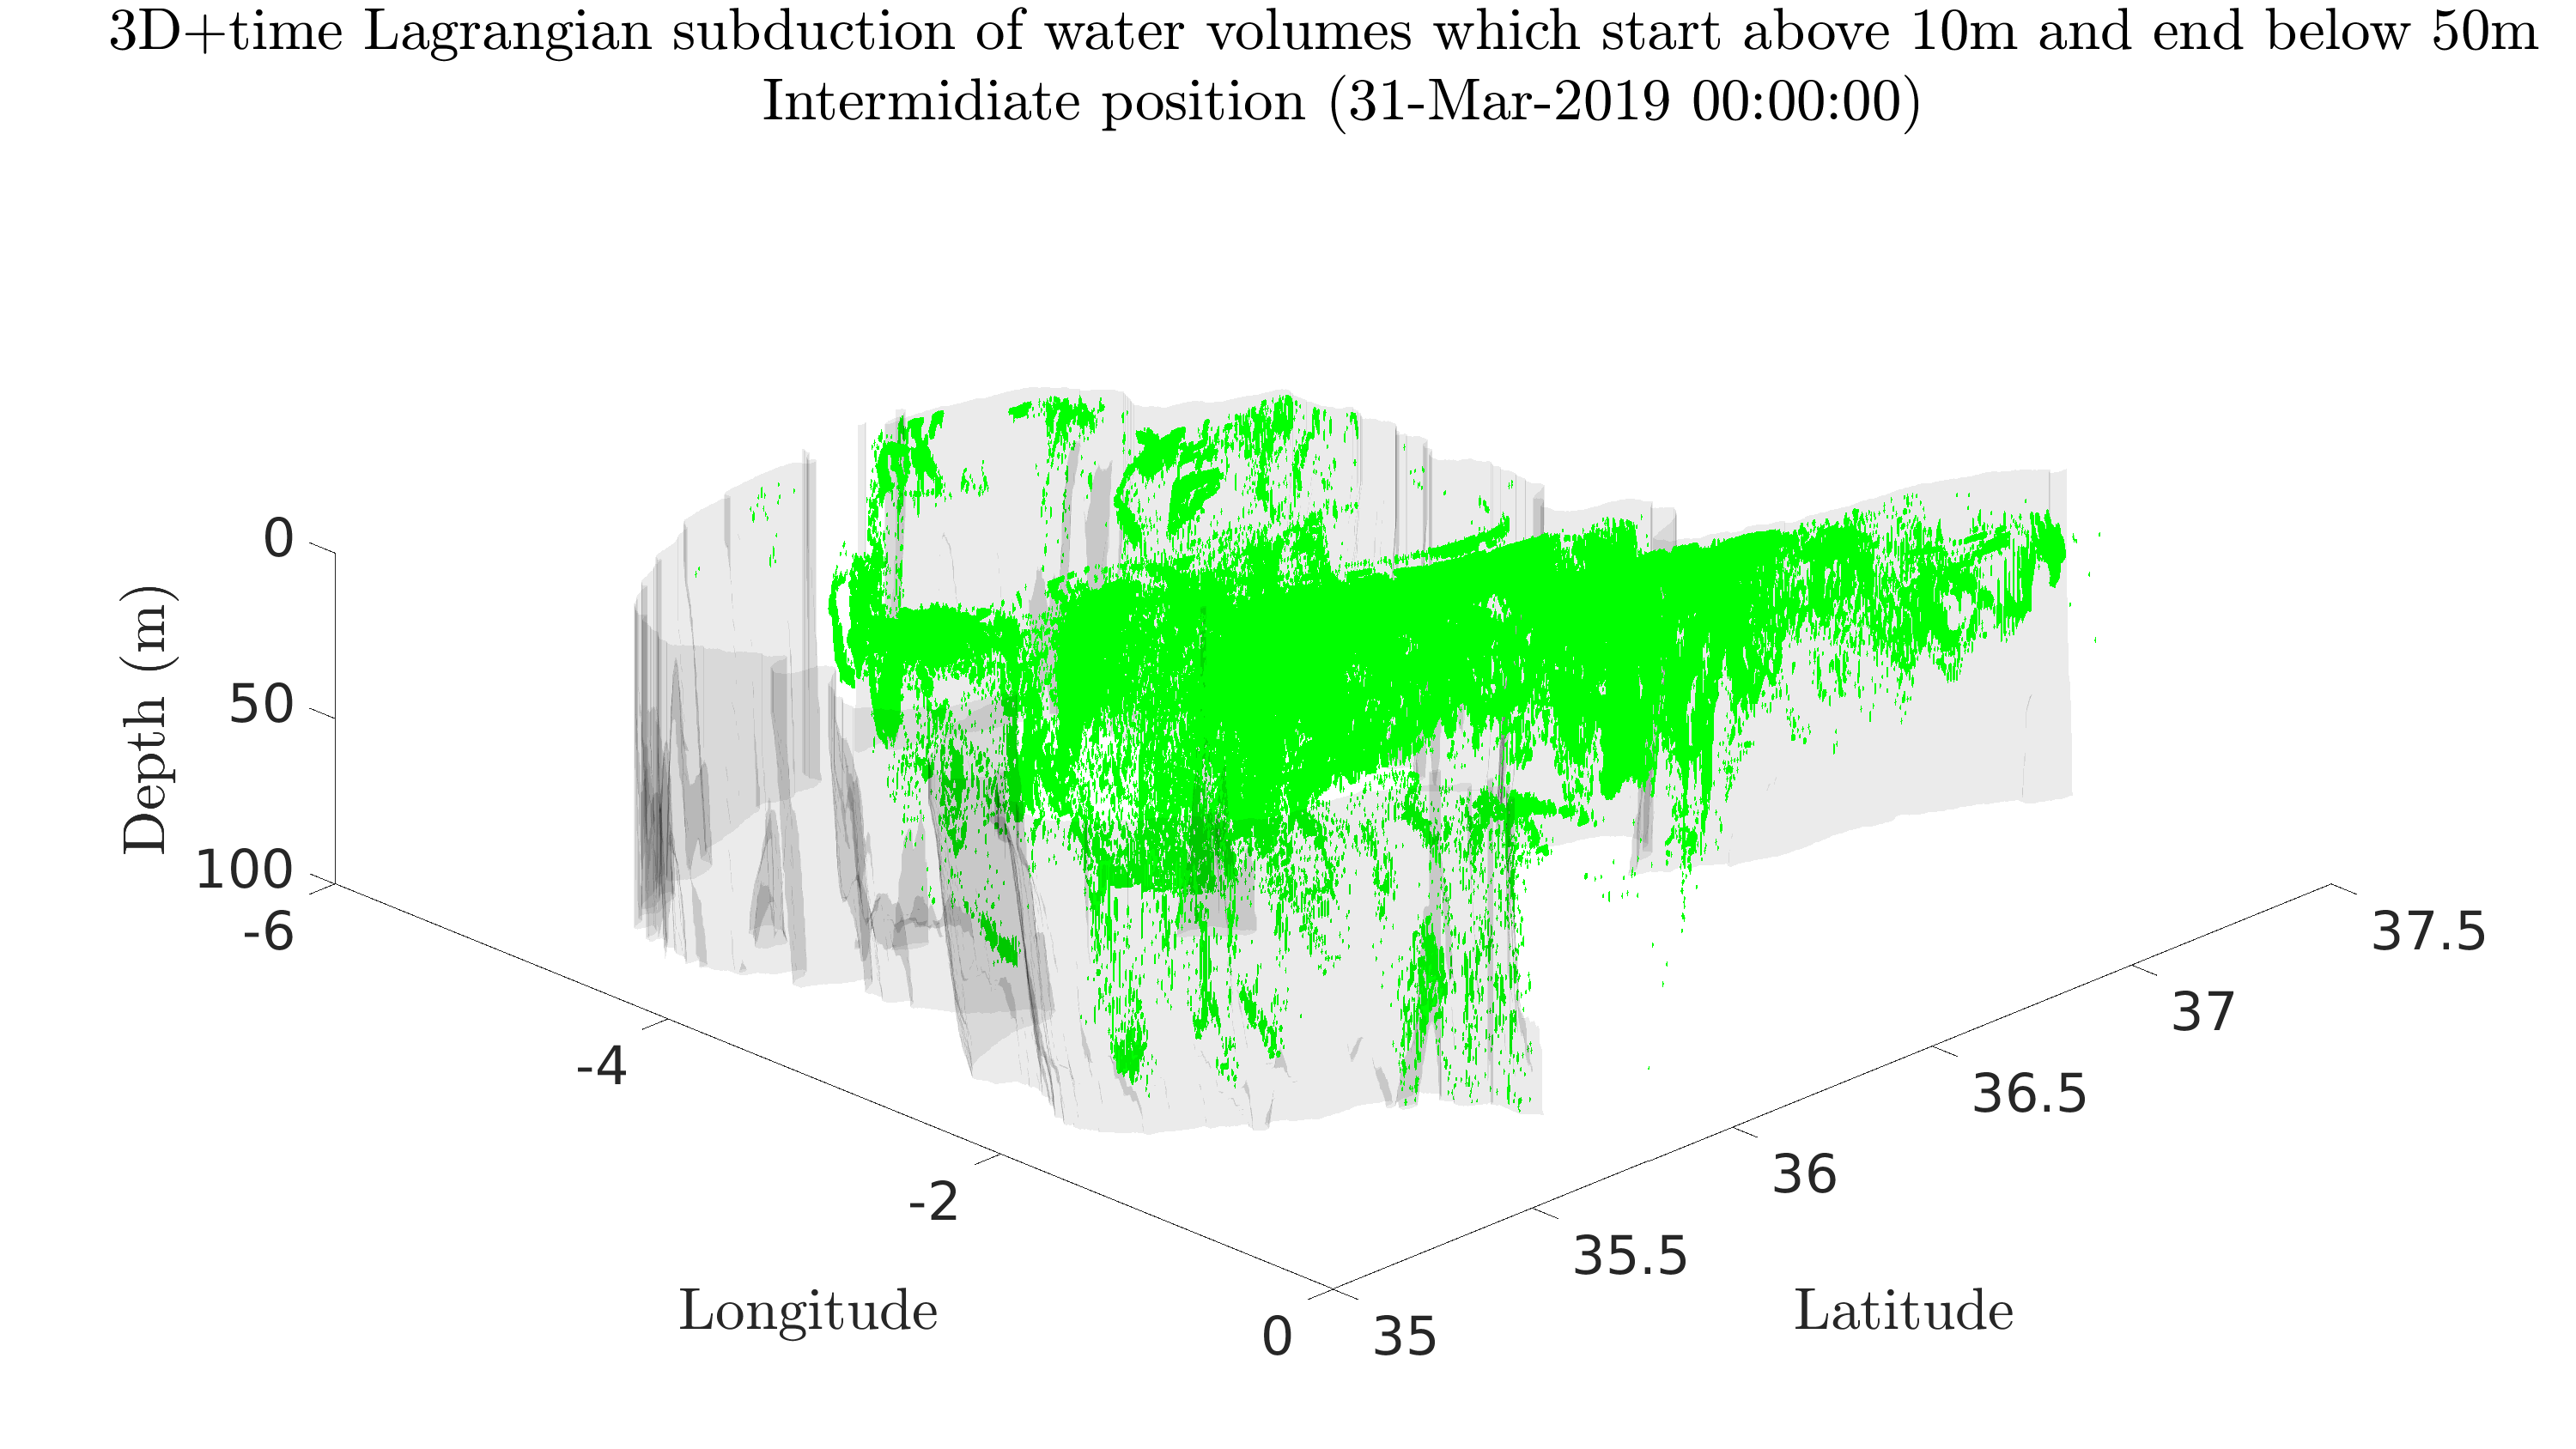
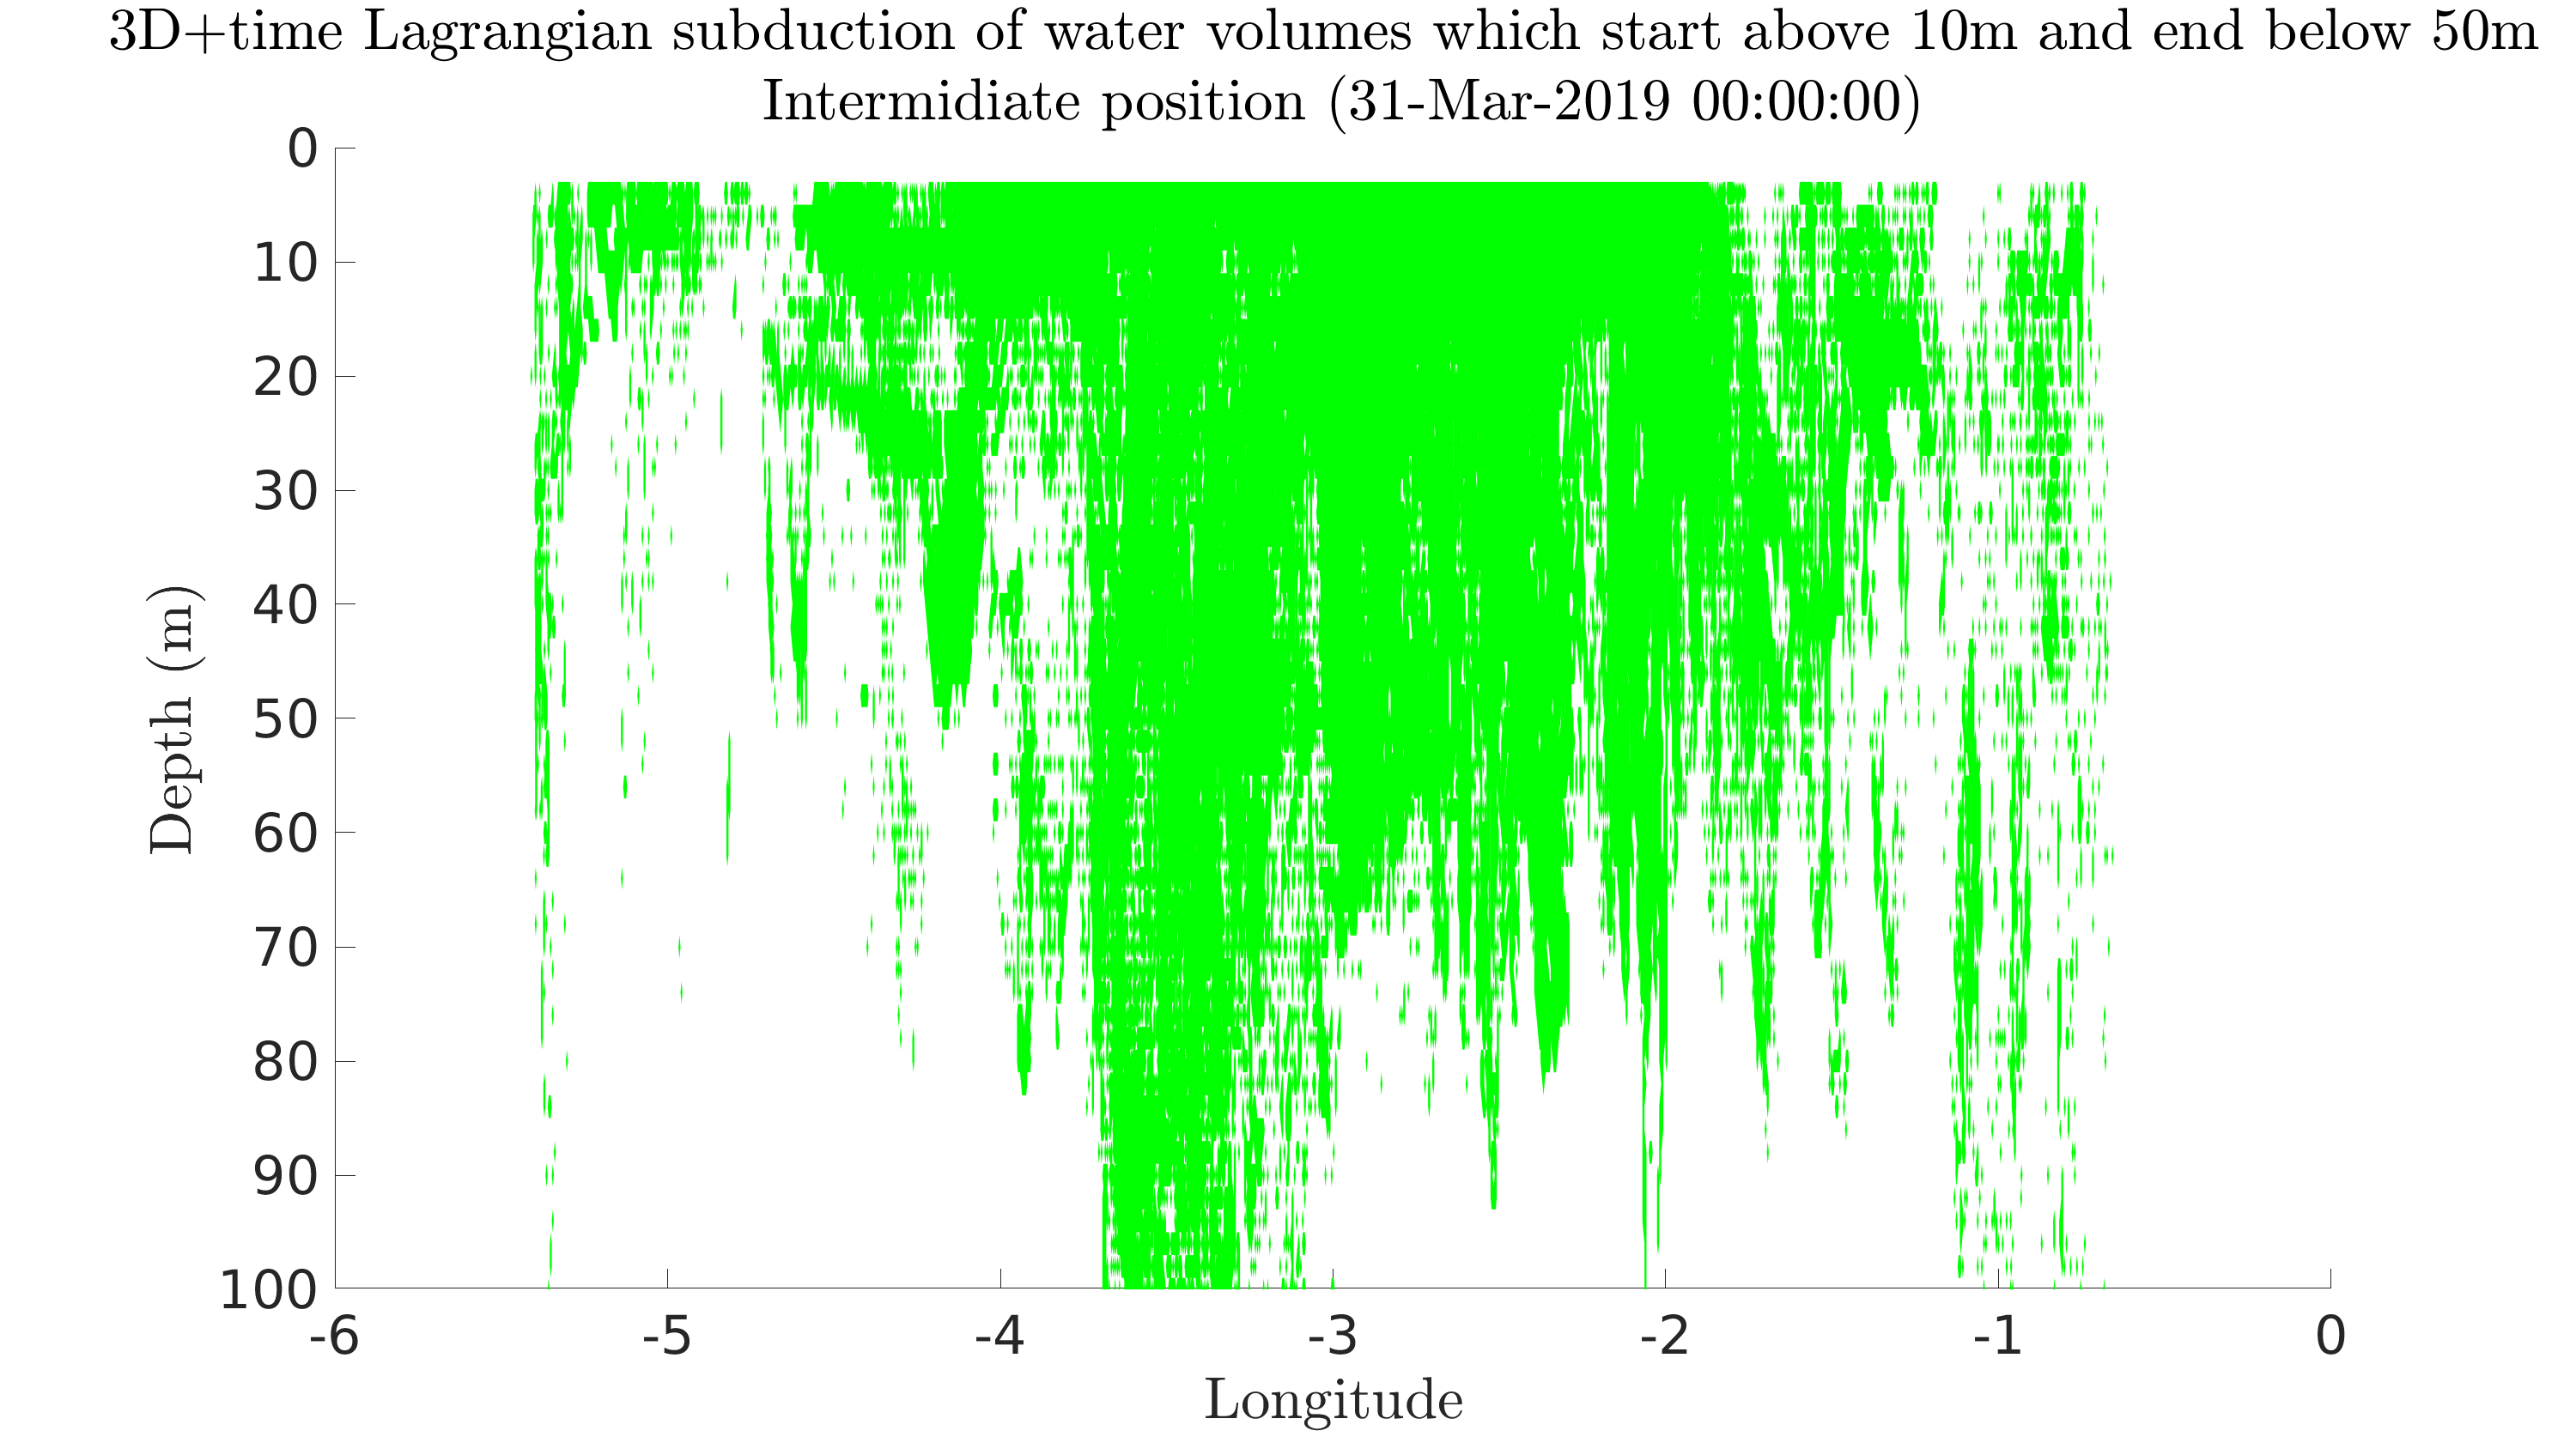
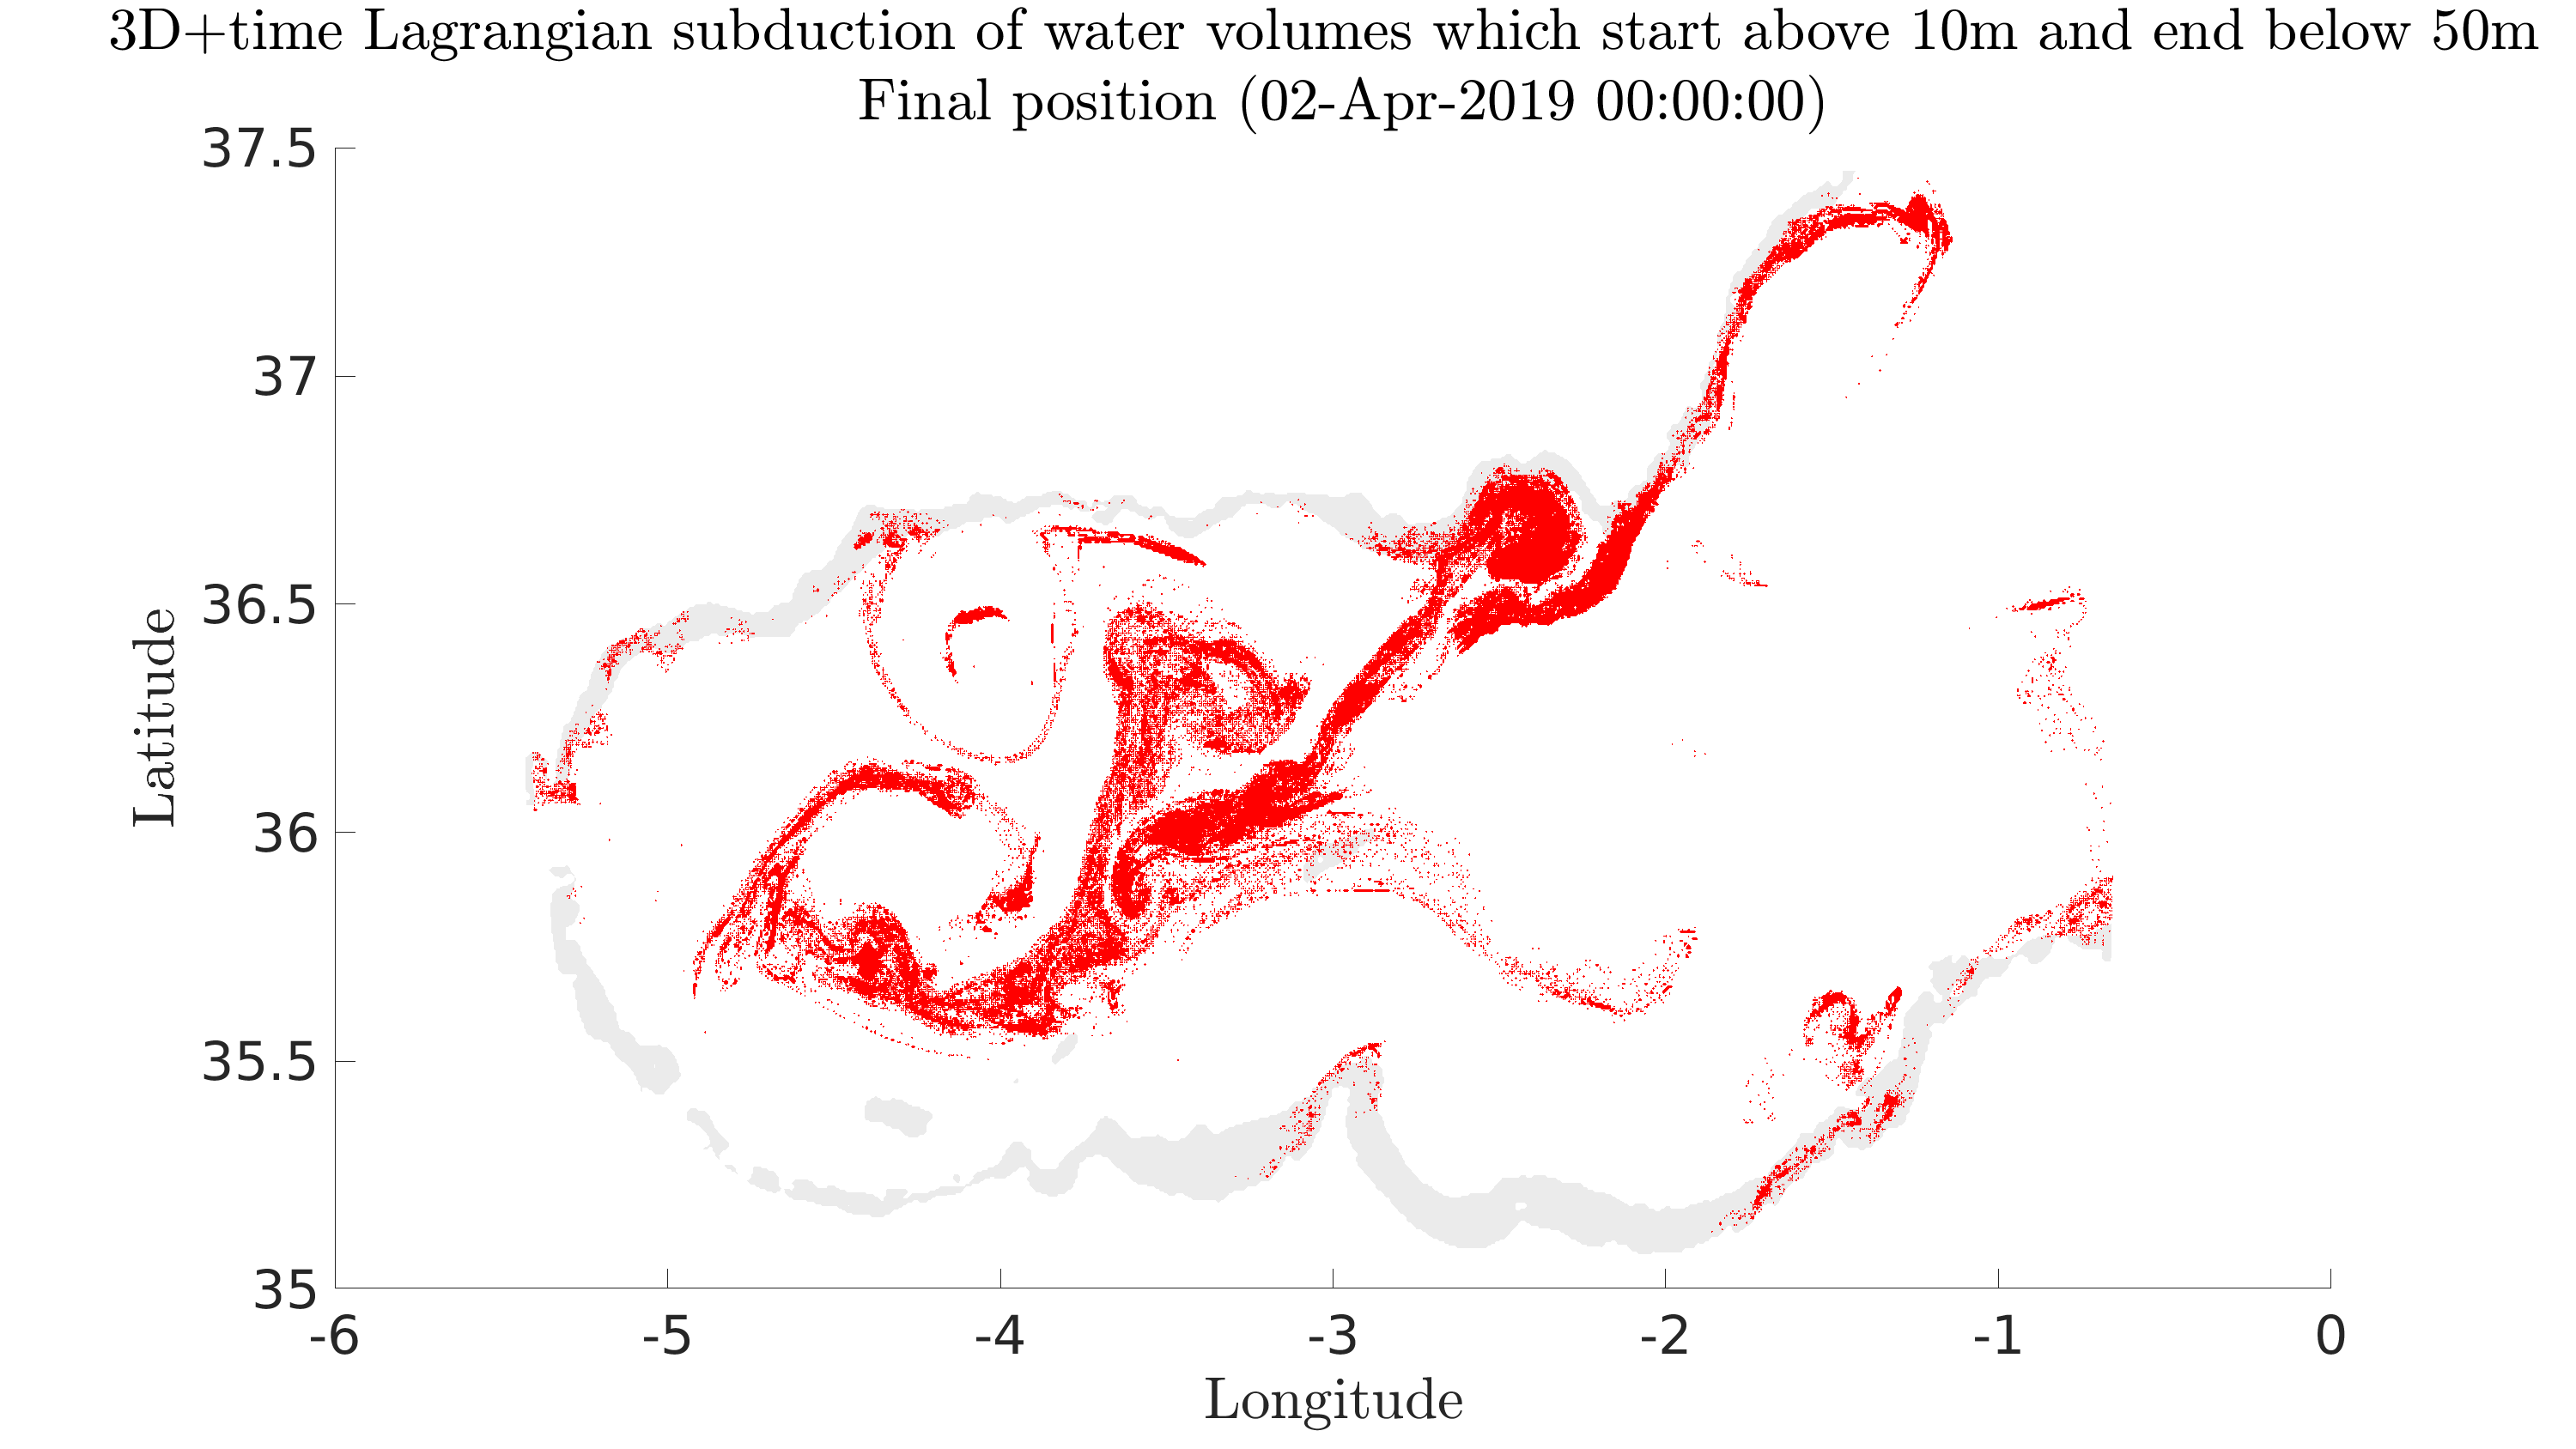
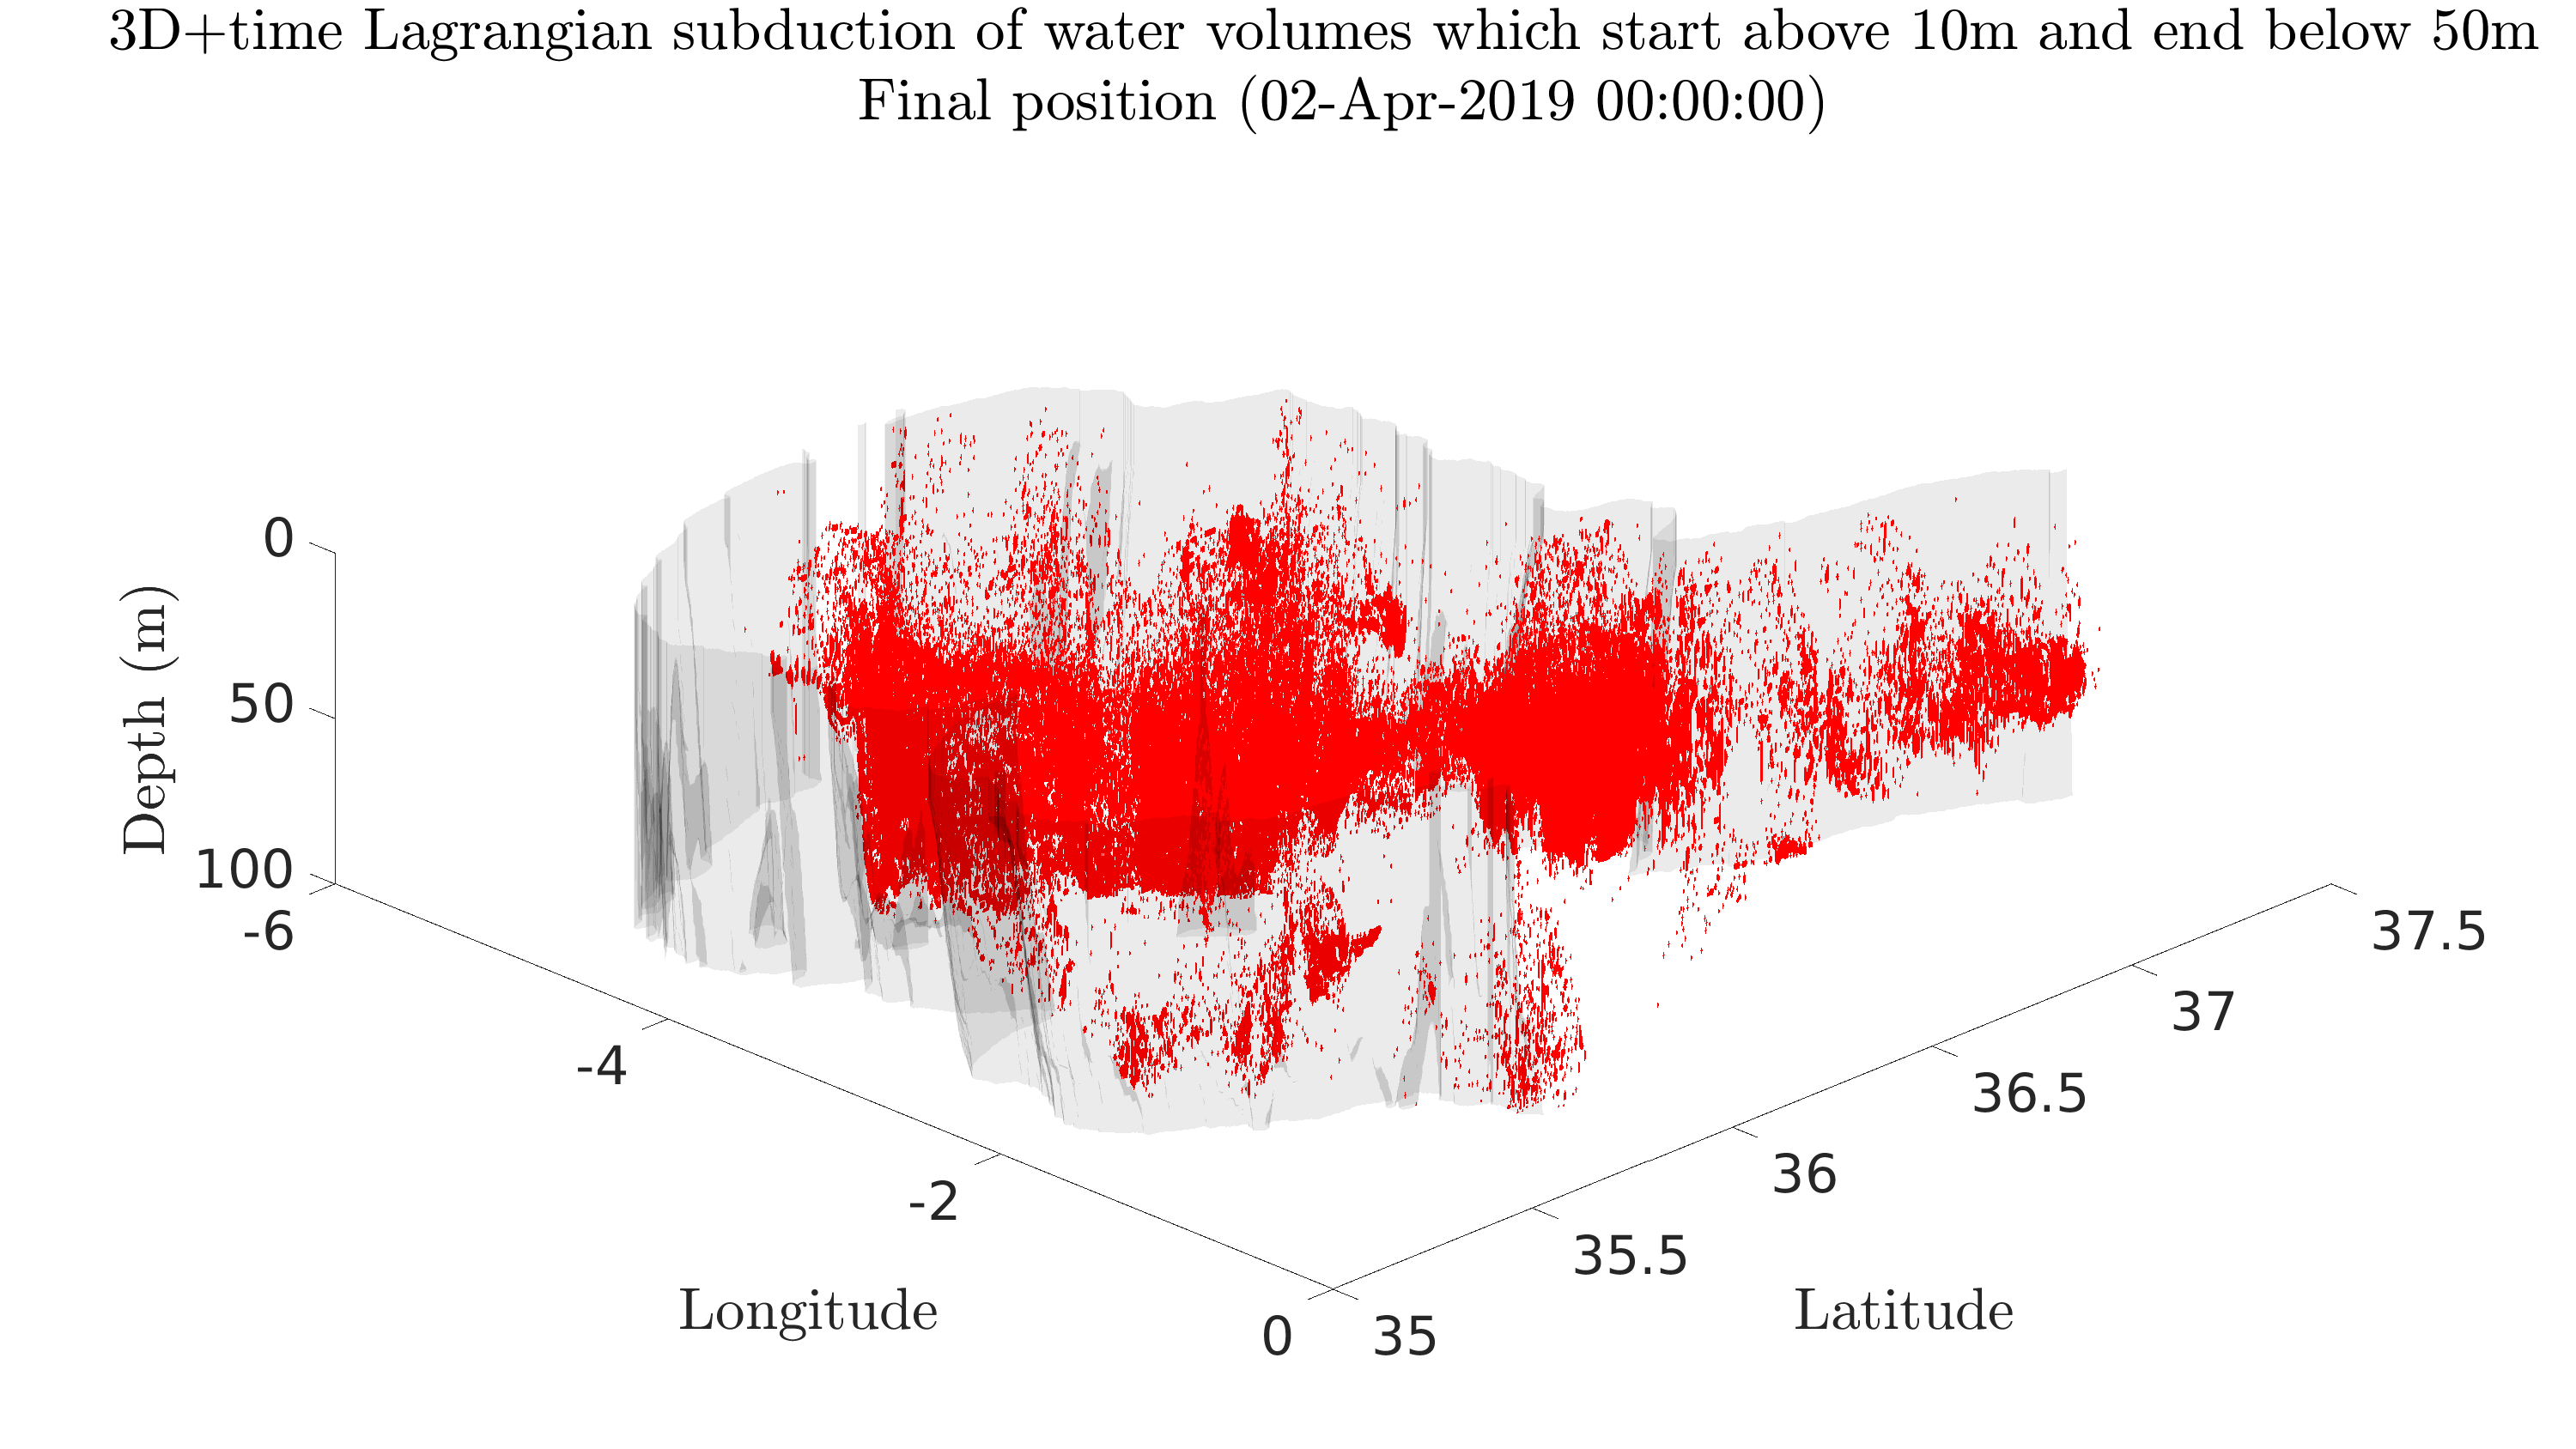
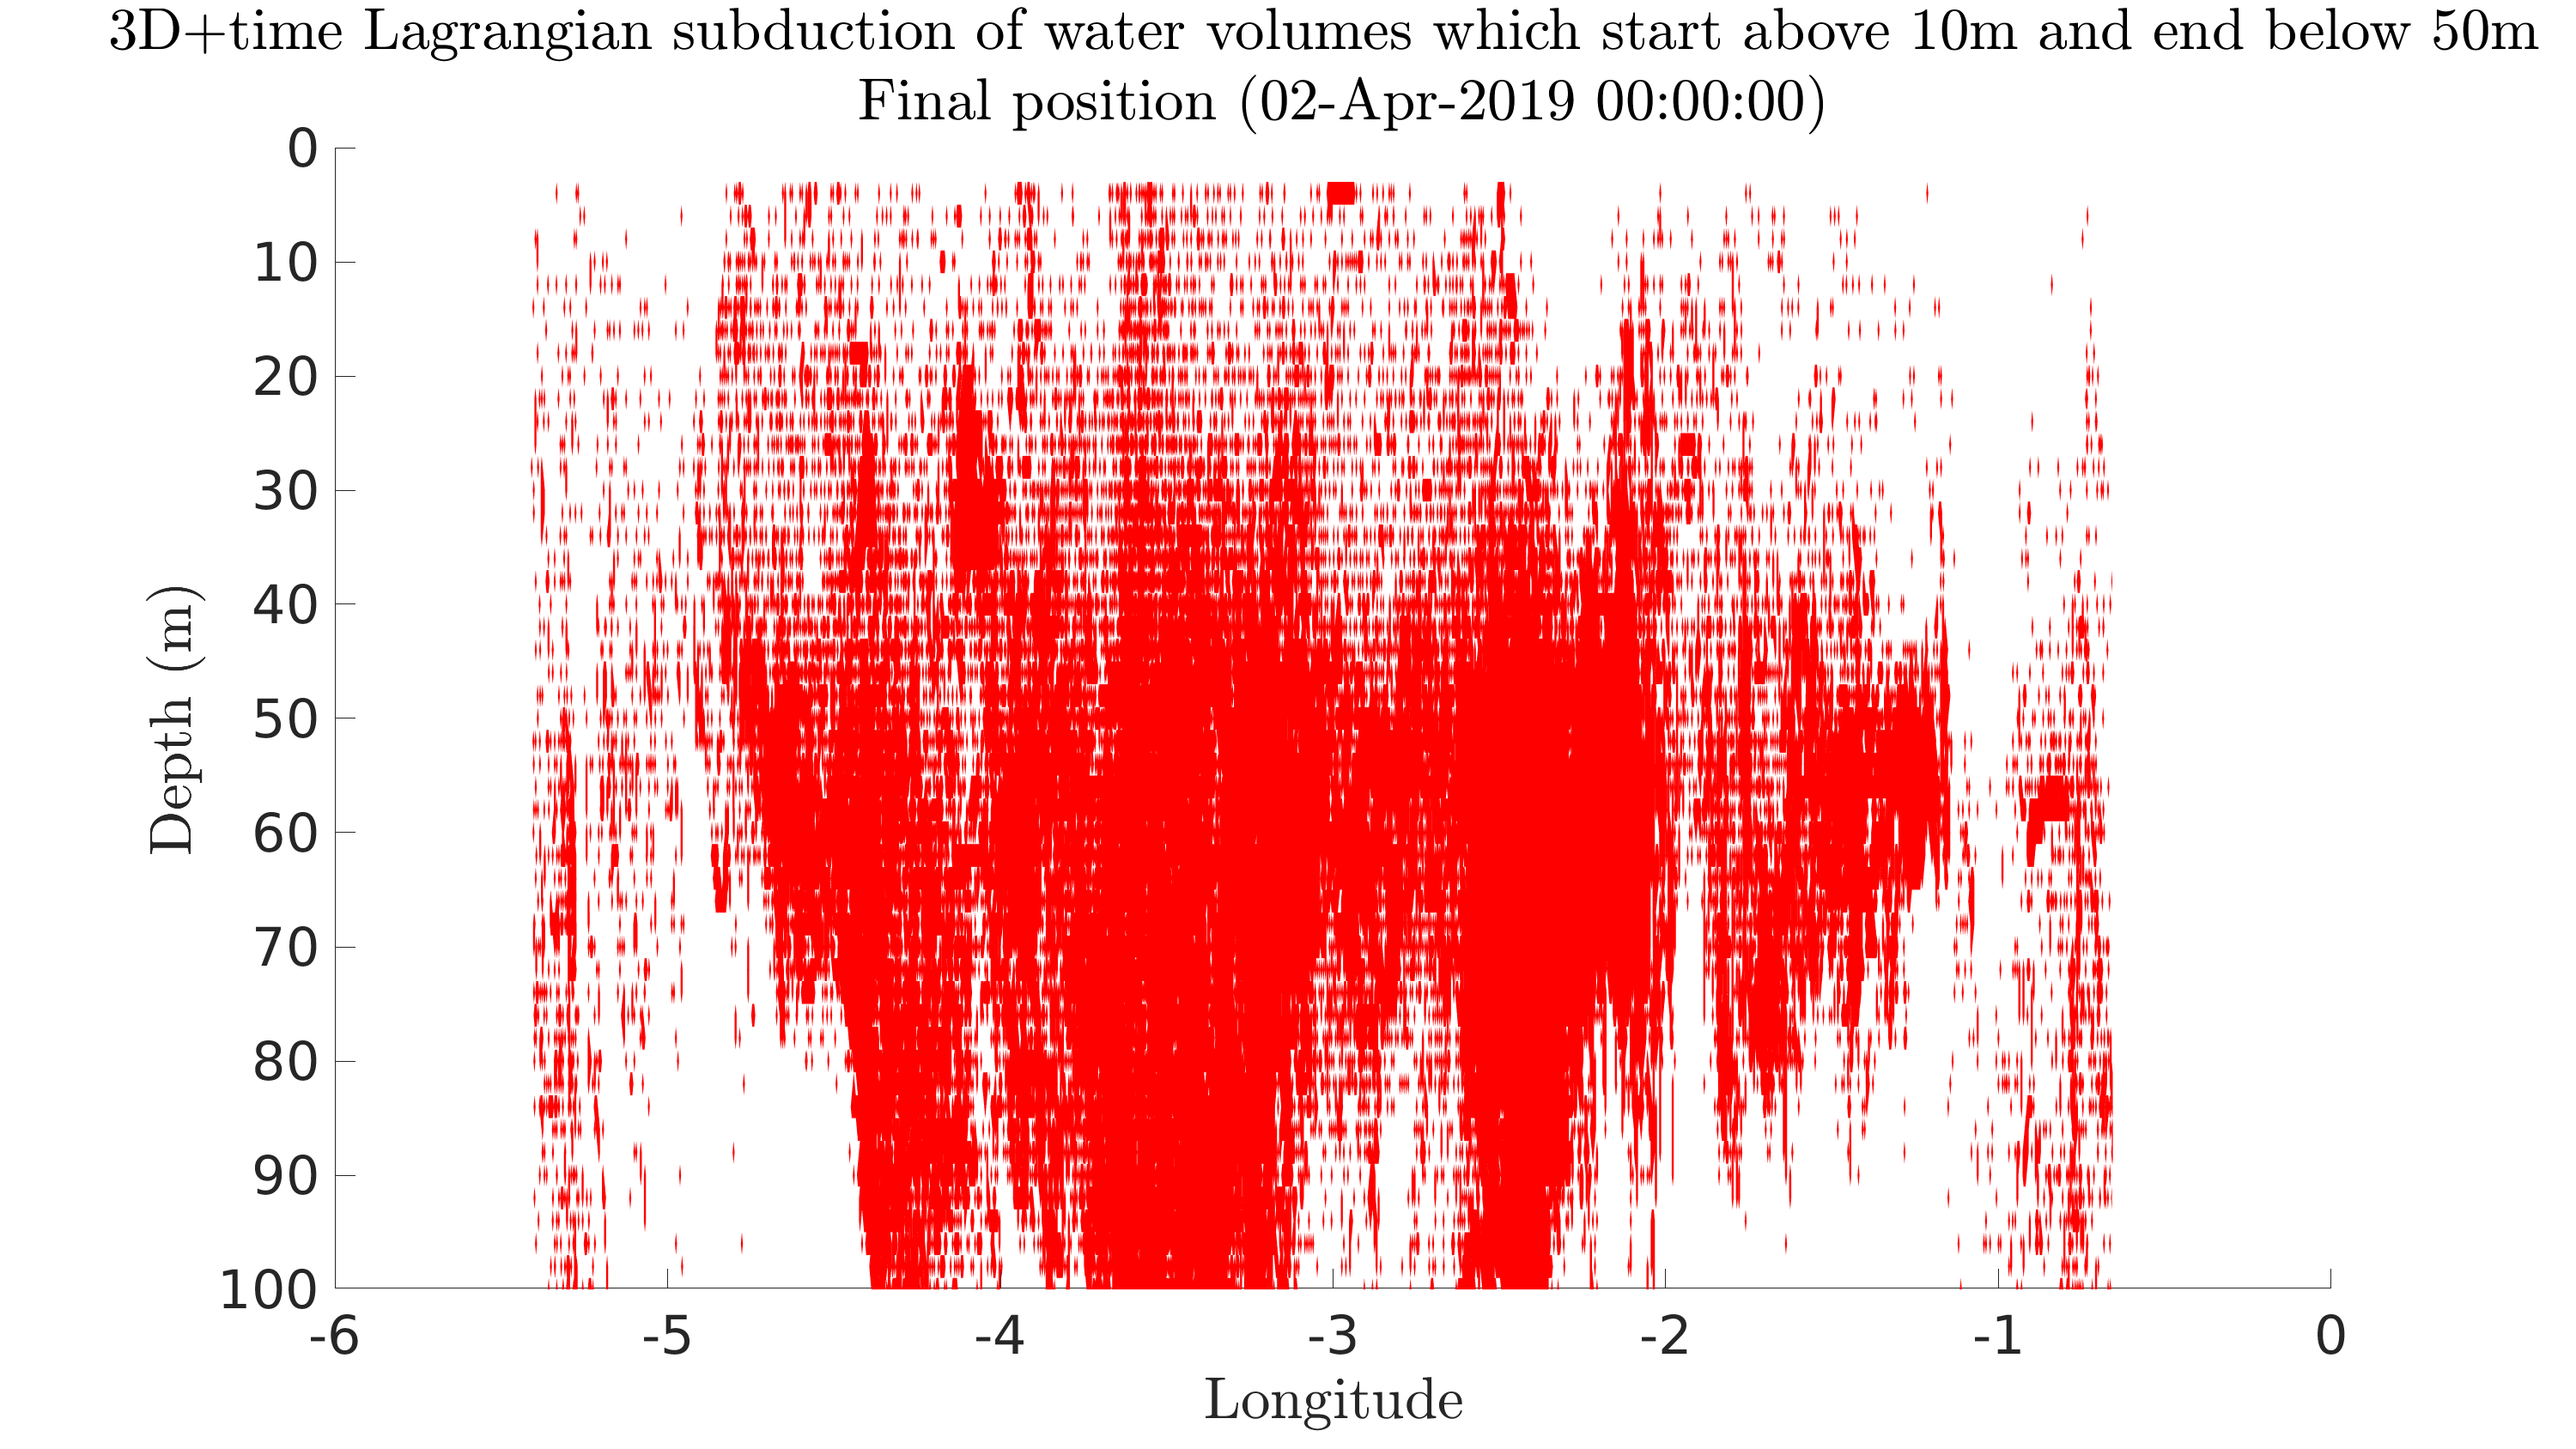
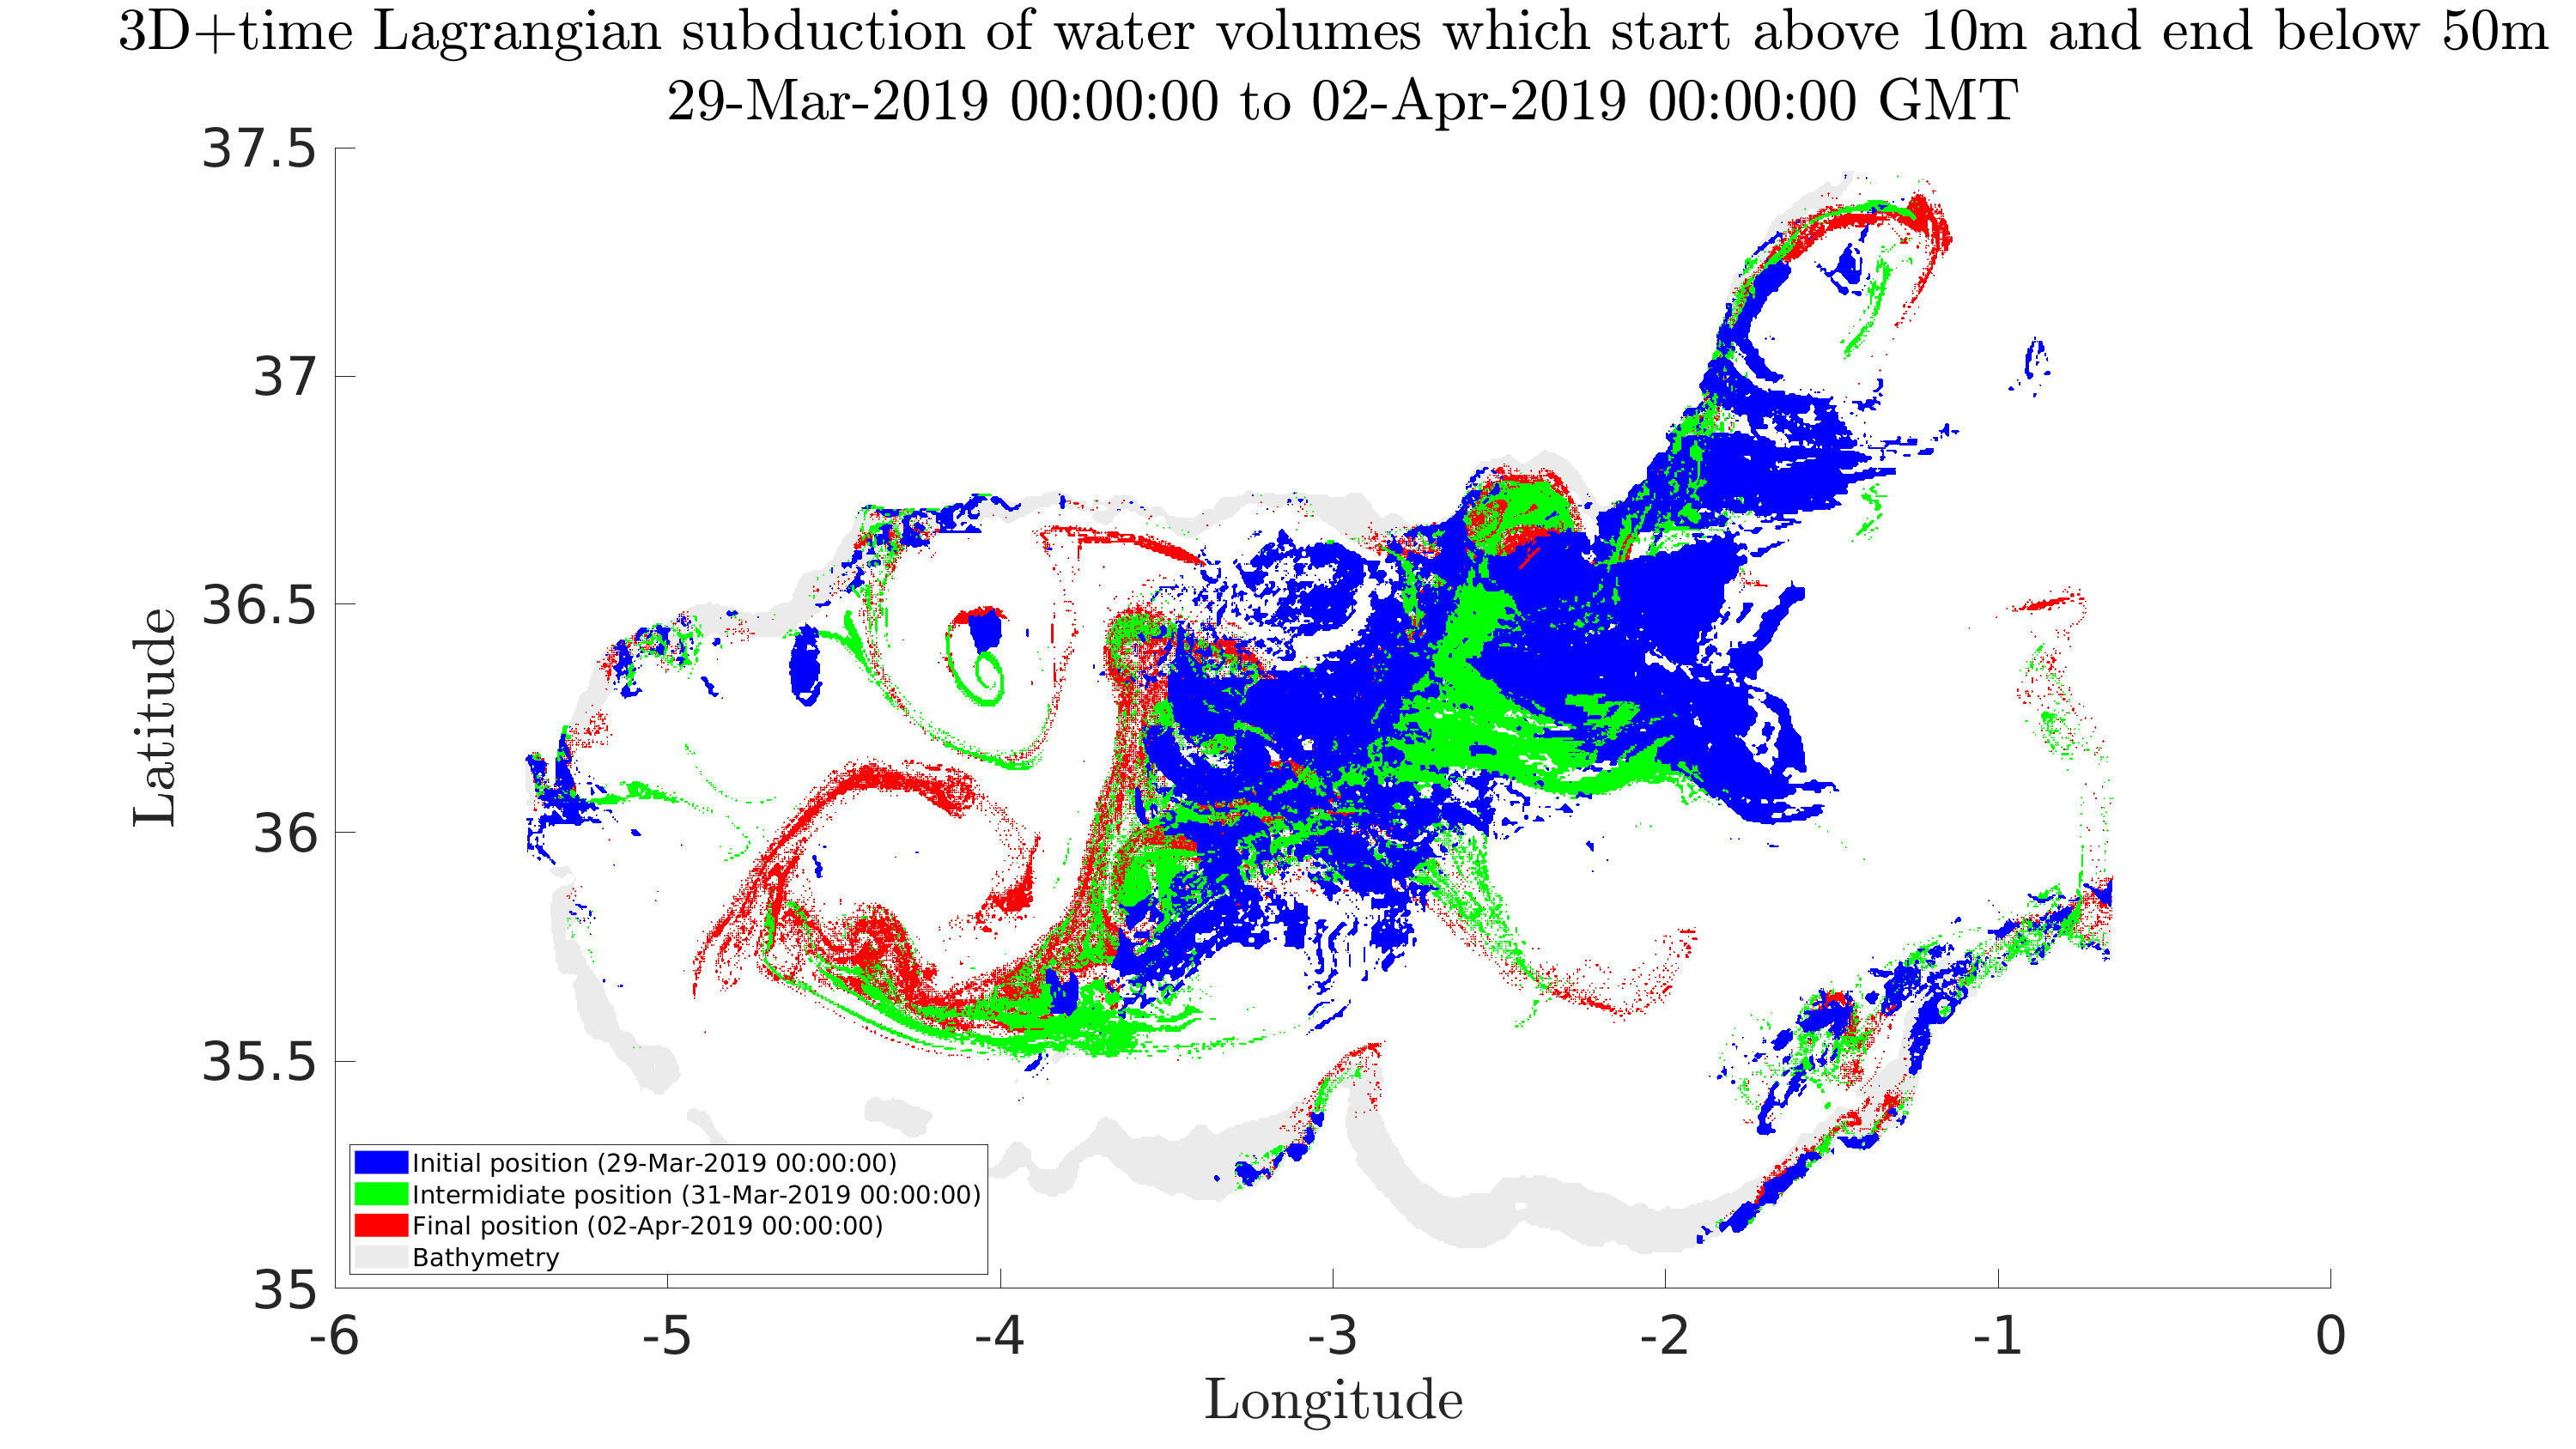
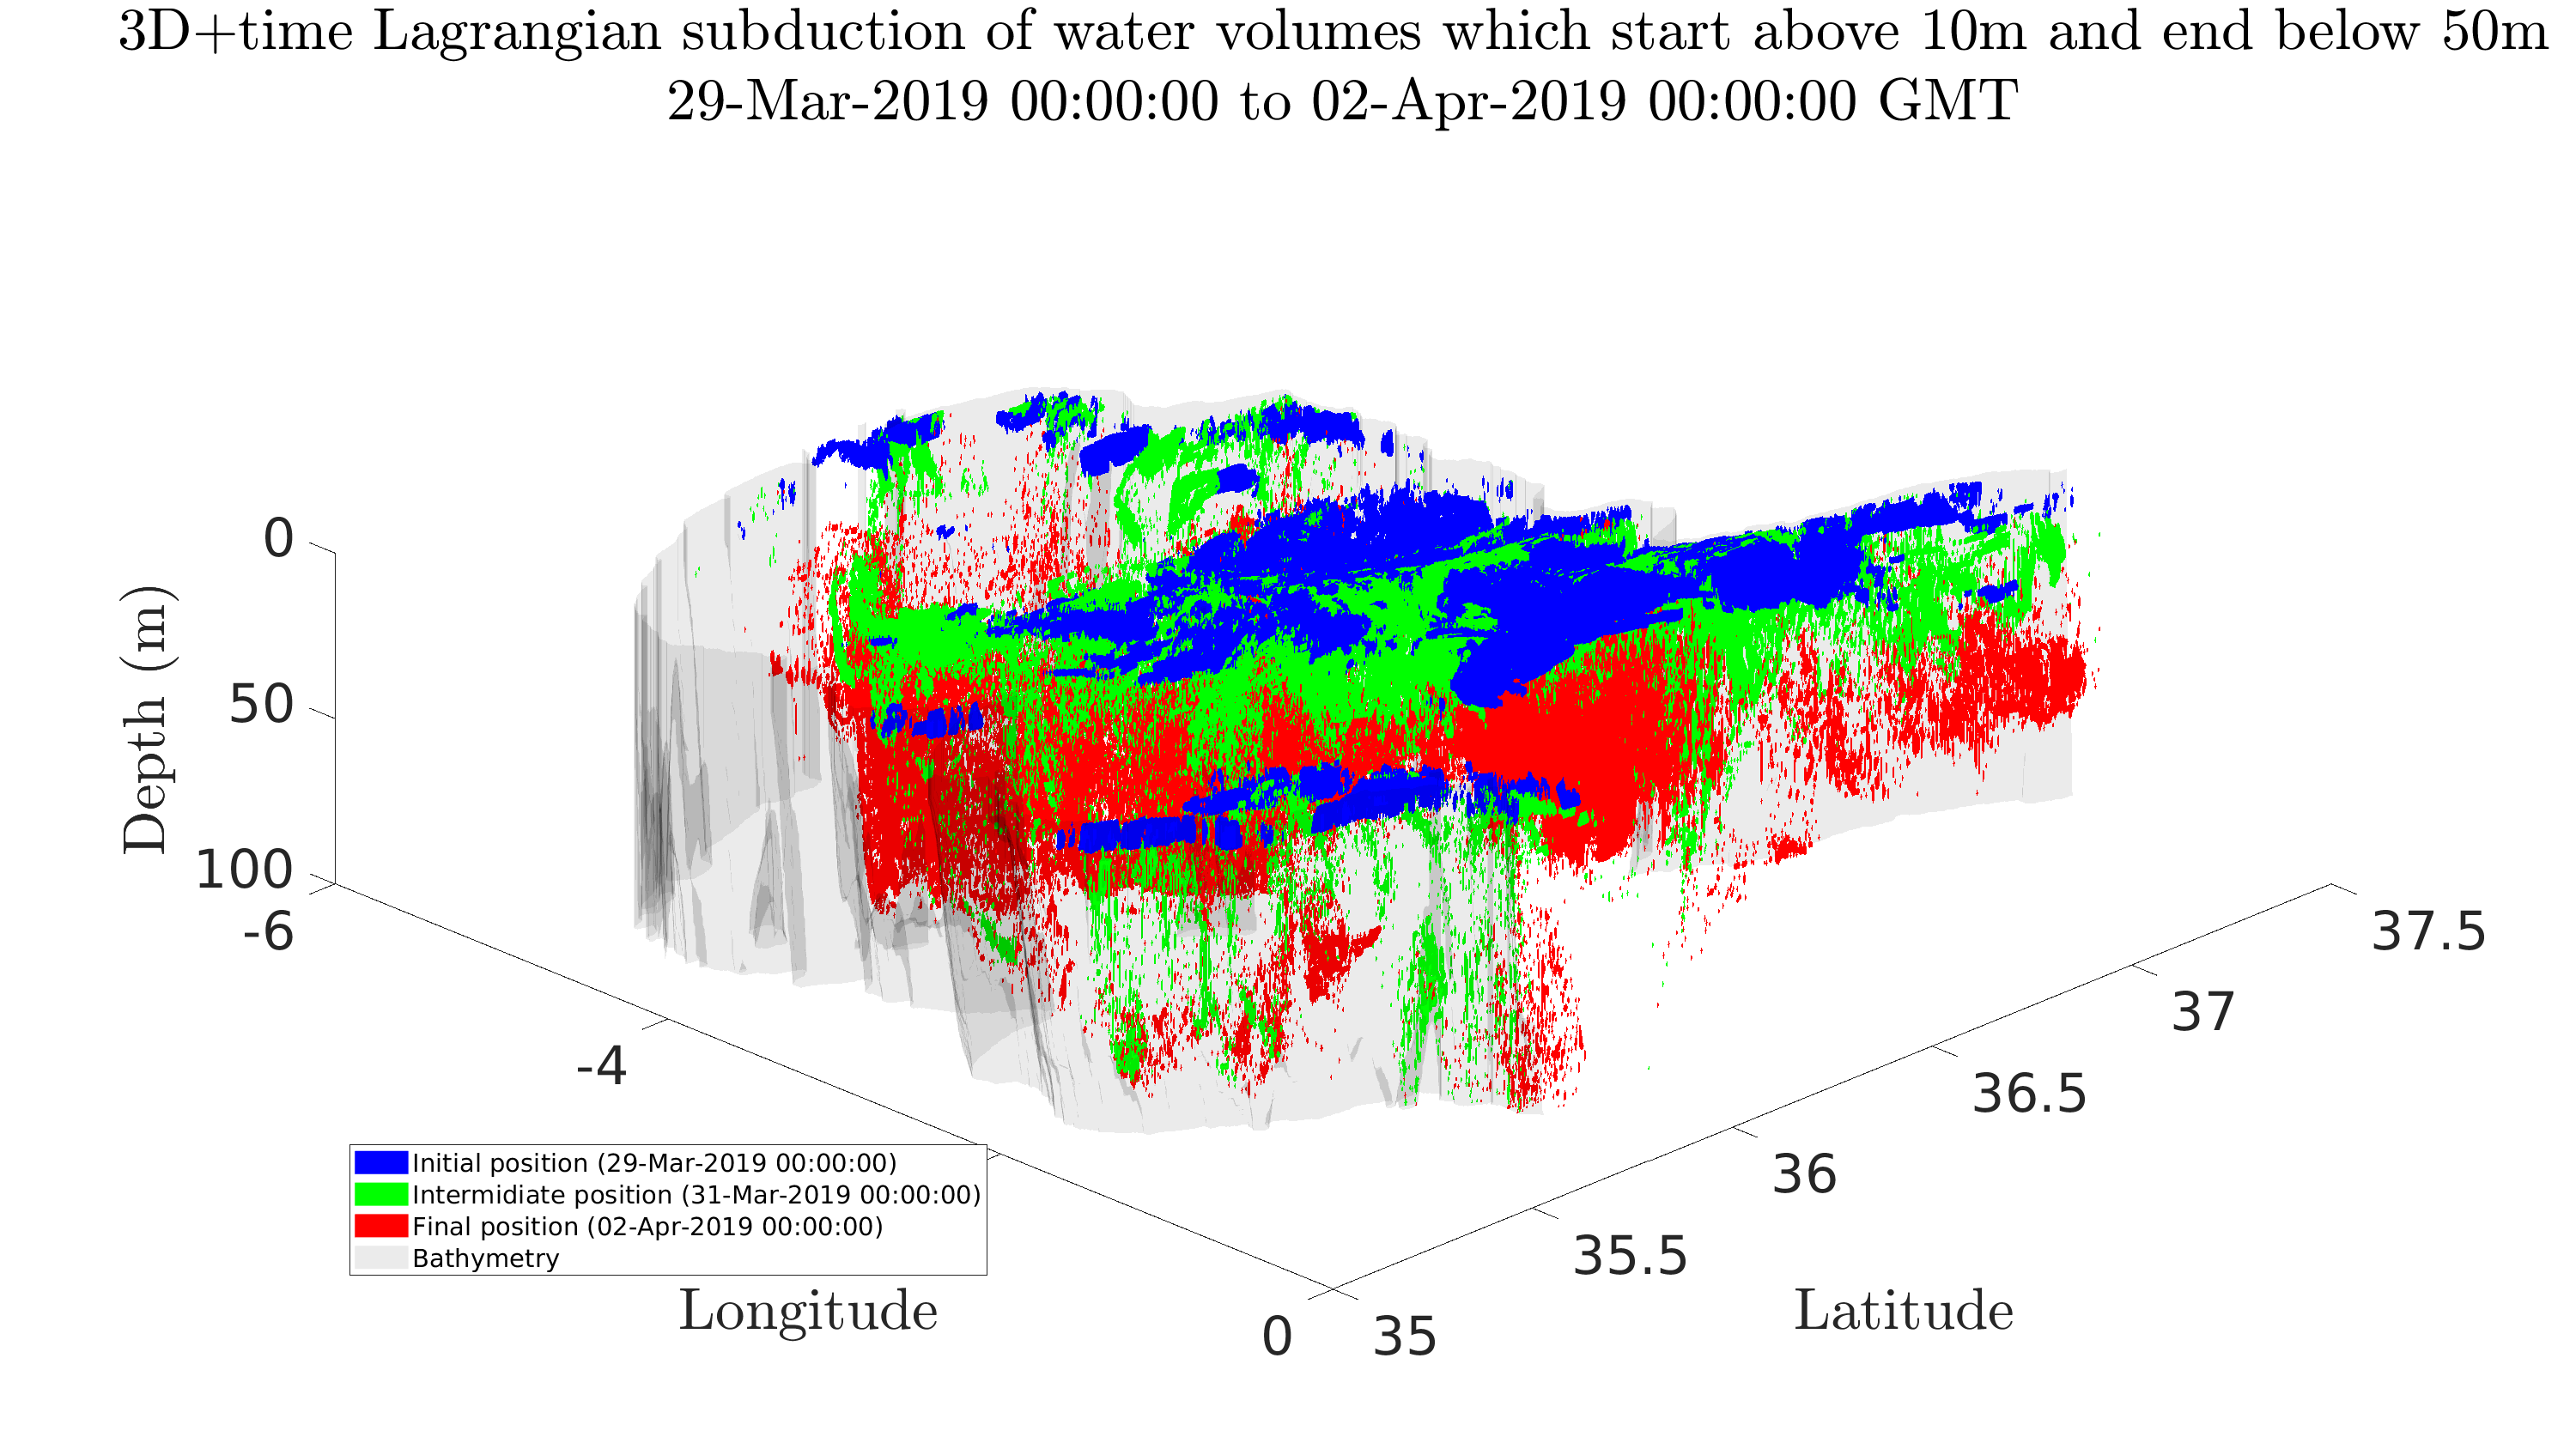
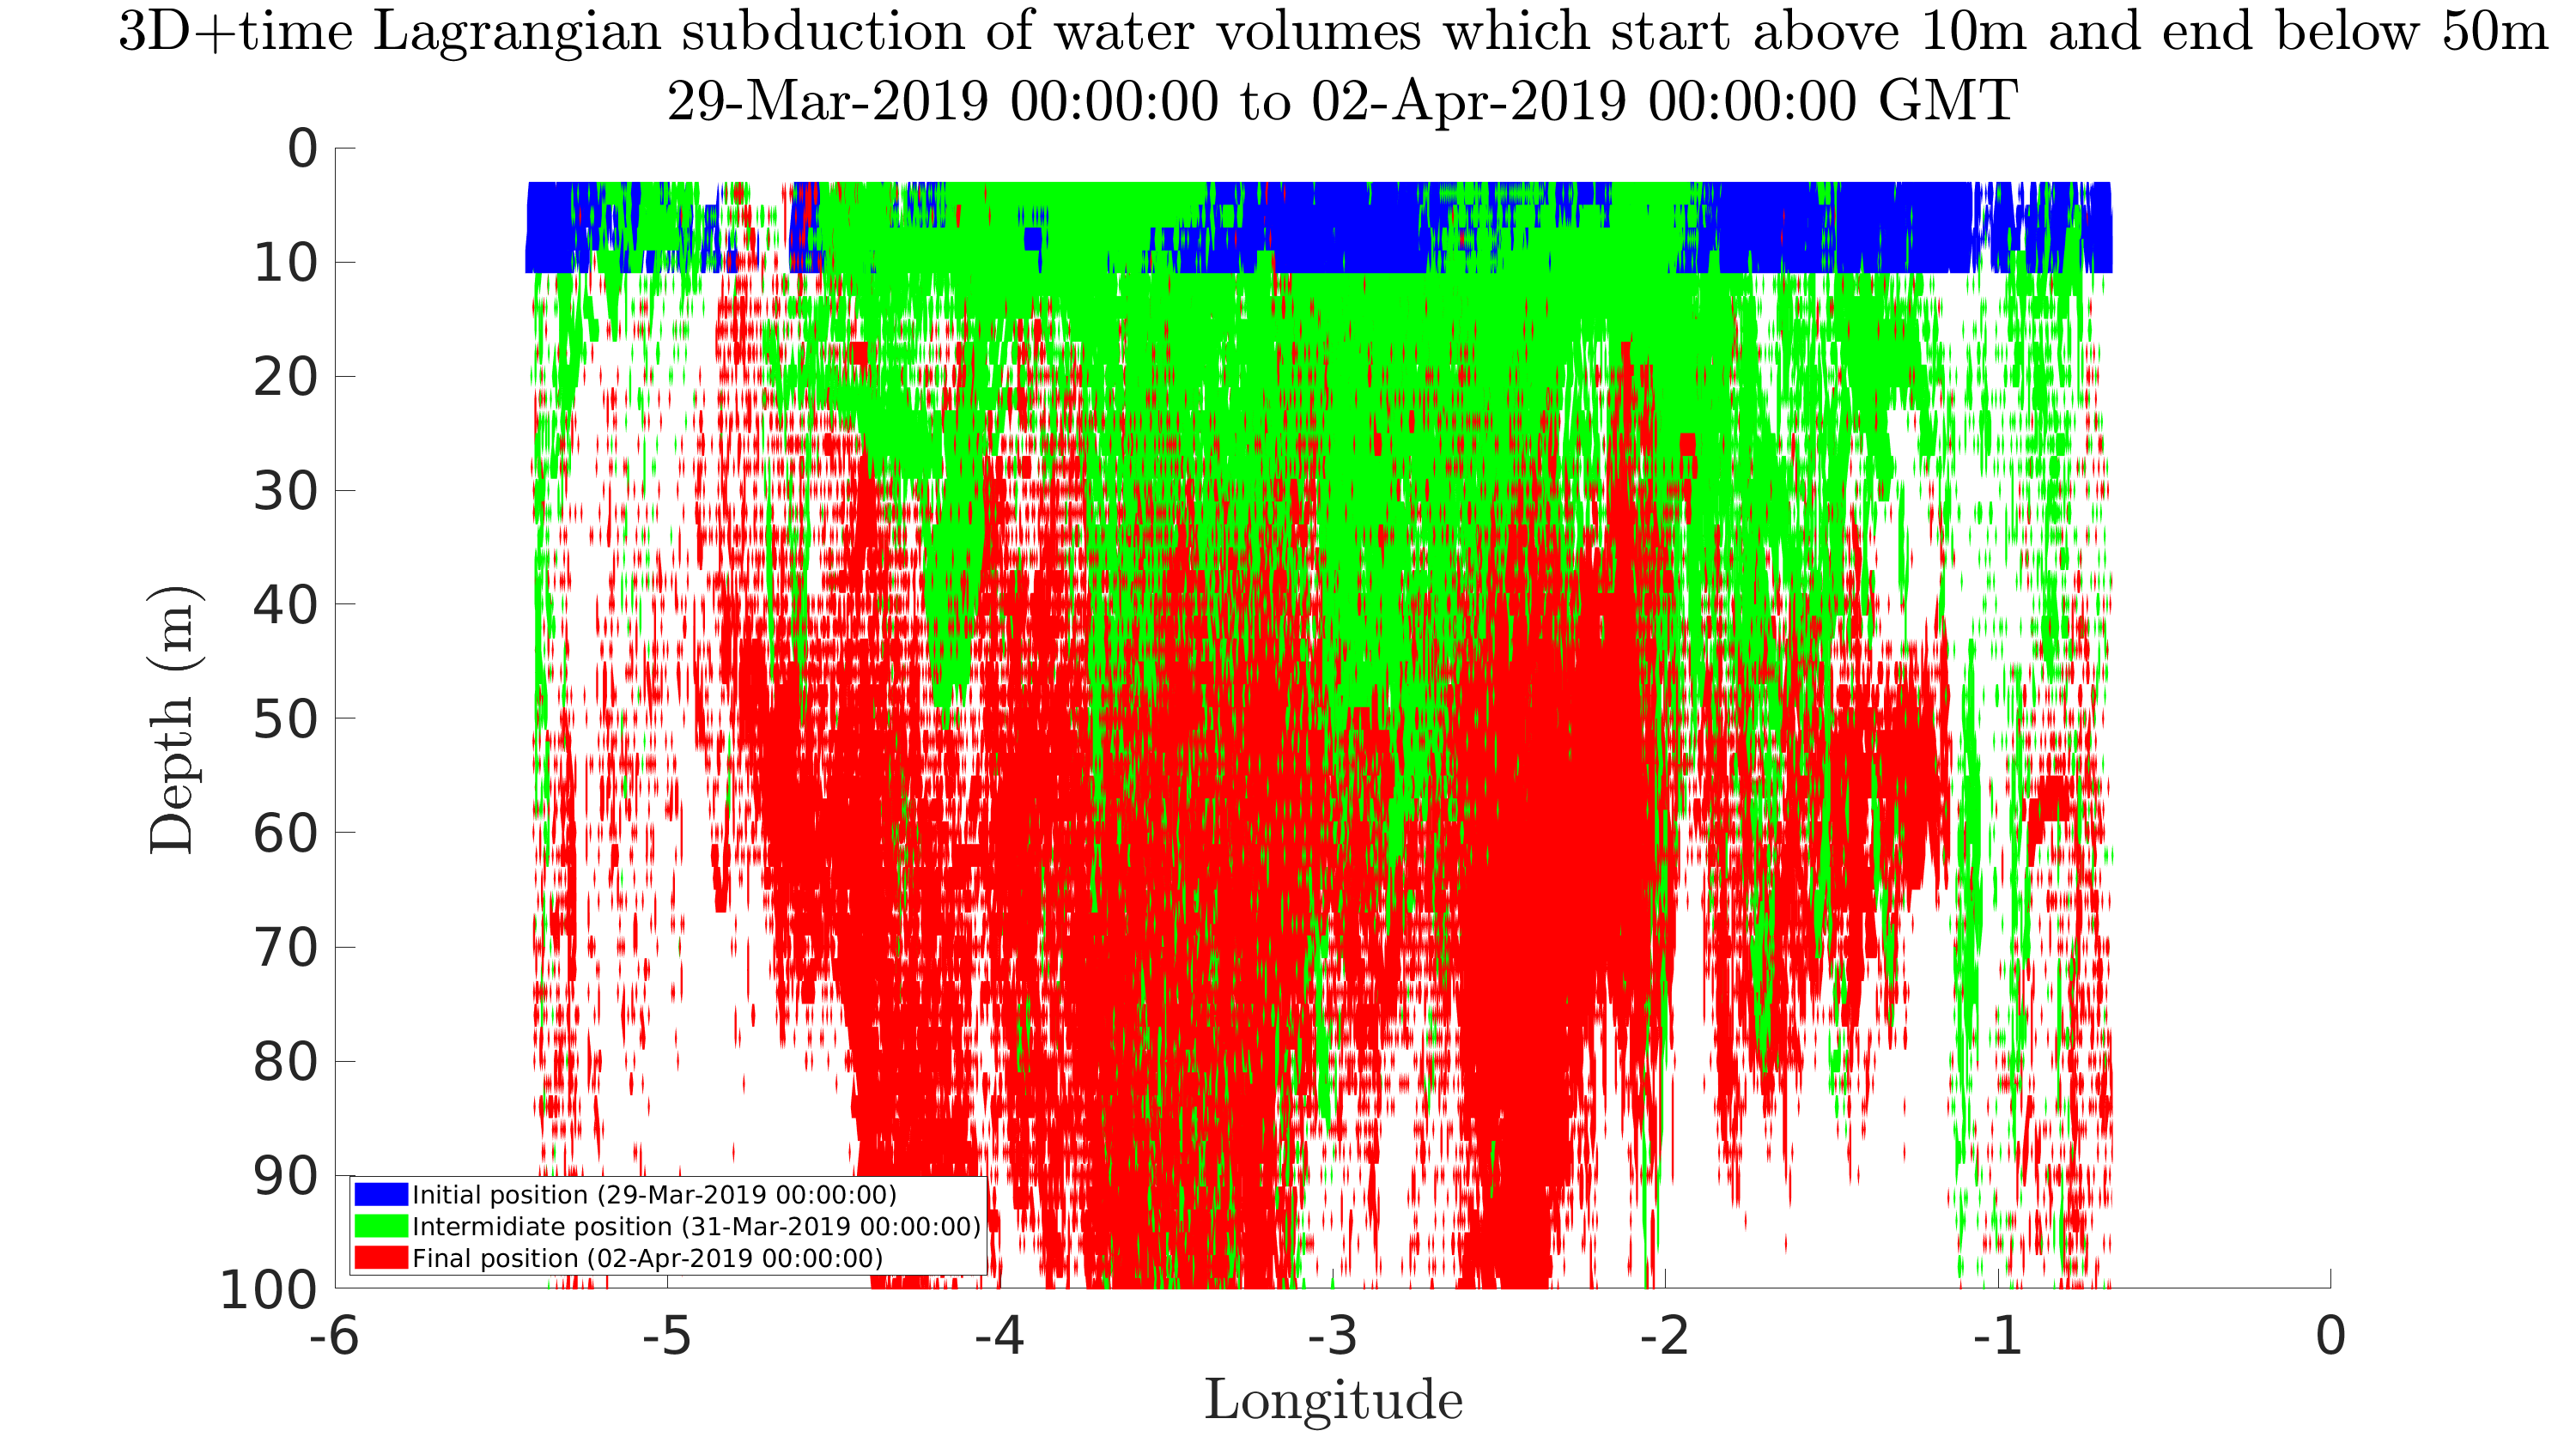
Below, the blue water volumes are the initial positions of these waters that start within 0-to-10 m depths and reach 50m after 4 days. These water volumes are advected using a flowmap-based and composition-based advection scheme, using our MSEAS forecast of the 3D ocean currents (u, v and w). The green water volumes represent the location of the parcels after two days while the red water volumes represent the final location after 4 days. The combined figures in the last row show the 3D water volumes, overlaid, at the 3 different times.
The figures for 29 Mar 0000Z to 2 Apr 0000Z 2019 presented below illustrate the MSEAS forecast of 3D subduction. The new (sub)-mesoscale eddies and frontal structures created south of the Spanish coastline by release of kinetic energy input by the strong winds are now interacting. The 3D subduction mainly takes place along these eddies and fronts (e.g. deep sinking in thin sheets along convergent/attracting fronts and edges of eddies, etc.). After 4 days, these waters are now going around parts of the weakened WAG and of the meandering Atlantic Jet. These subducted waters then spread at depth.
| Time & Depths | Top View | 3D View | Side View |
|---|---|---|---|
| t0 and upper 10m |
|
|
|
| t0 + 48 hours |
|
|
|
| t0 + 96 hours and water reaching 60m |
|
|
|
Overlaid |
|
|
|
| Return to the MSEAS: | ||
| CALYPSO real-time web page | CALYPSO web page | Home page |