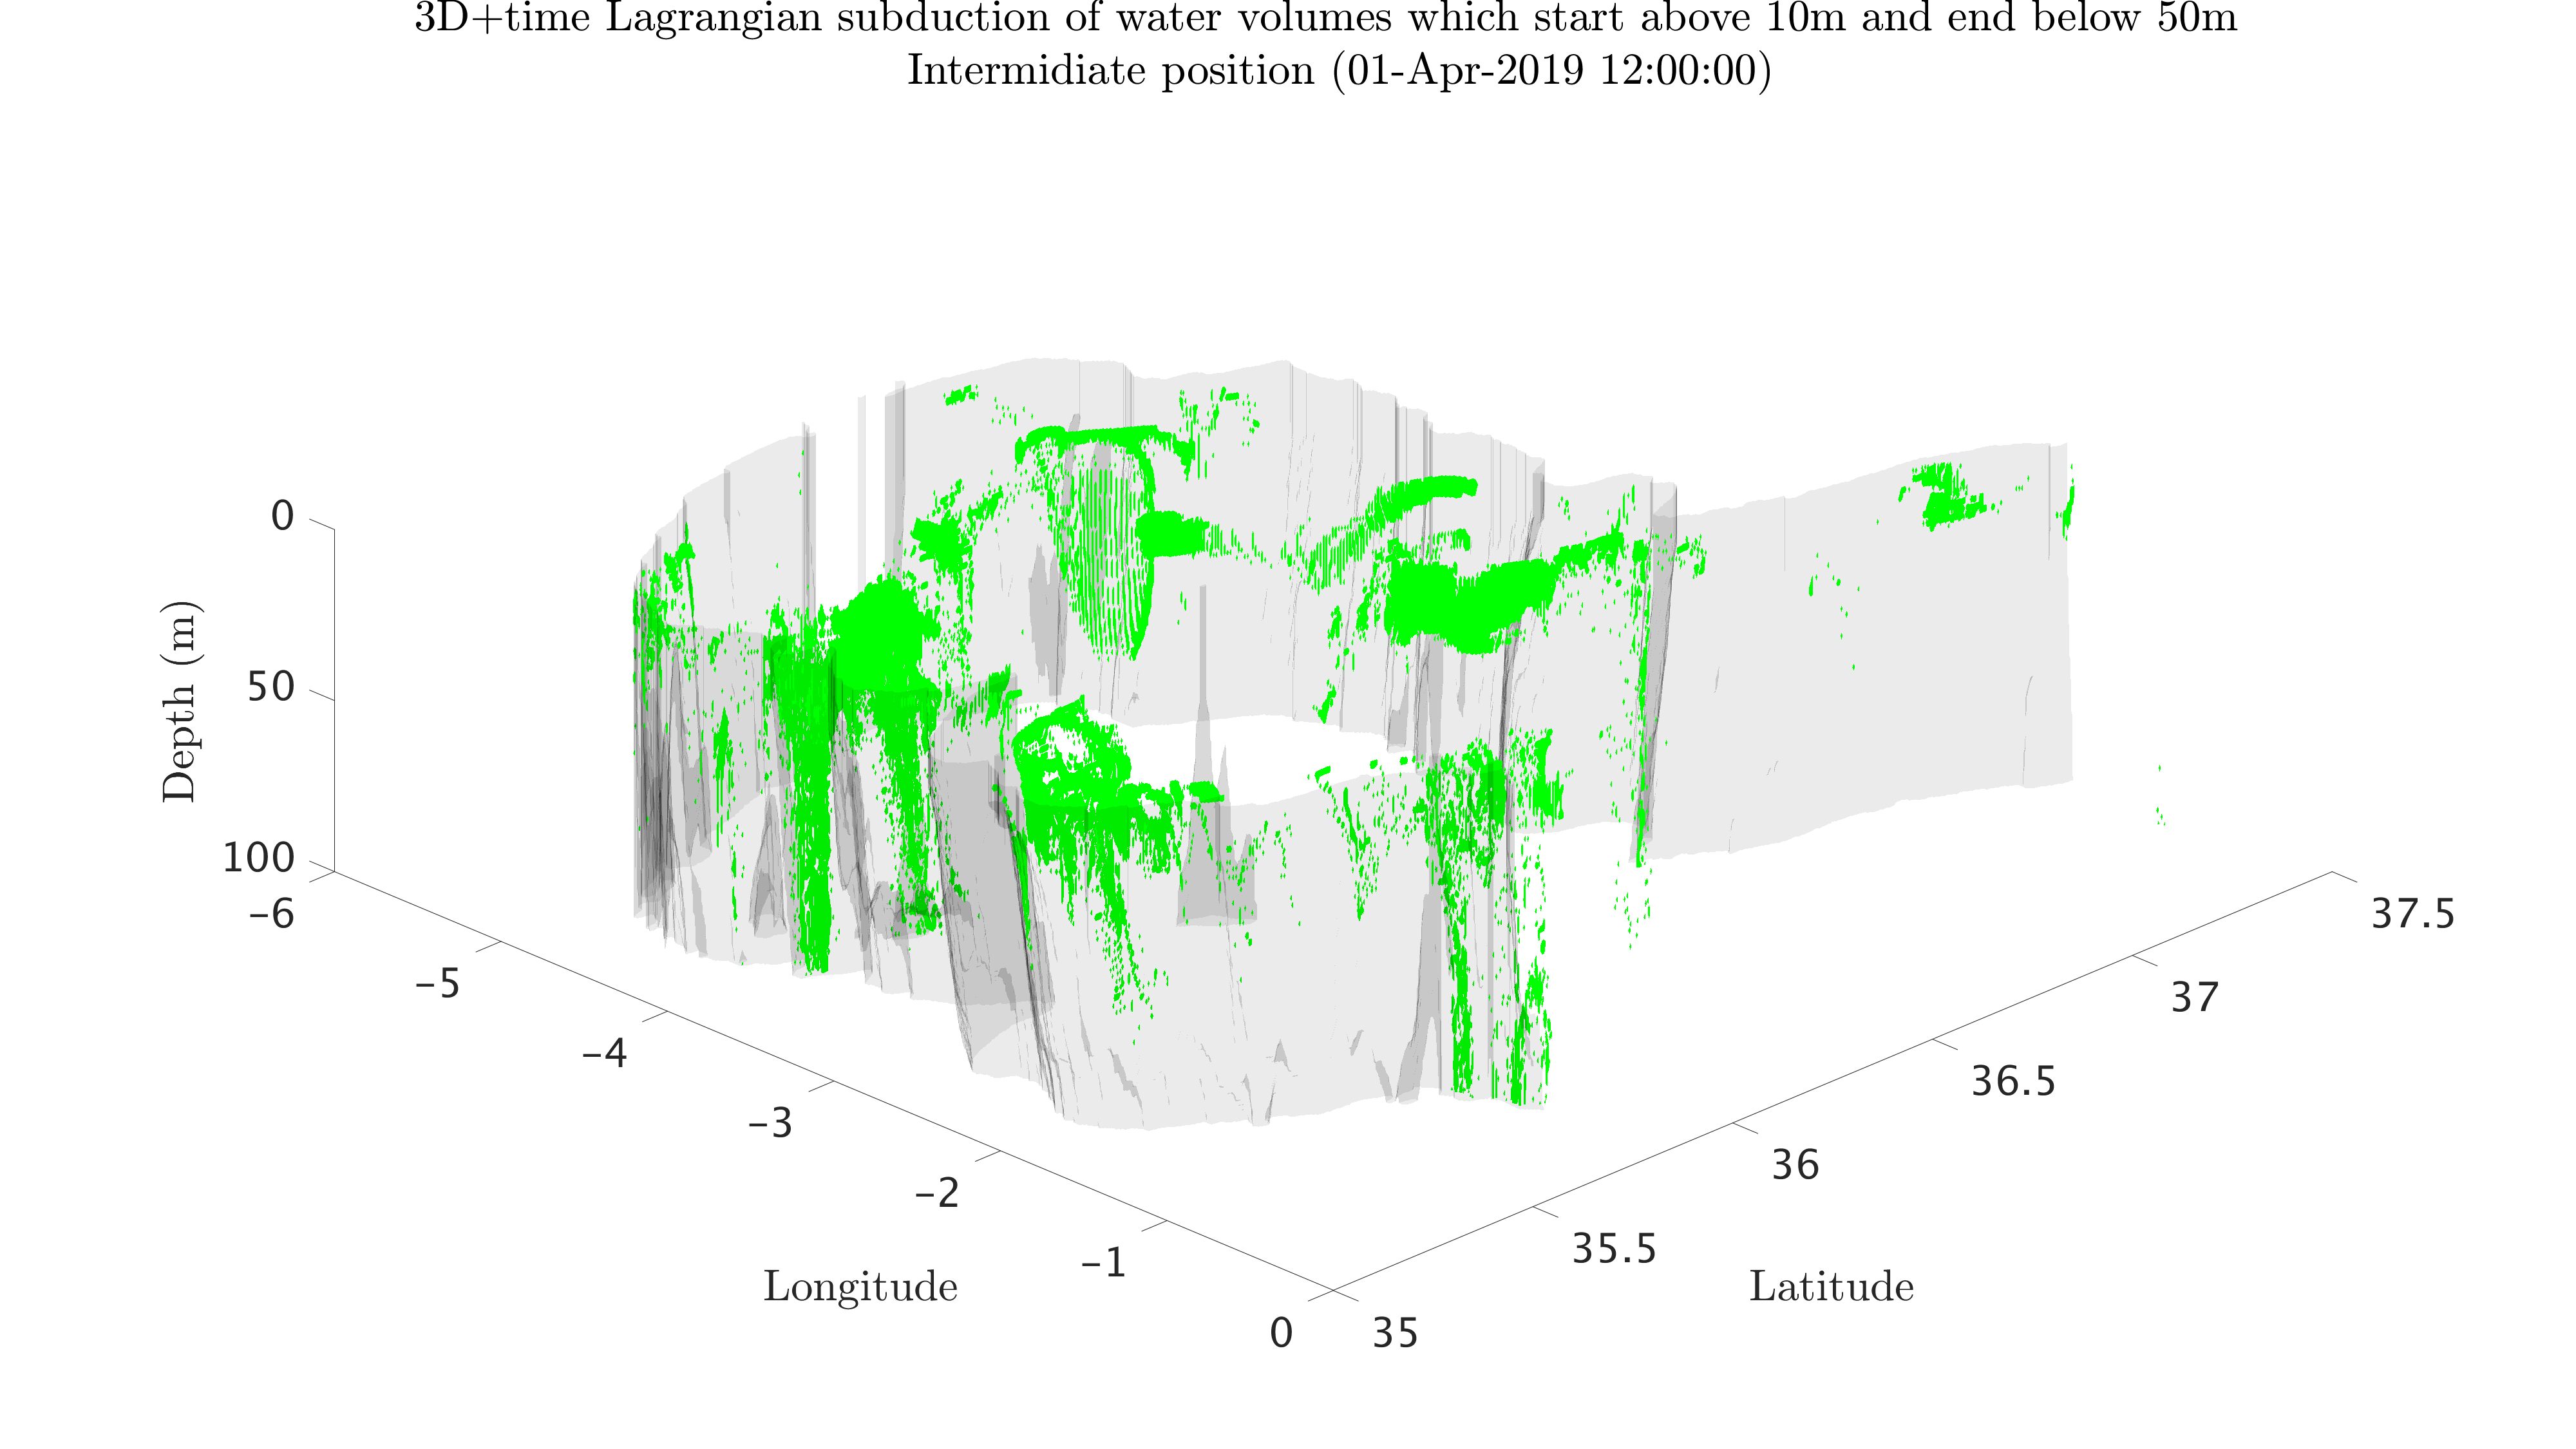
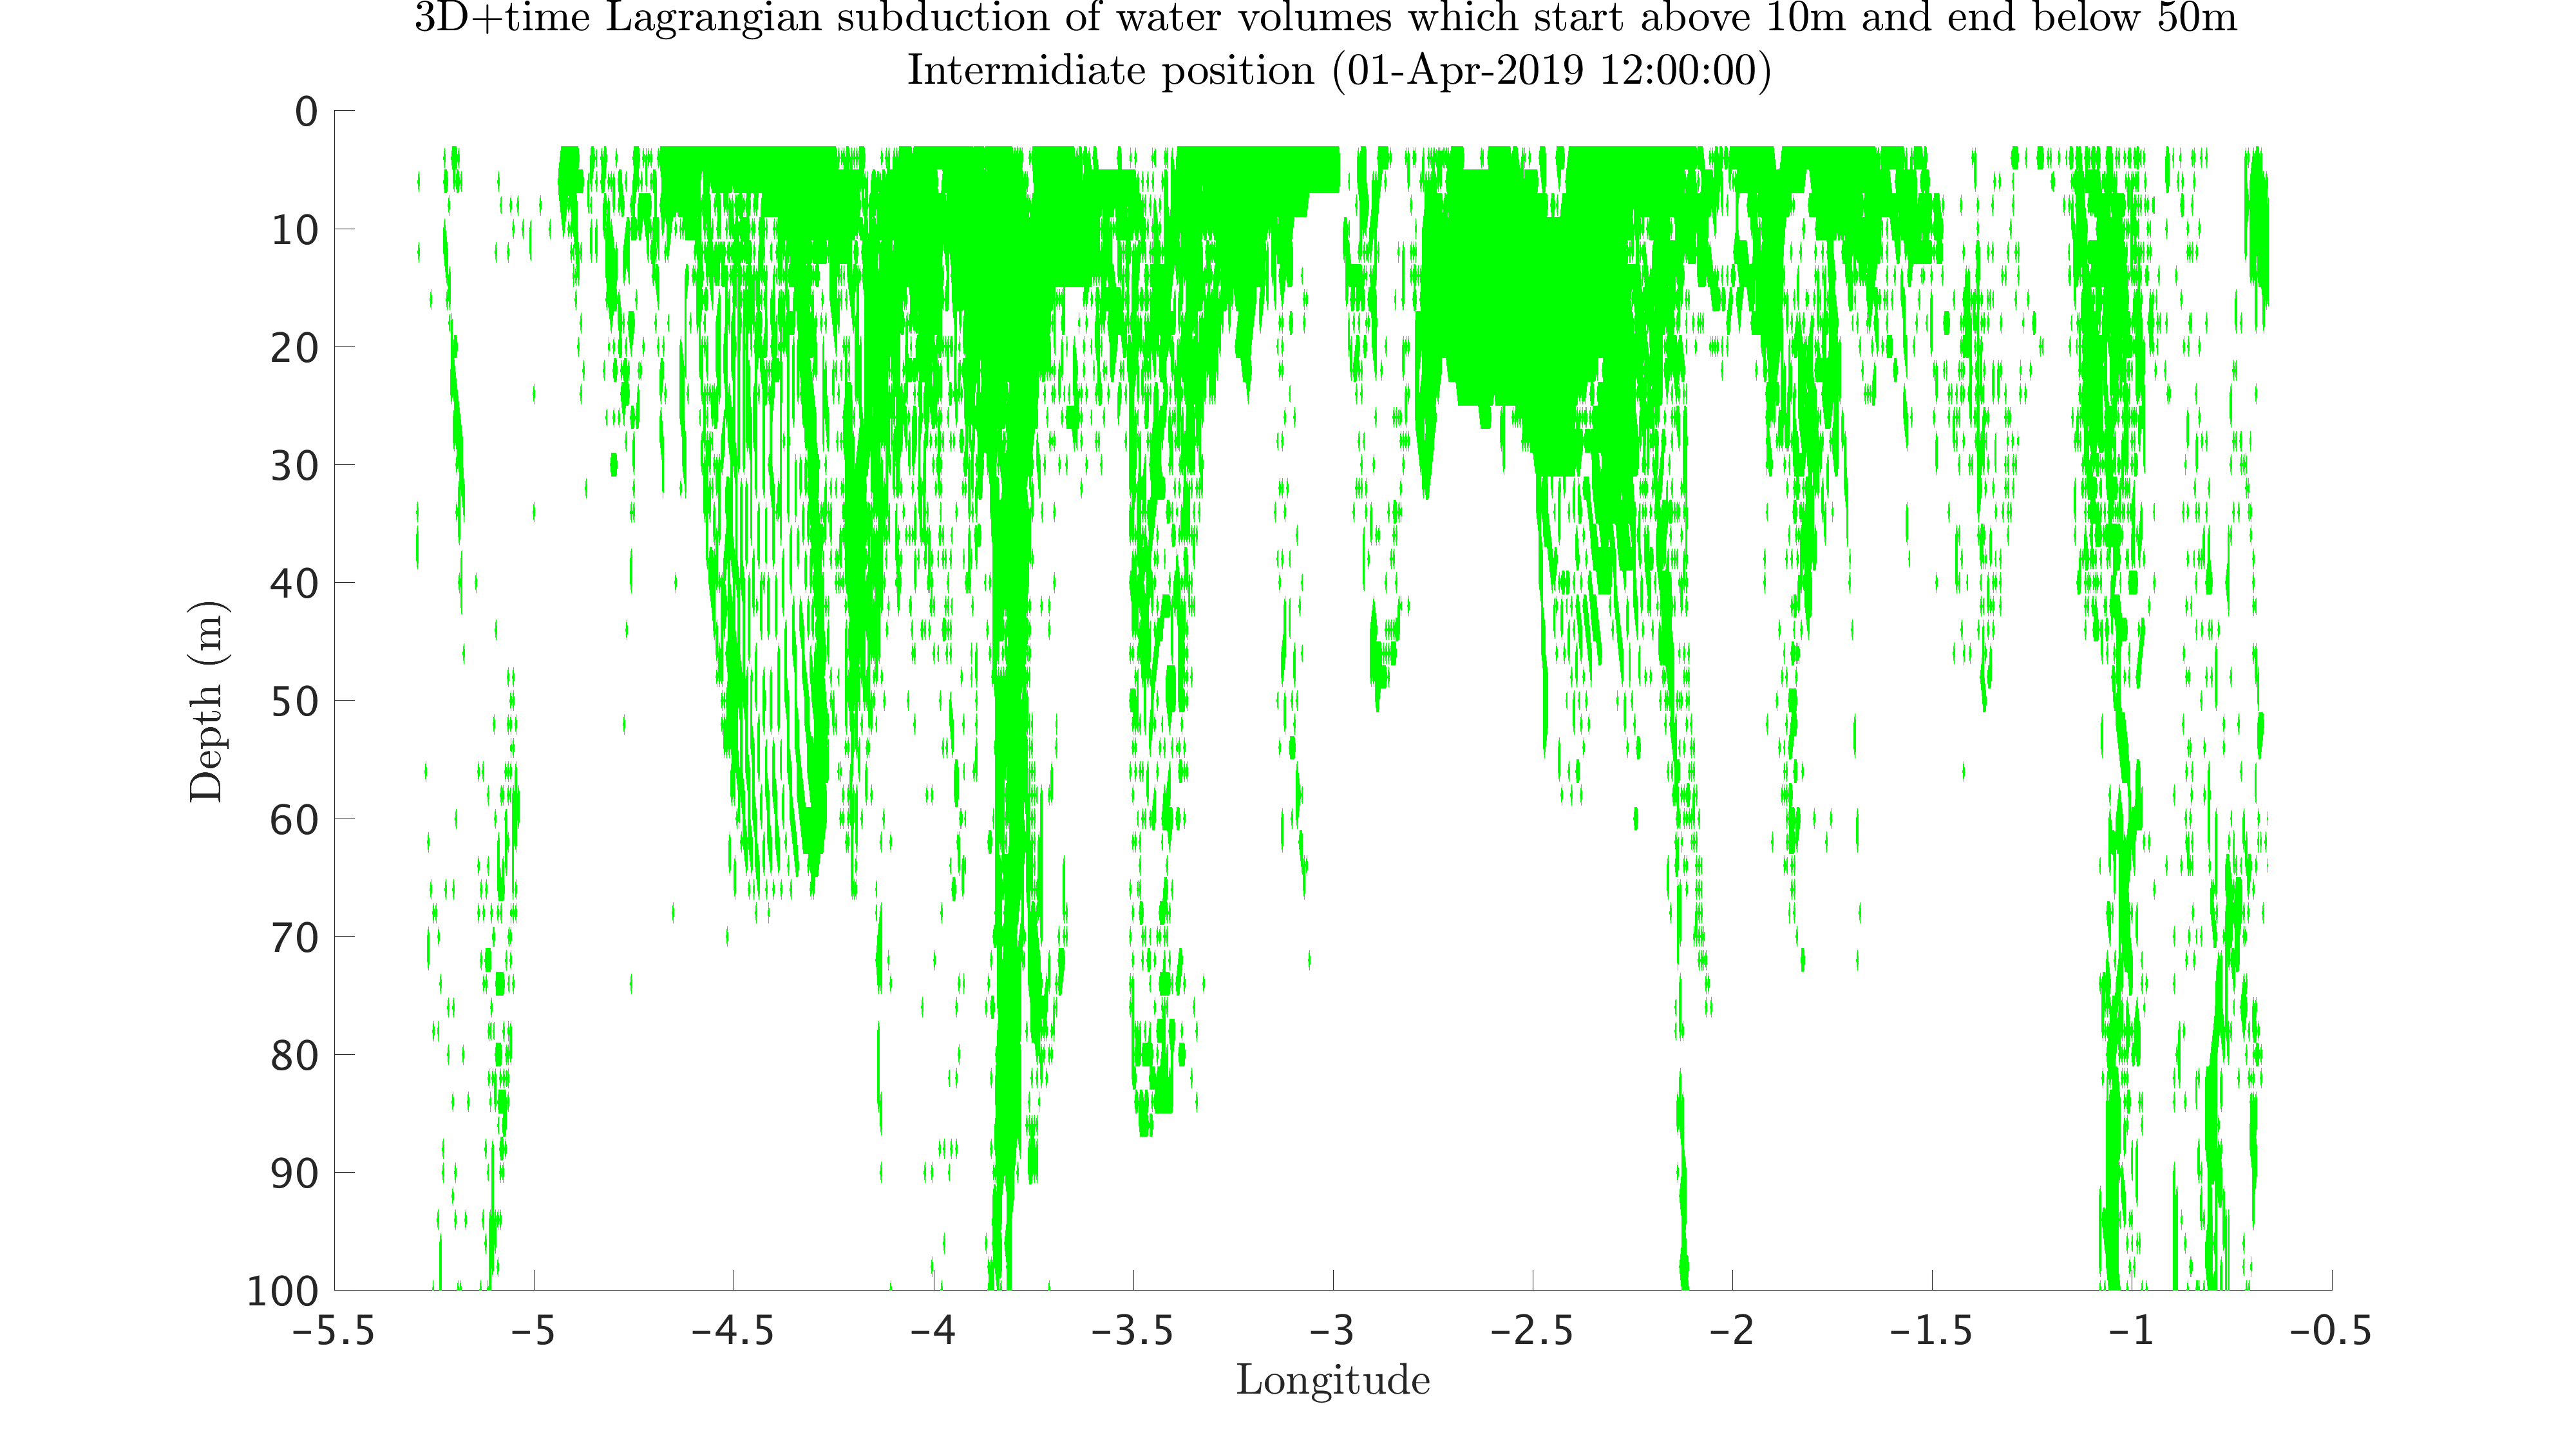
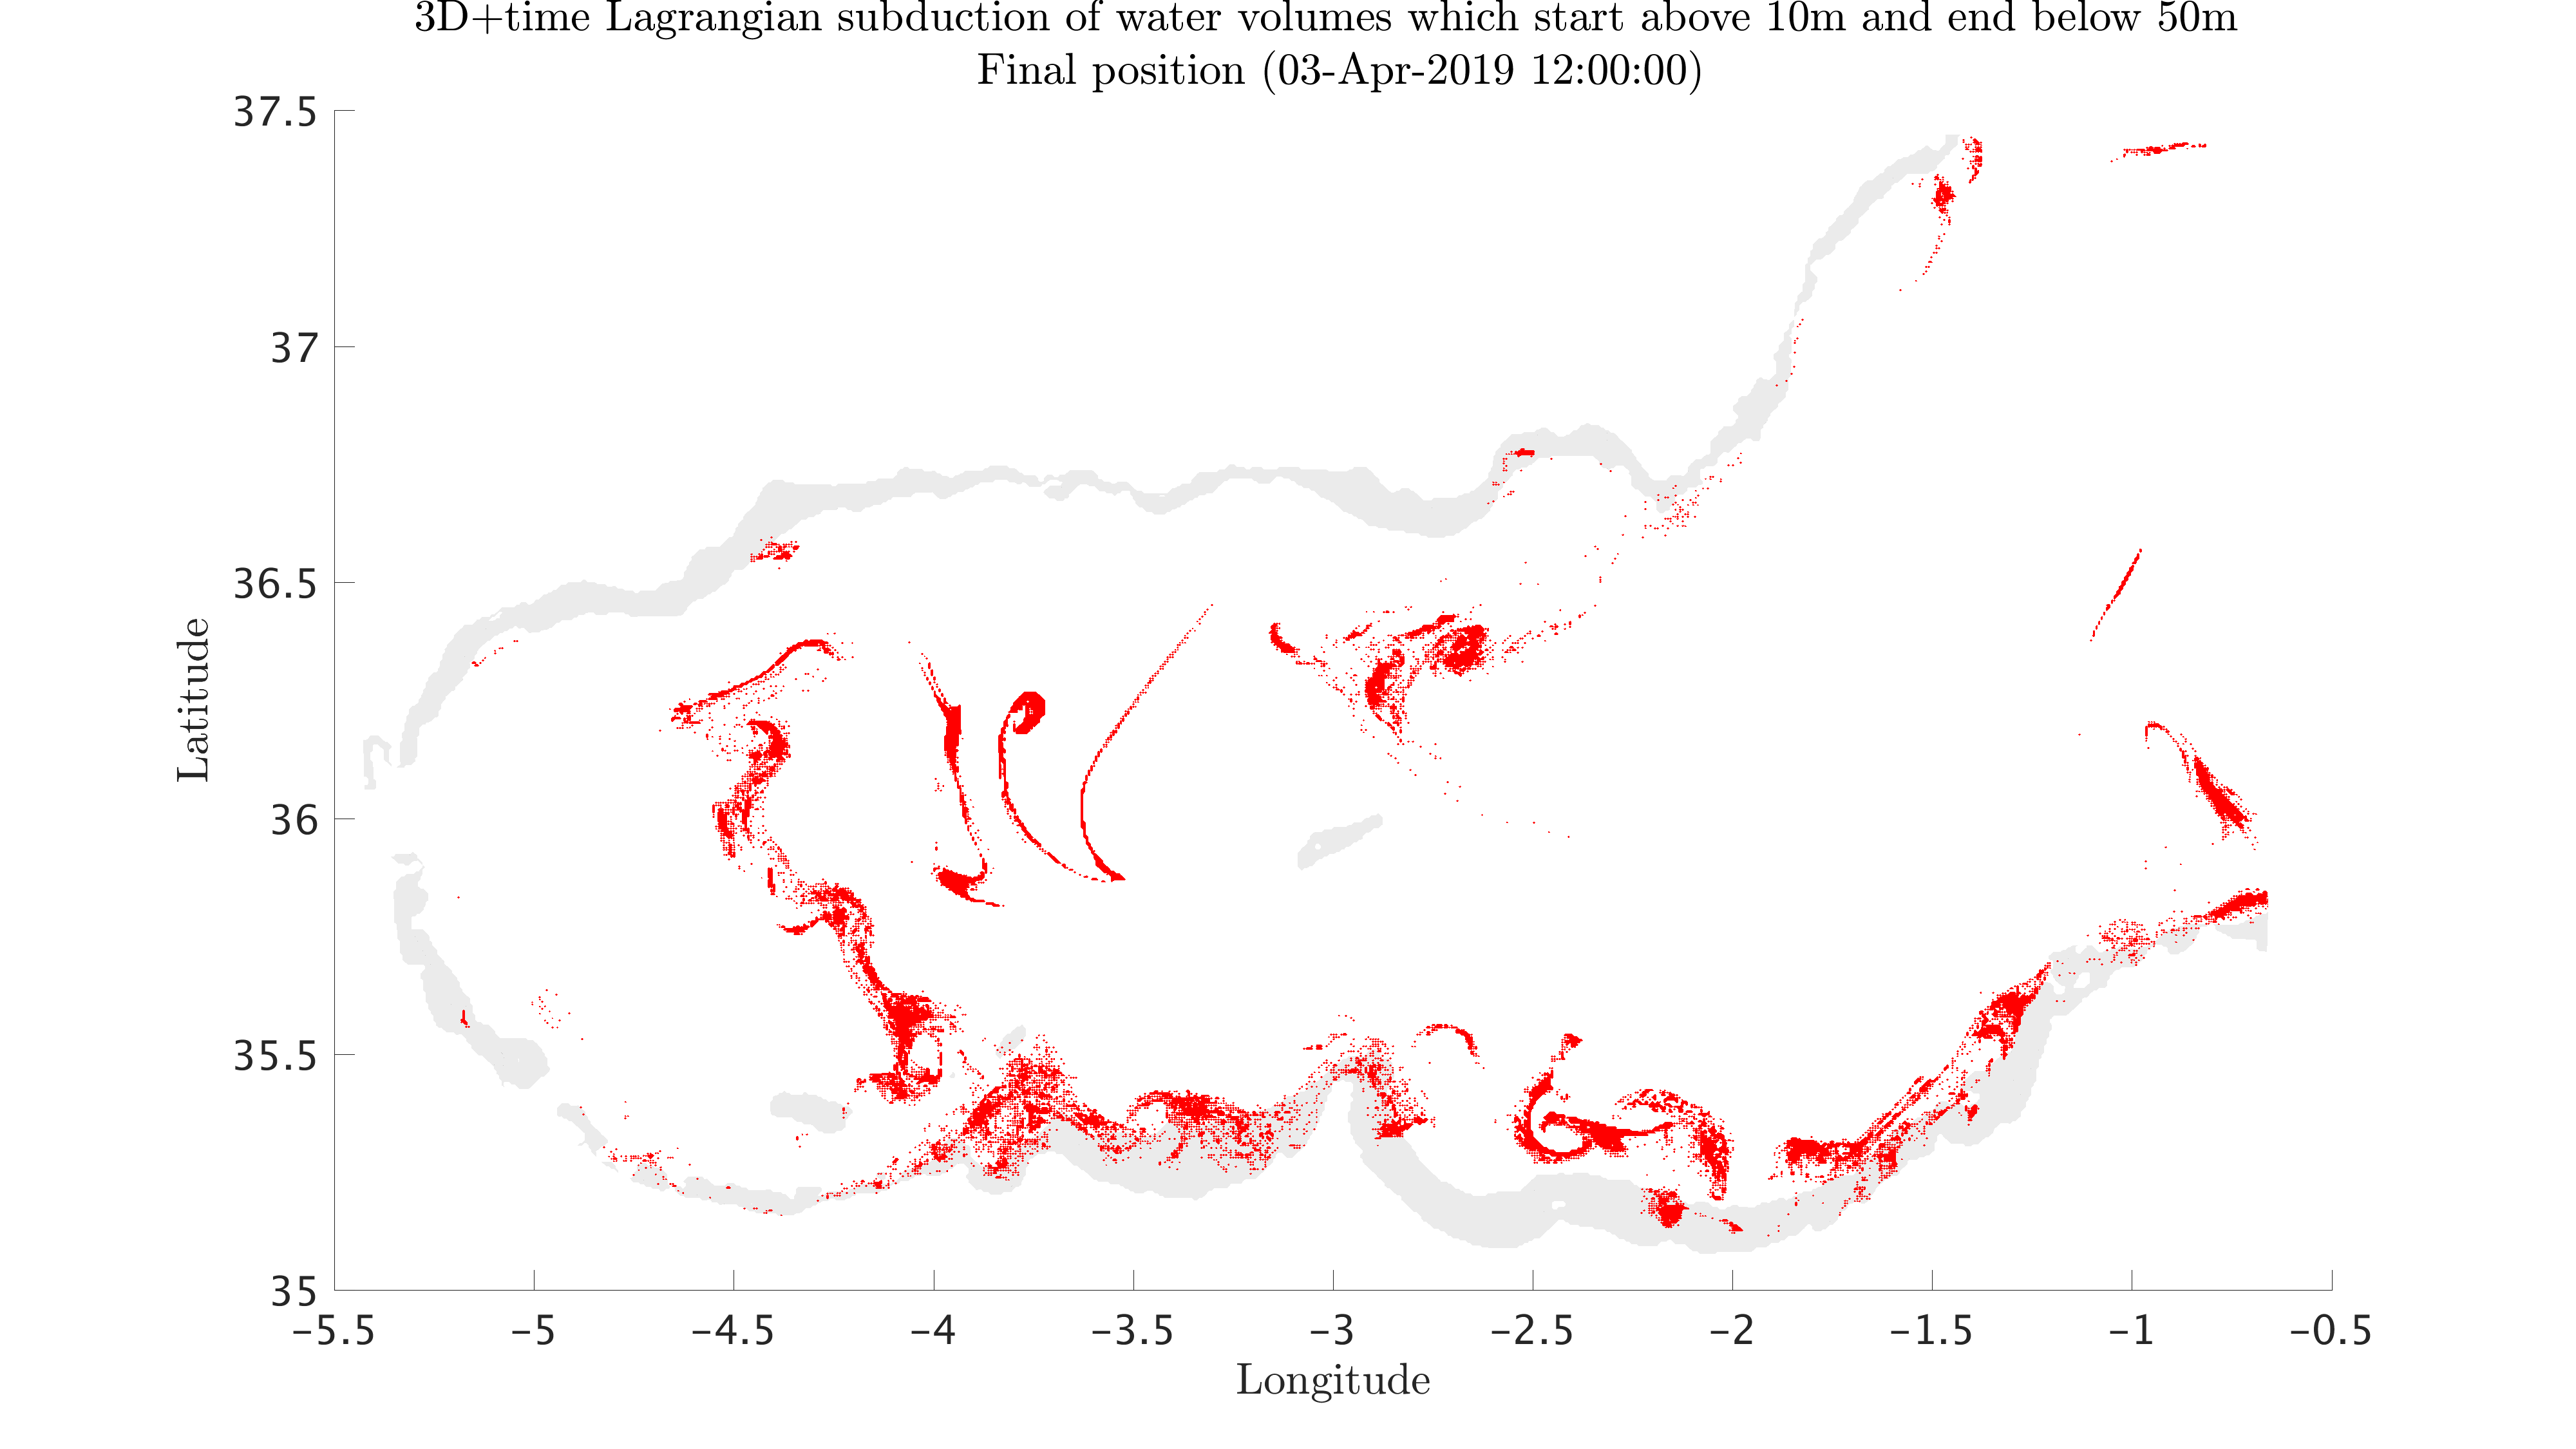
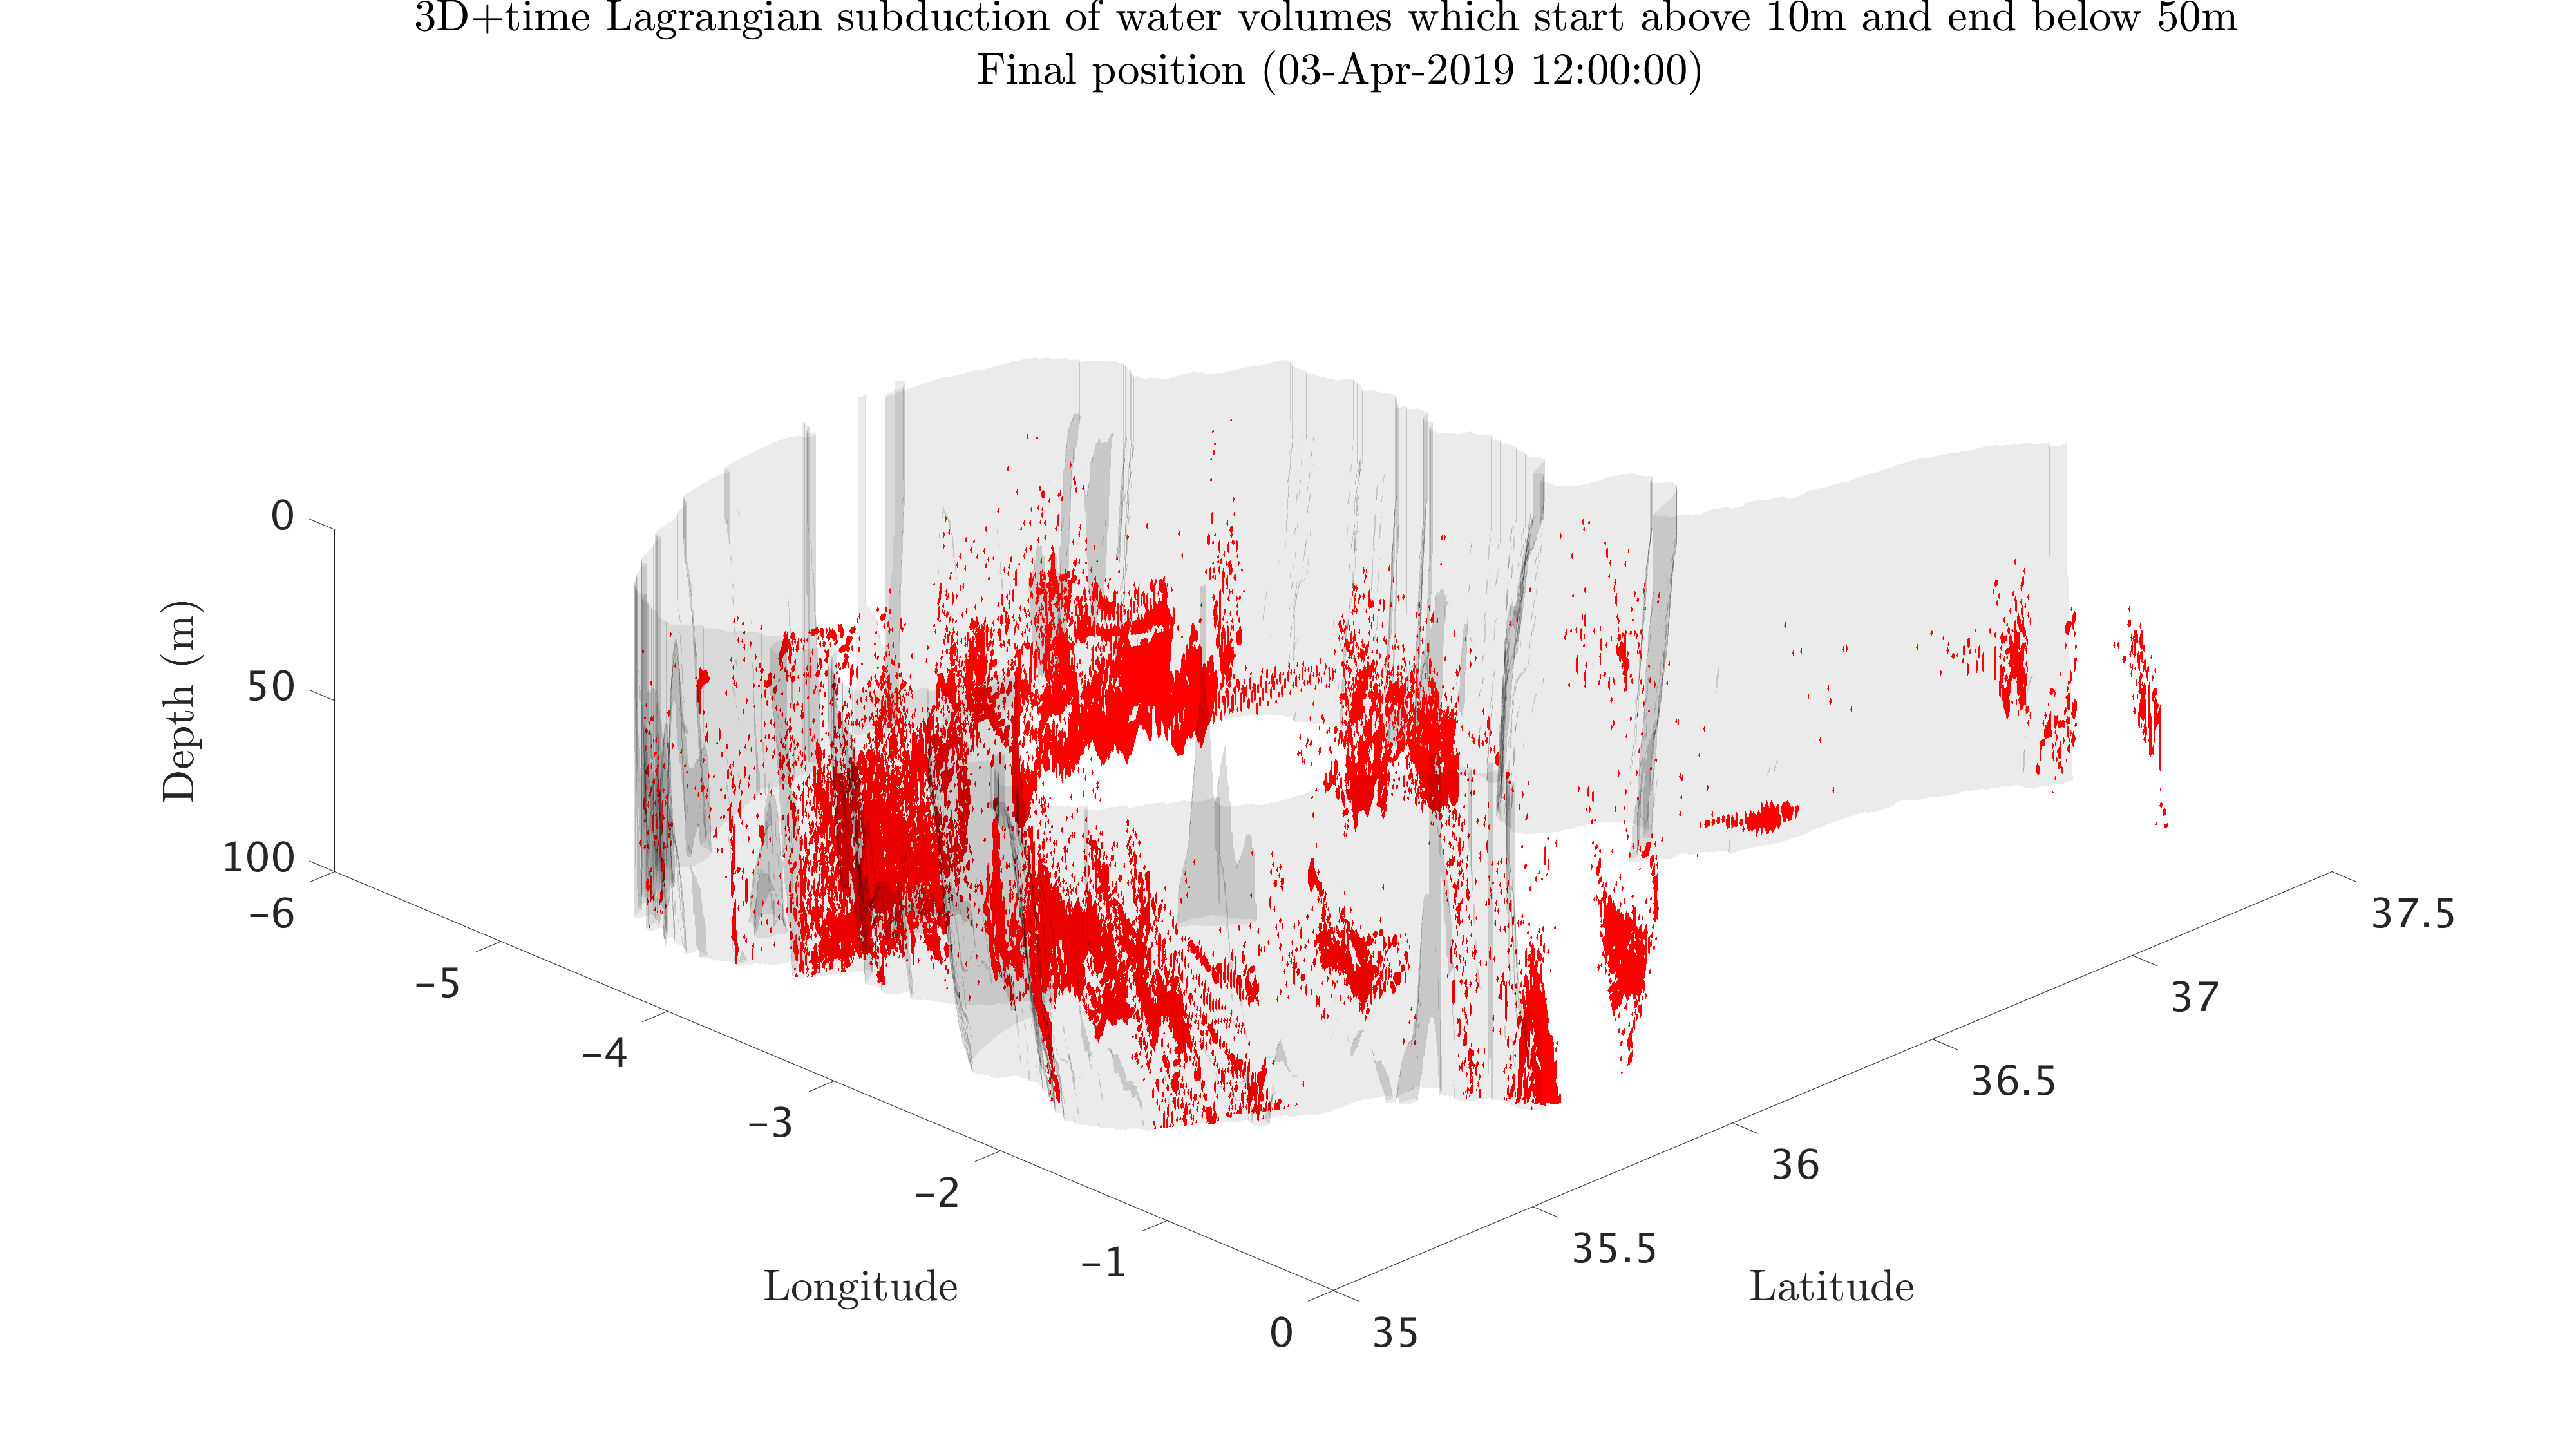
The following figures show the water volumes that are forecast to subduct in 3D (computed based on our MSEAS forward flowmap forecast) from the surface layers to deeper layers. They illustrate in 3D+time where these waters start, how they move, and where they end up.
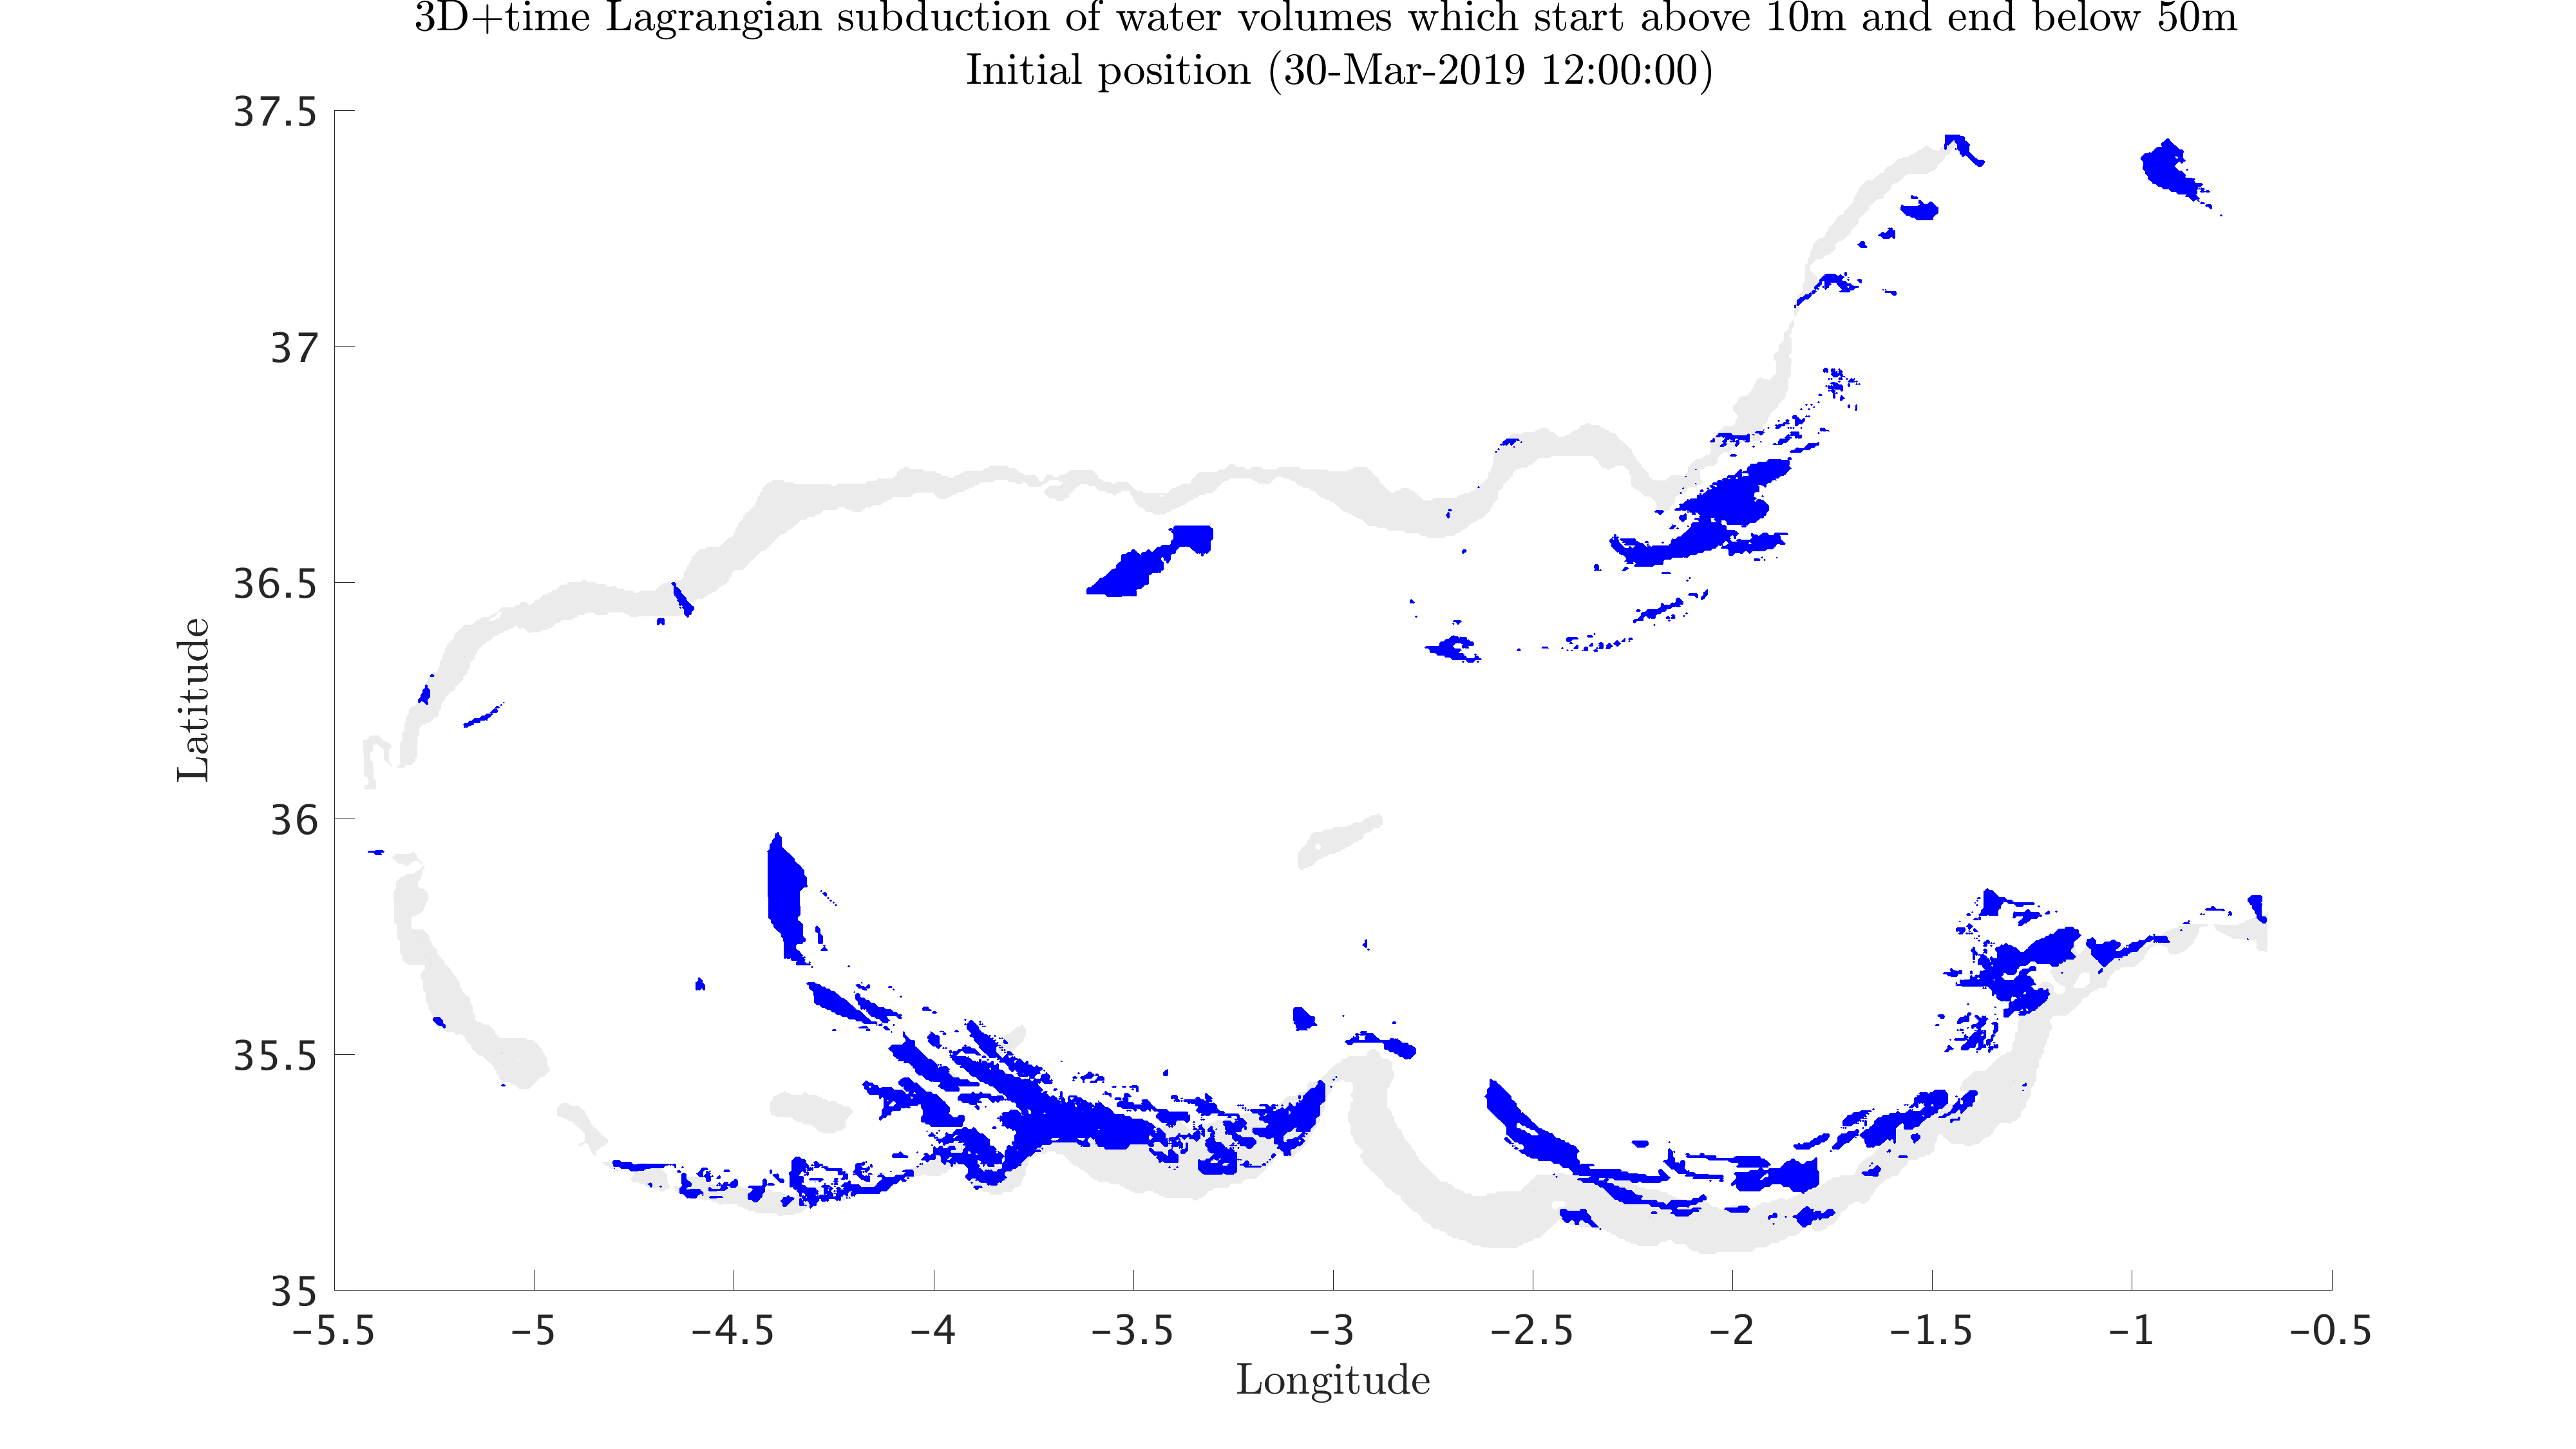
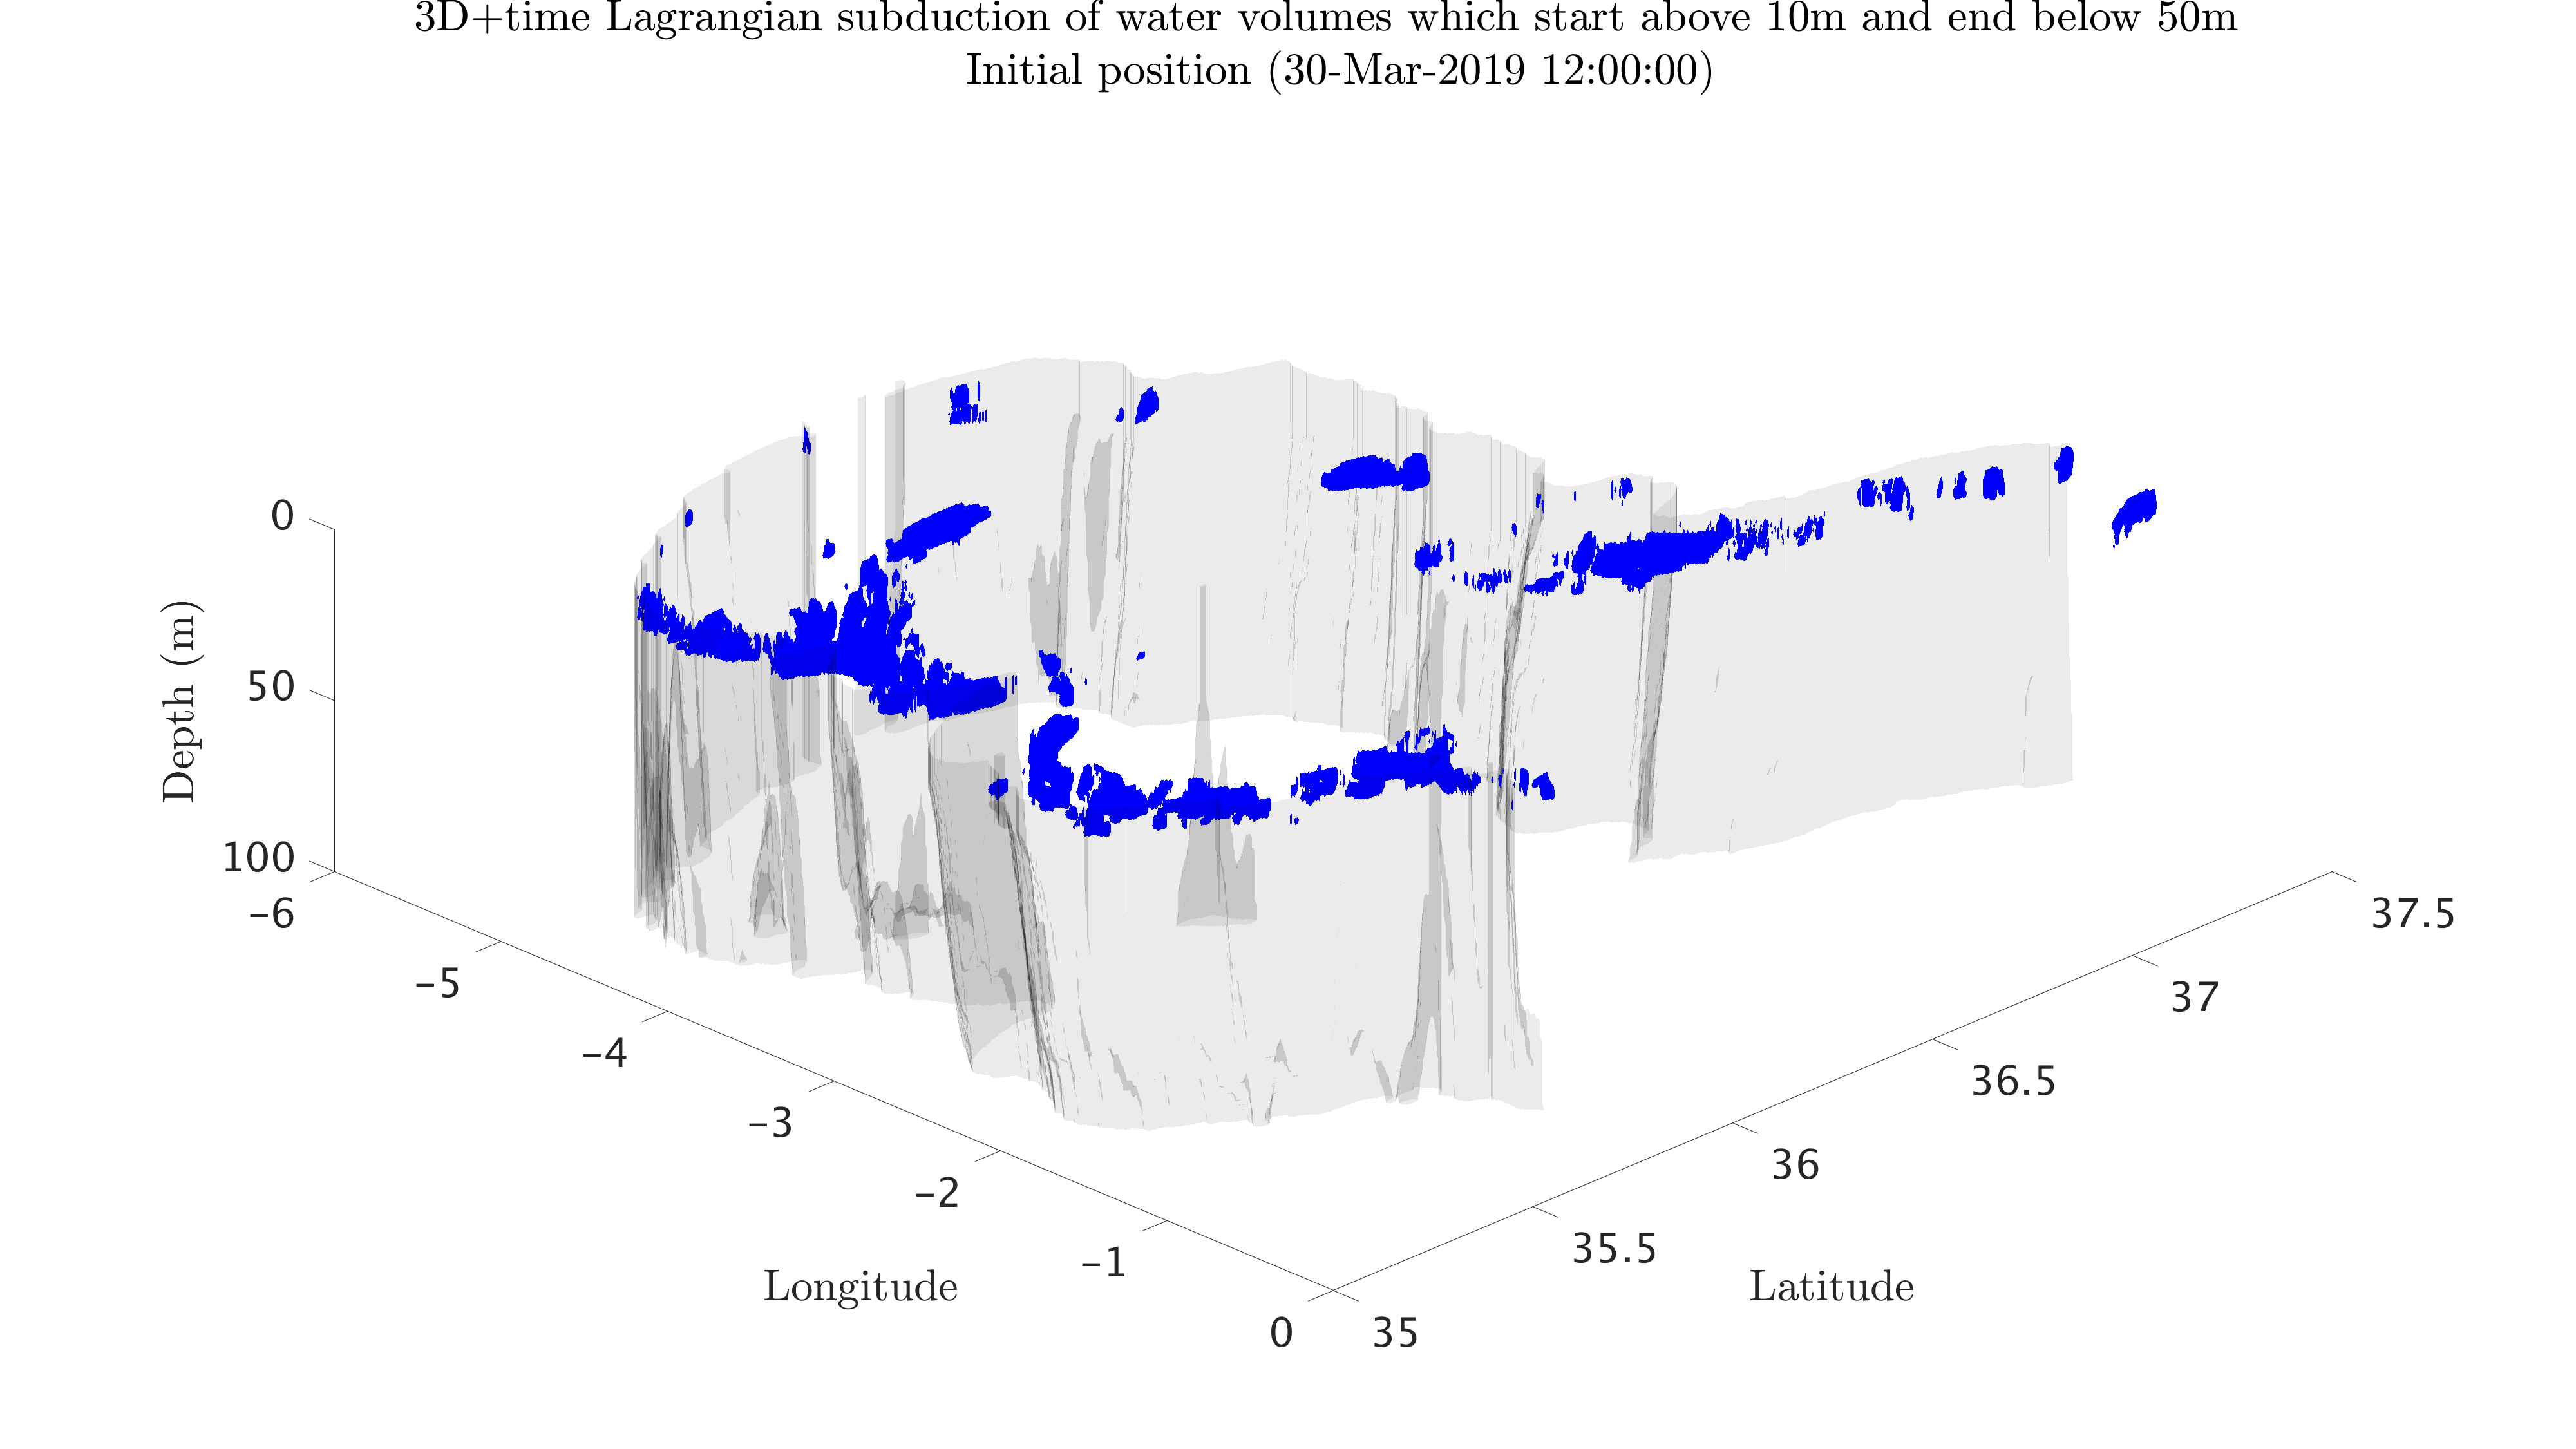
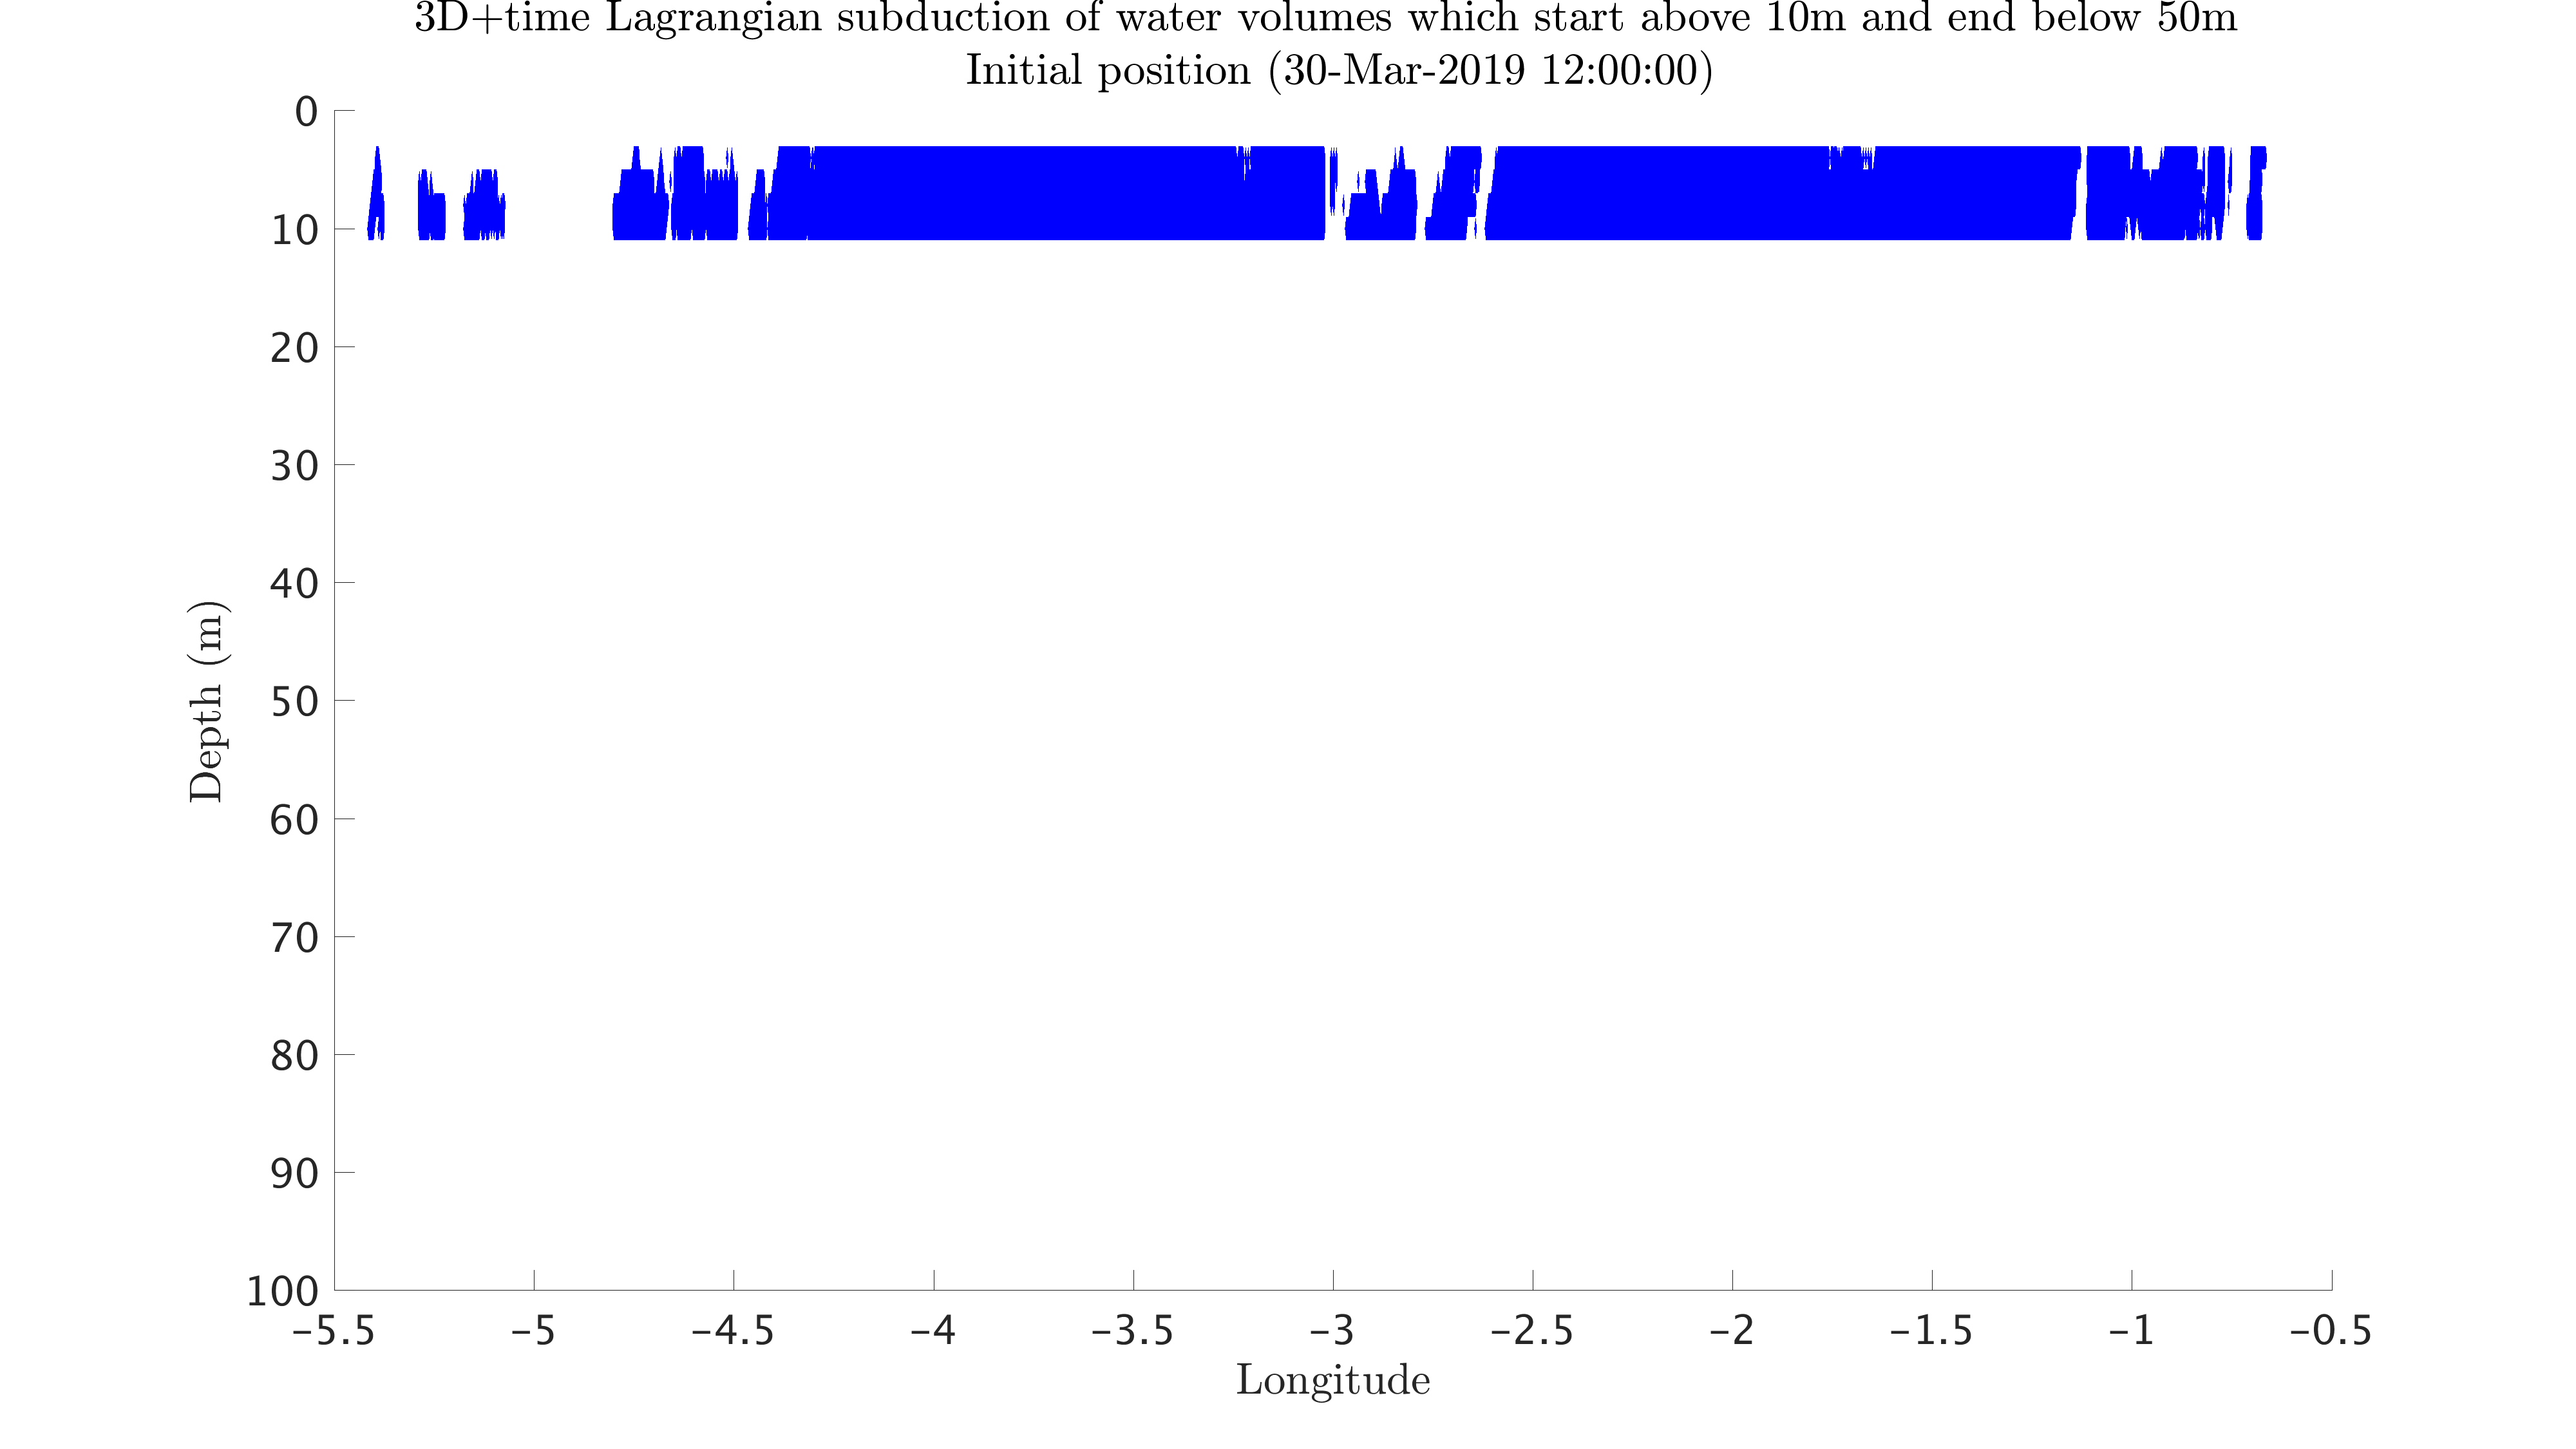
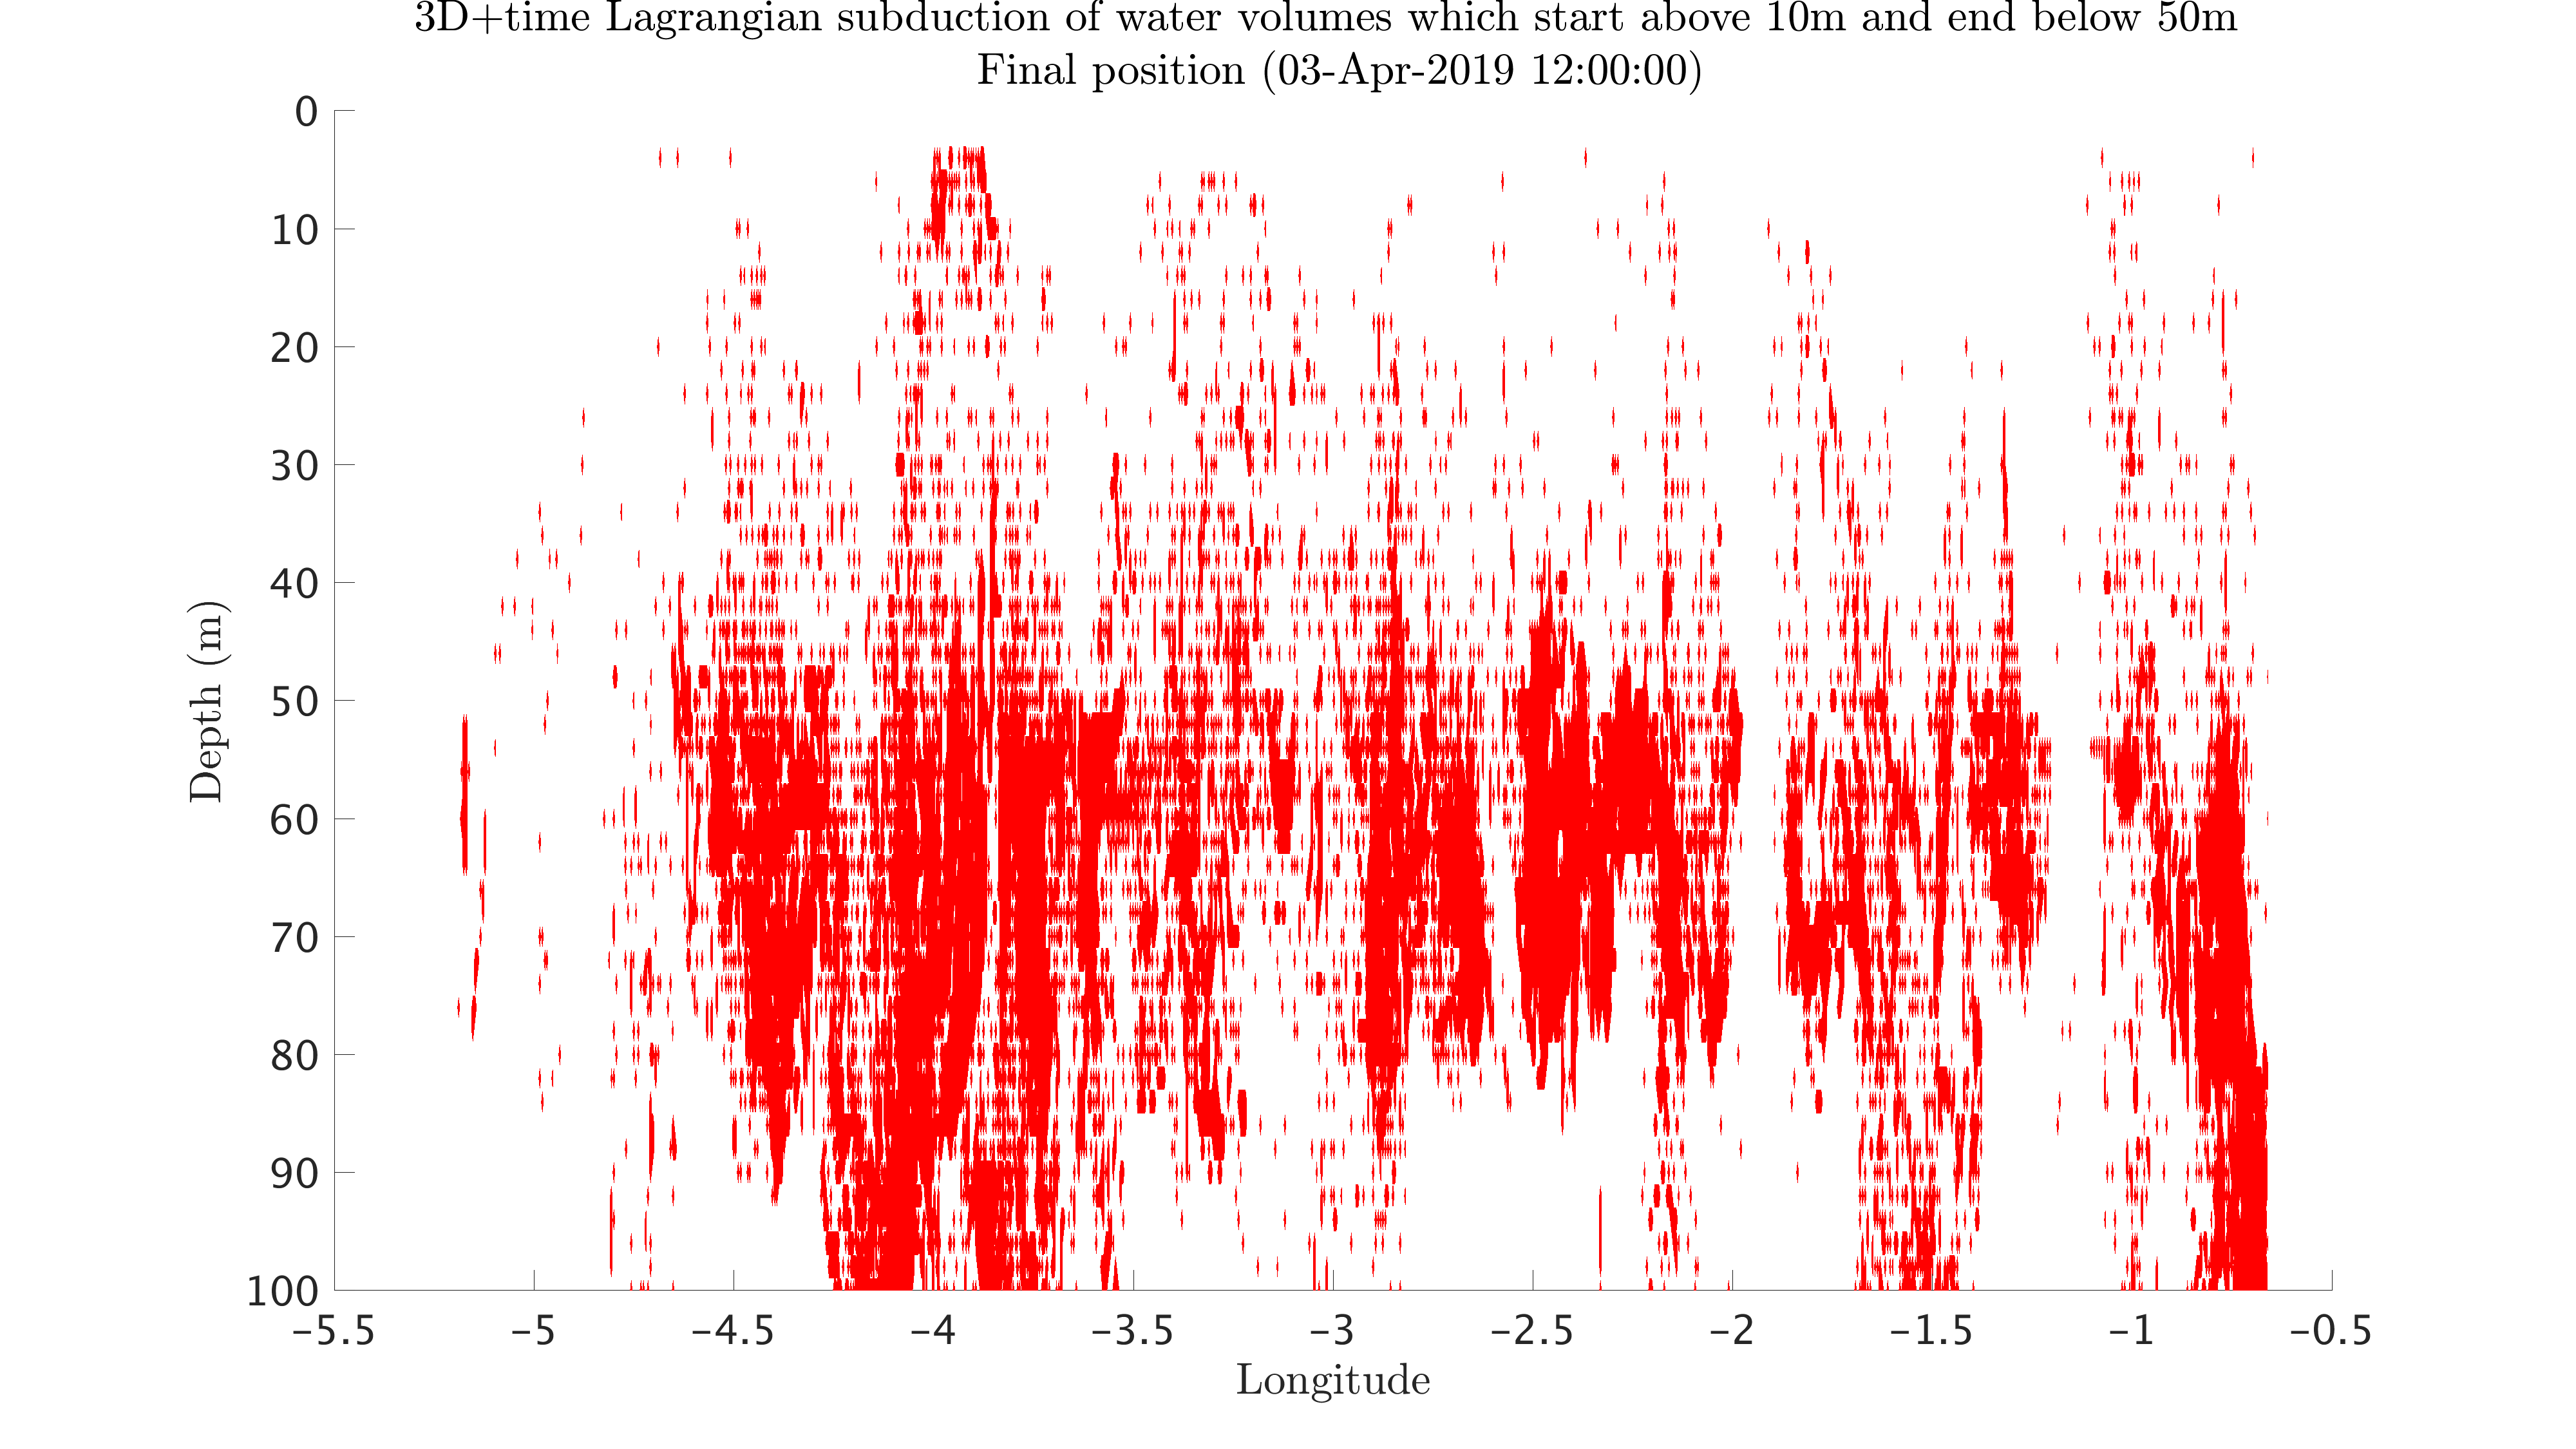
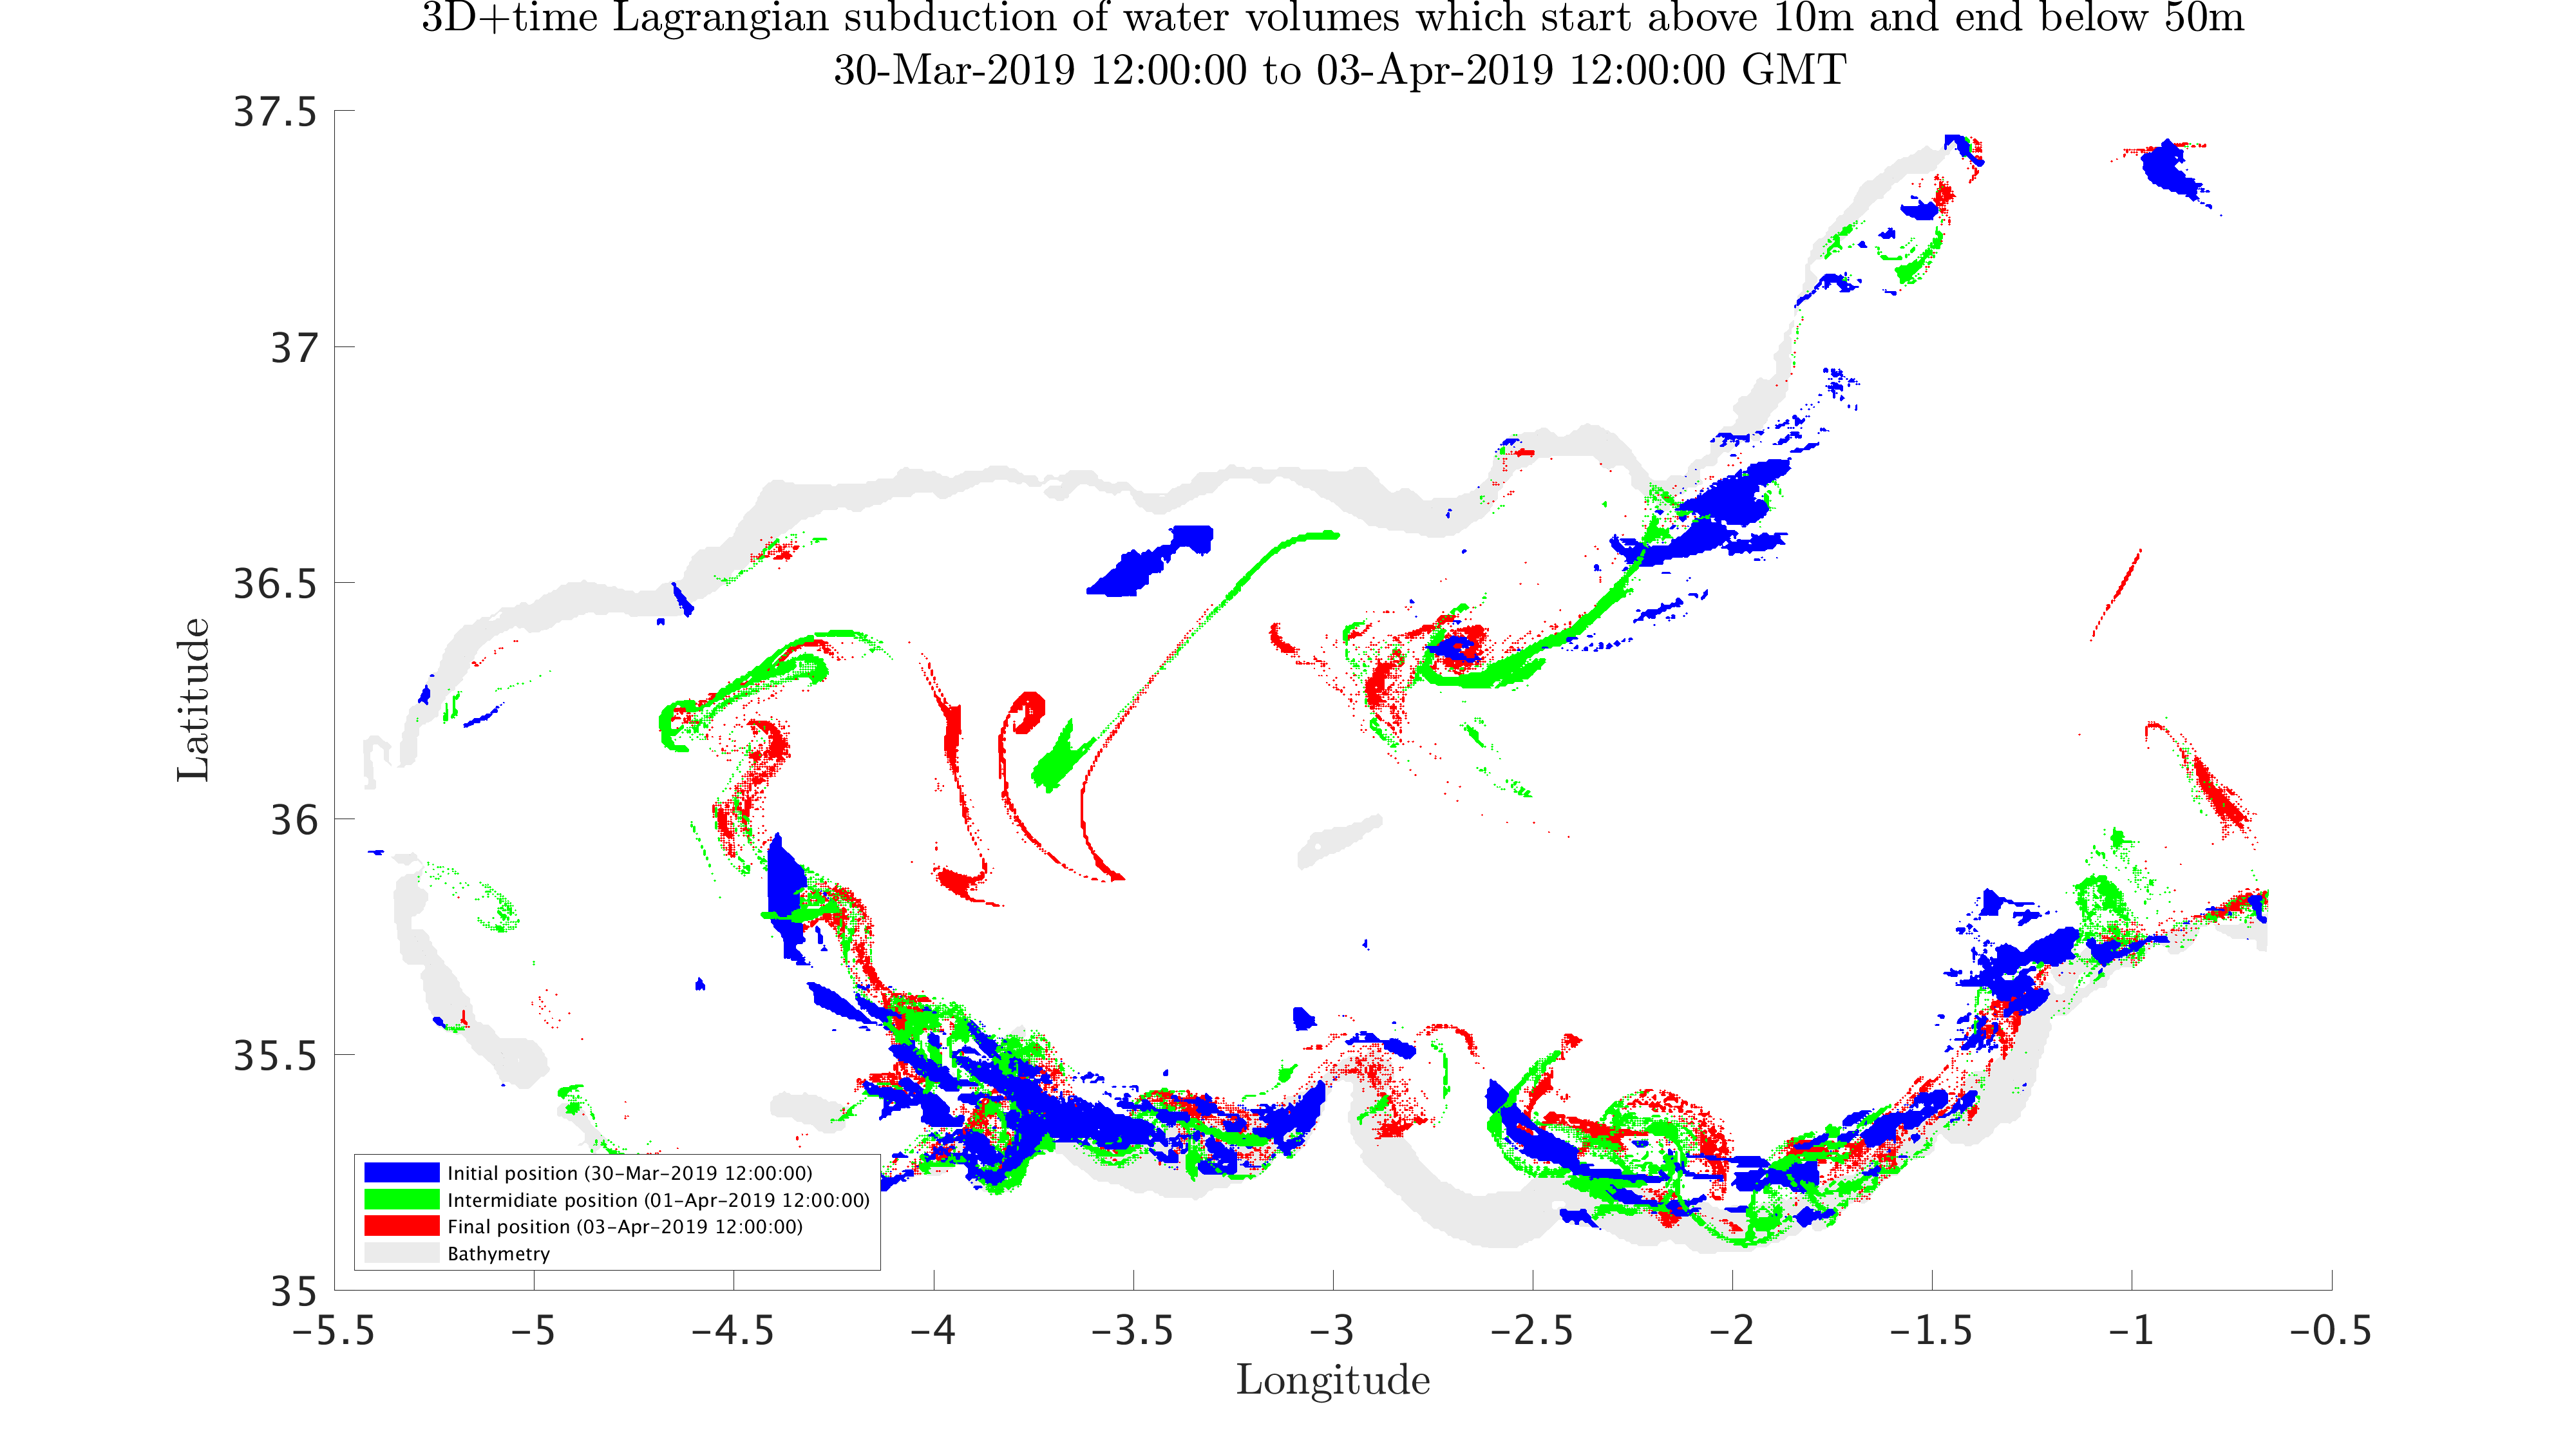
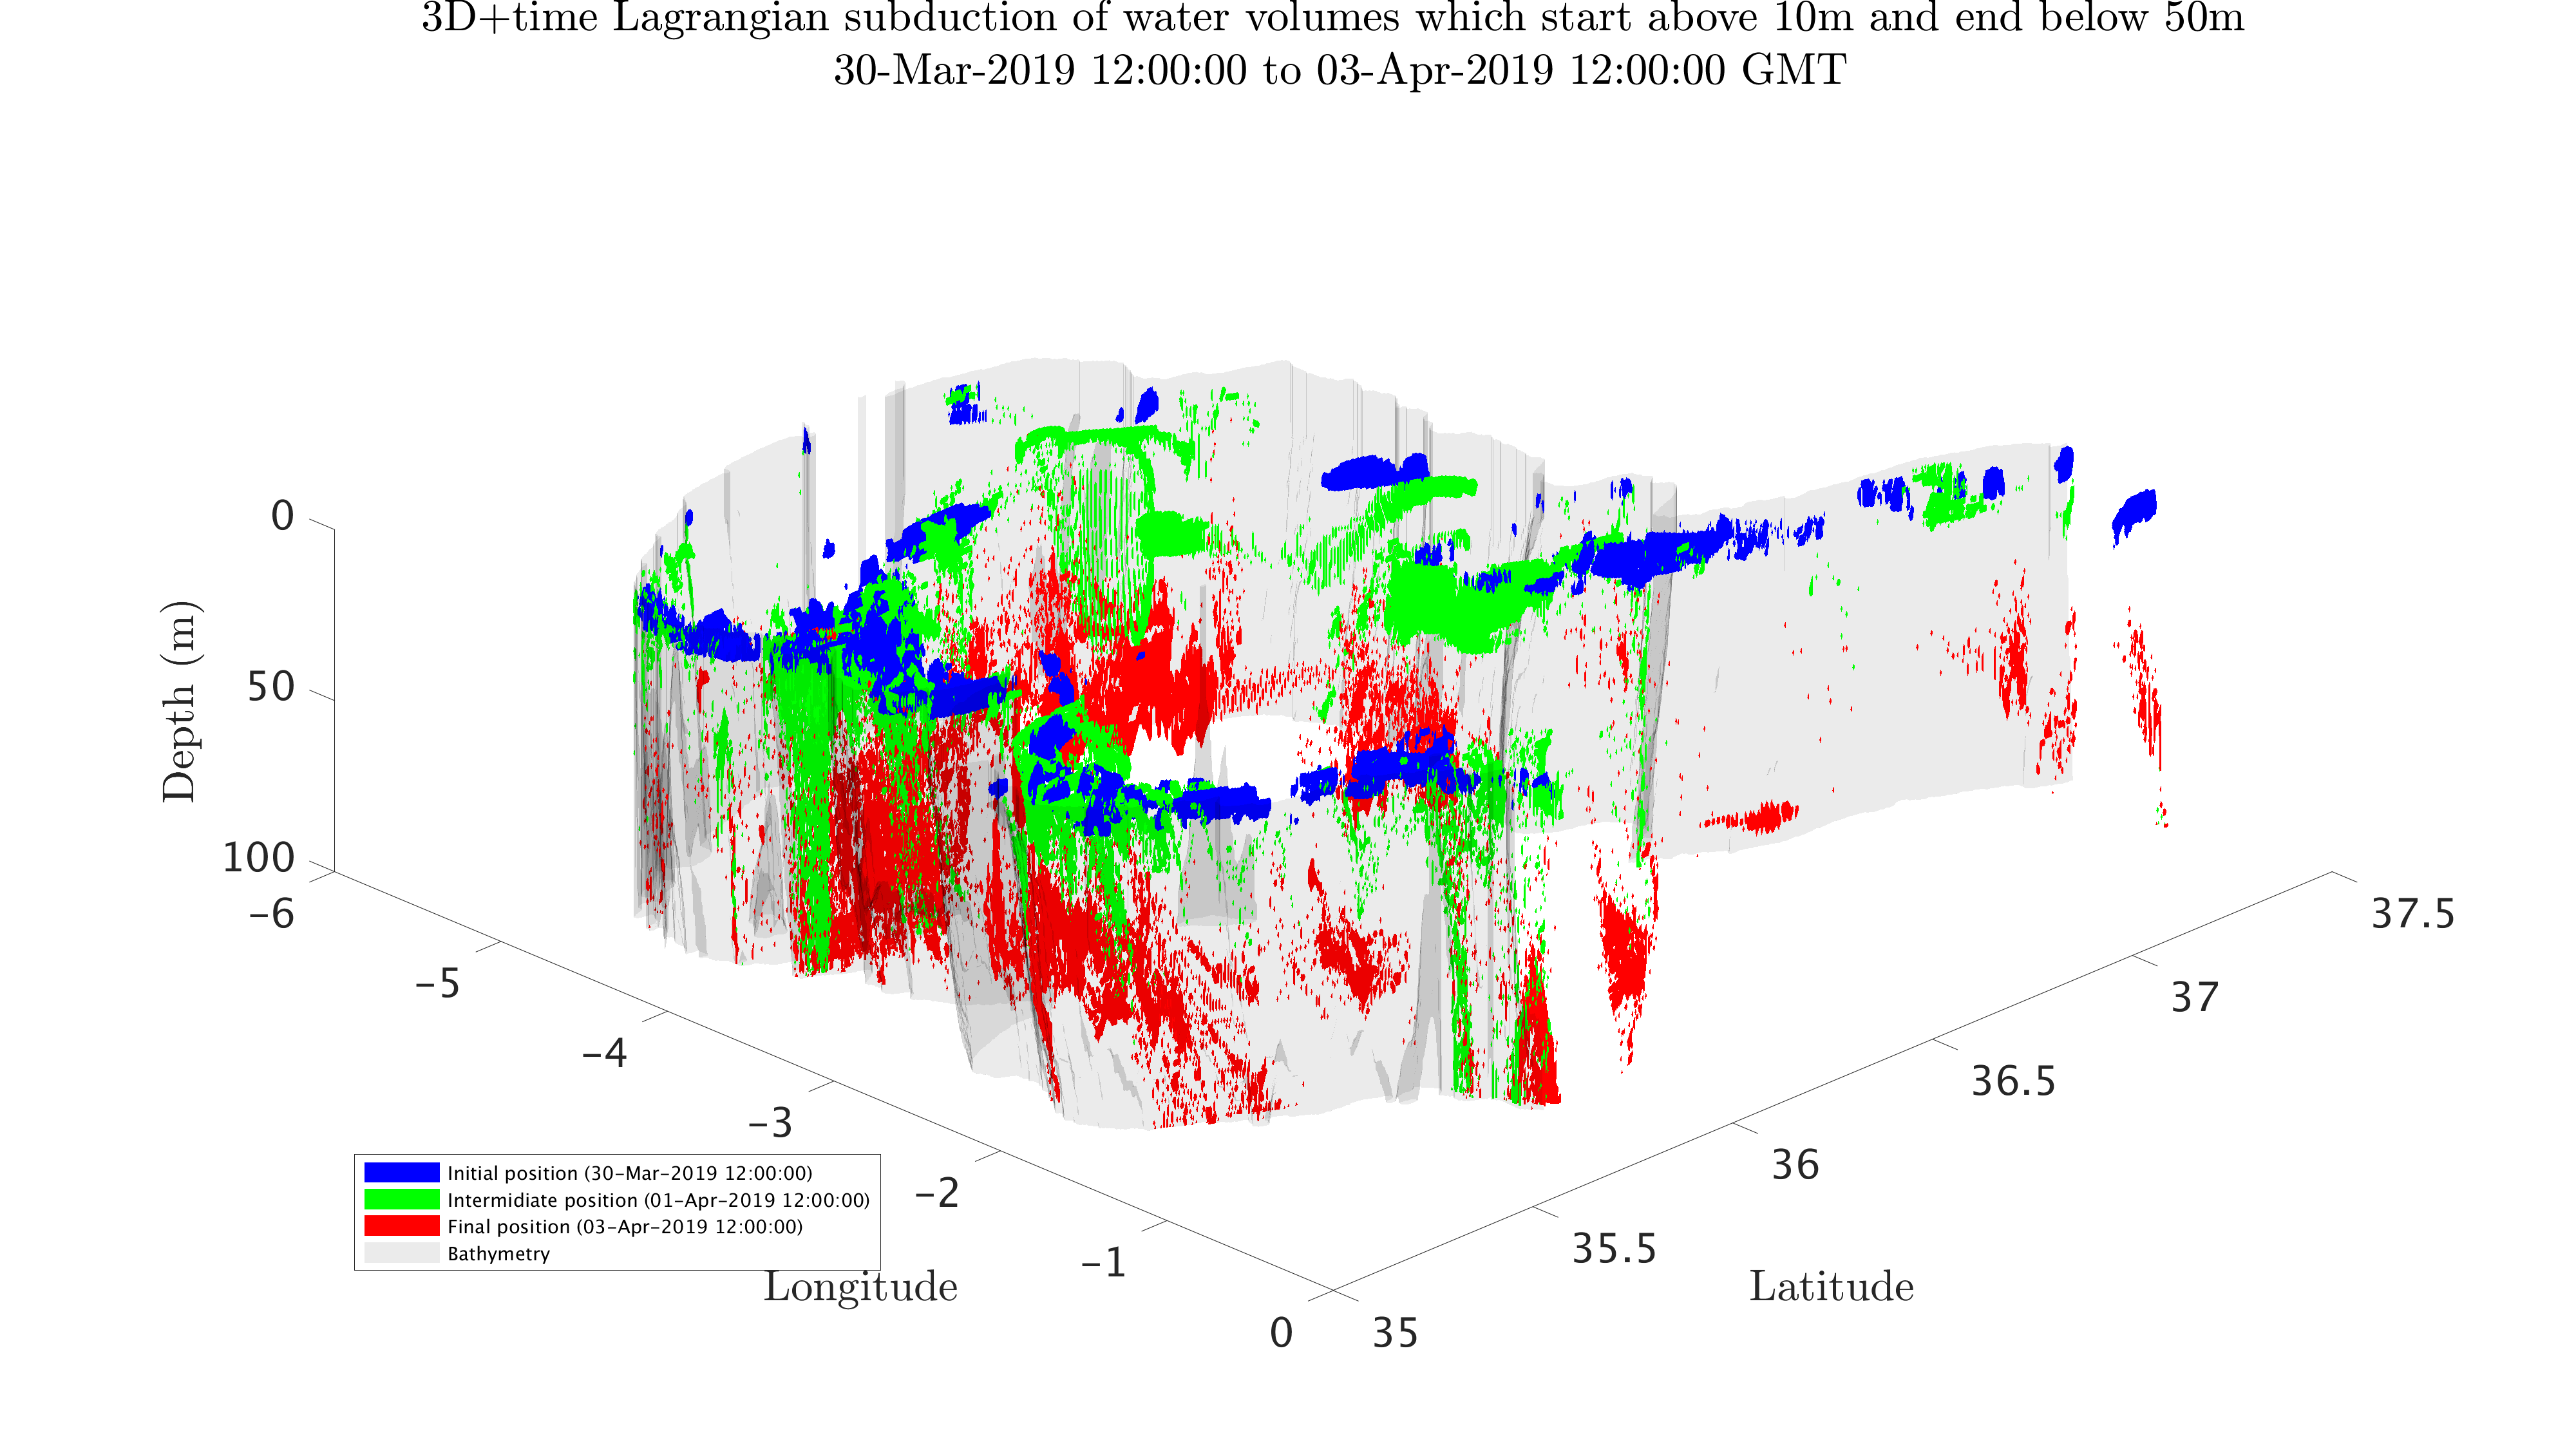
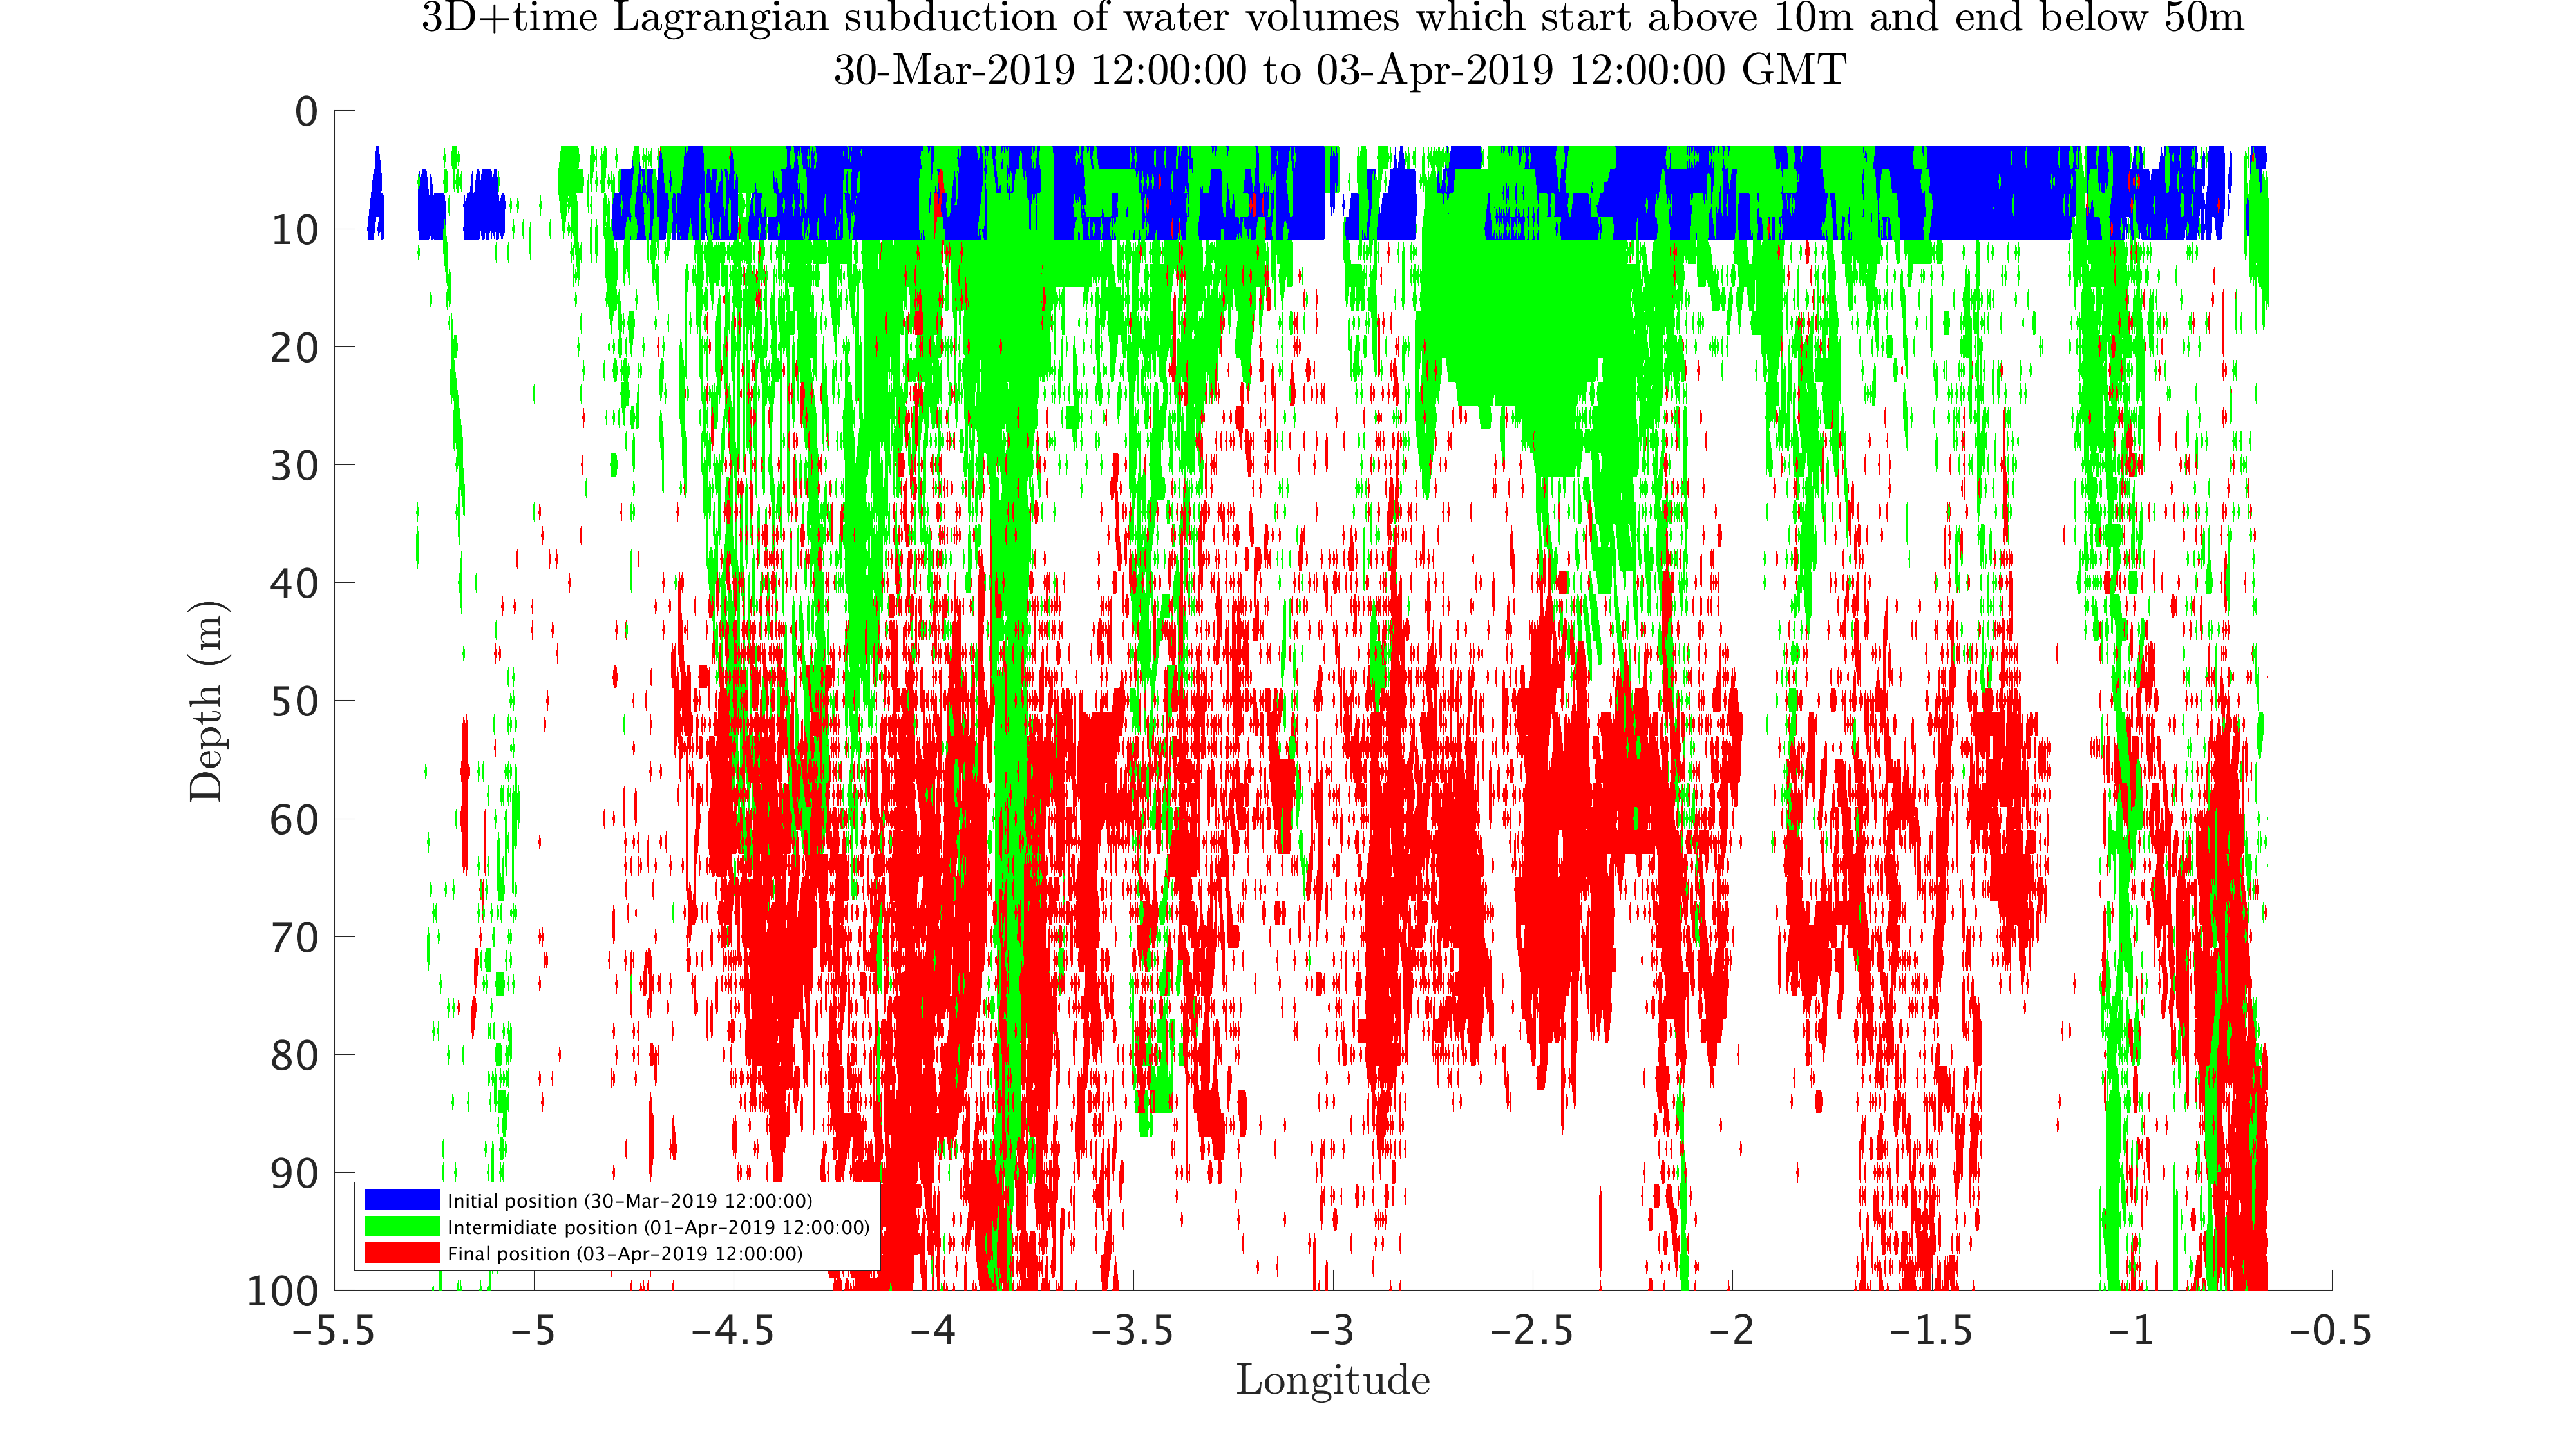
The waters that are plotted in this subduction analysis are only the volumes of water that start within the upper ocean layers (0-to-10 m depths) anywhere in our modeling domain and reach 50m after 4 days. This is all that is plotted, at 3 times (blue is day 0, green is day 2 and red is day 4).
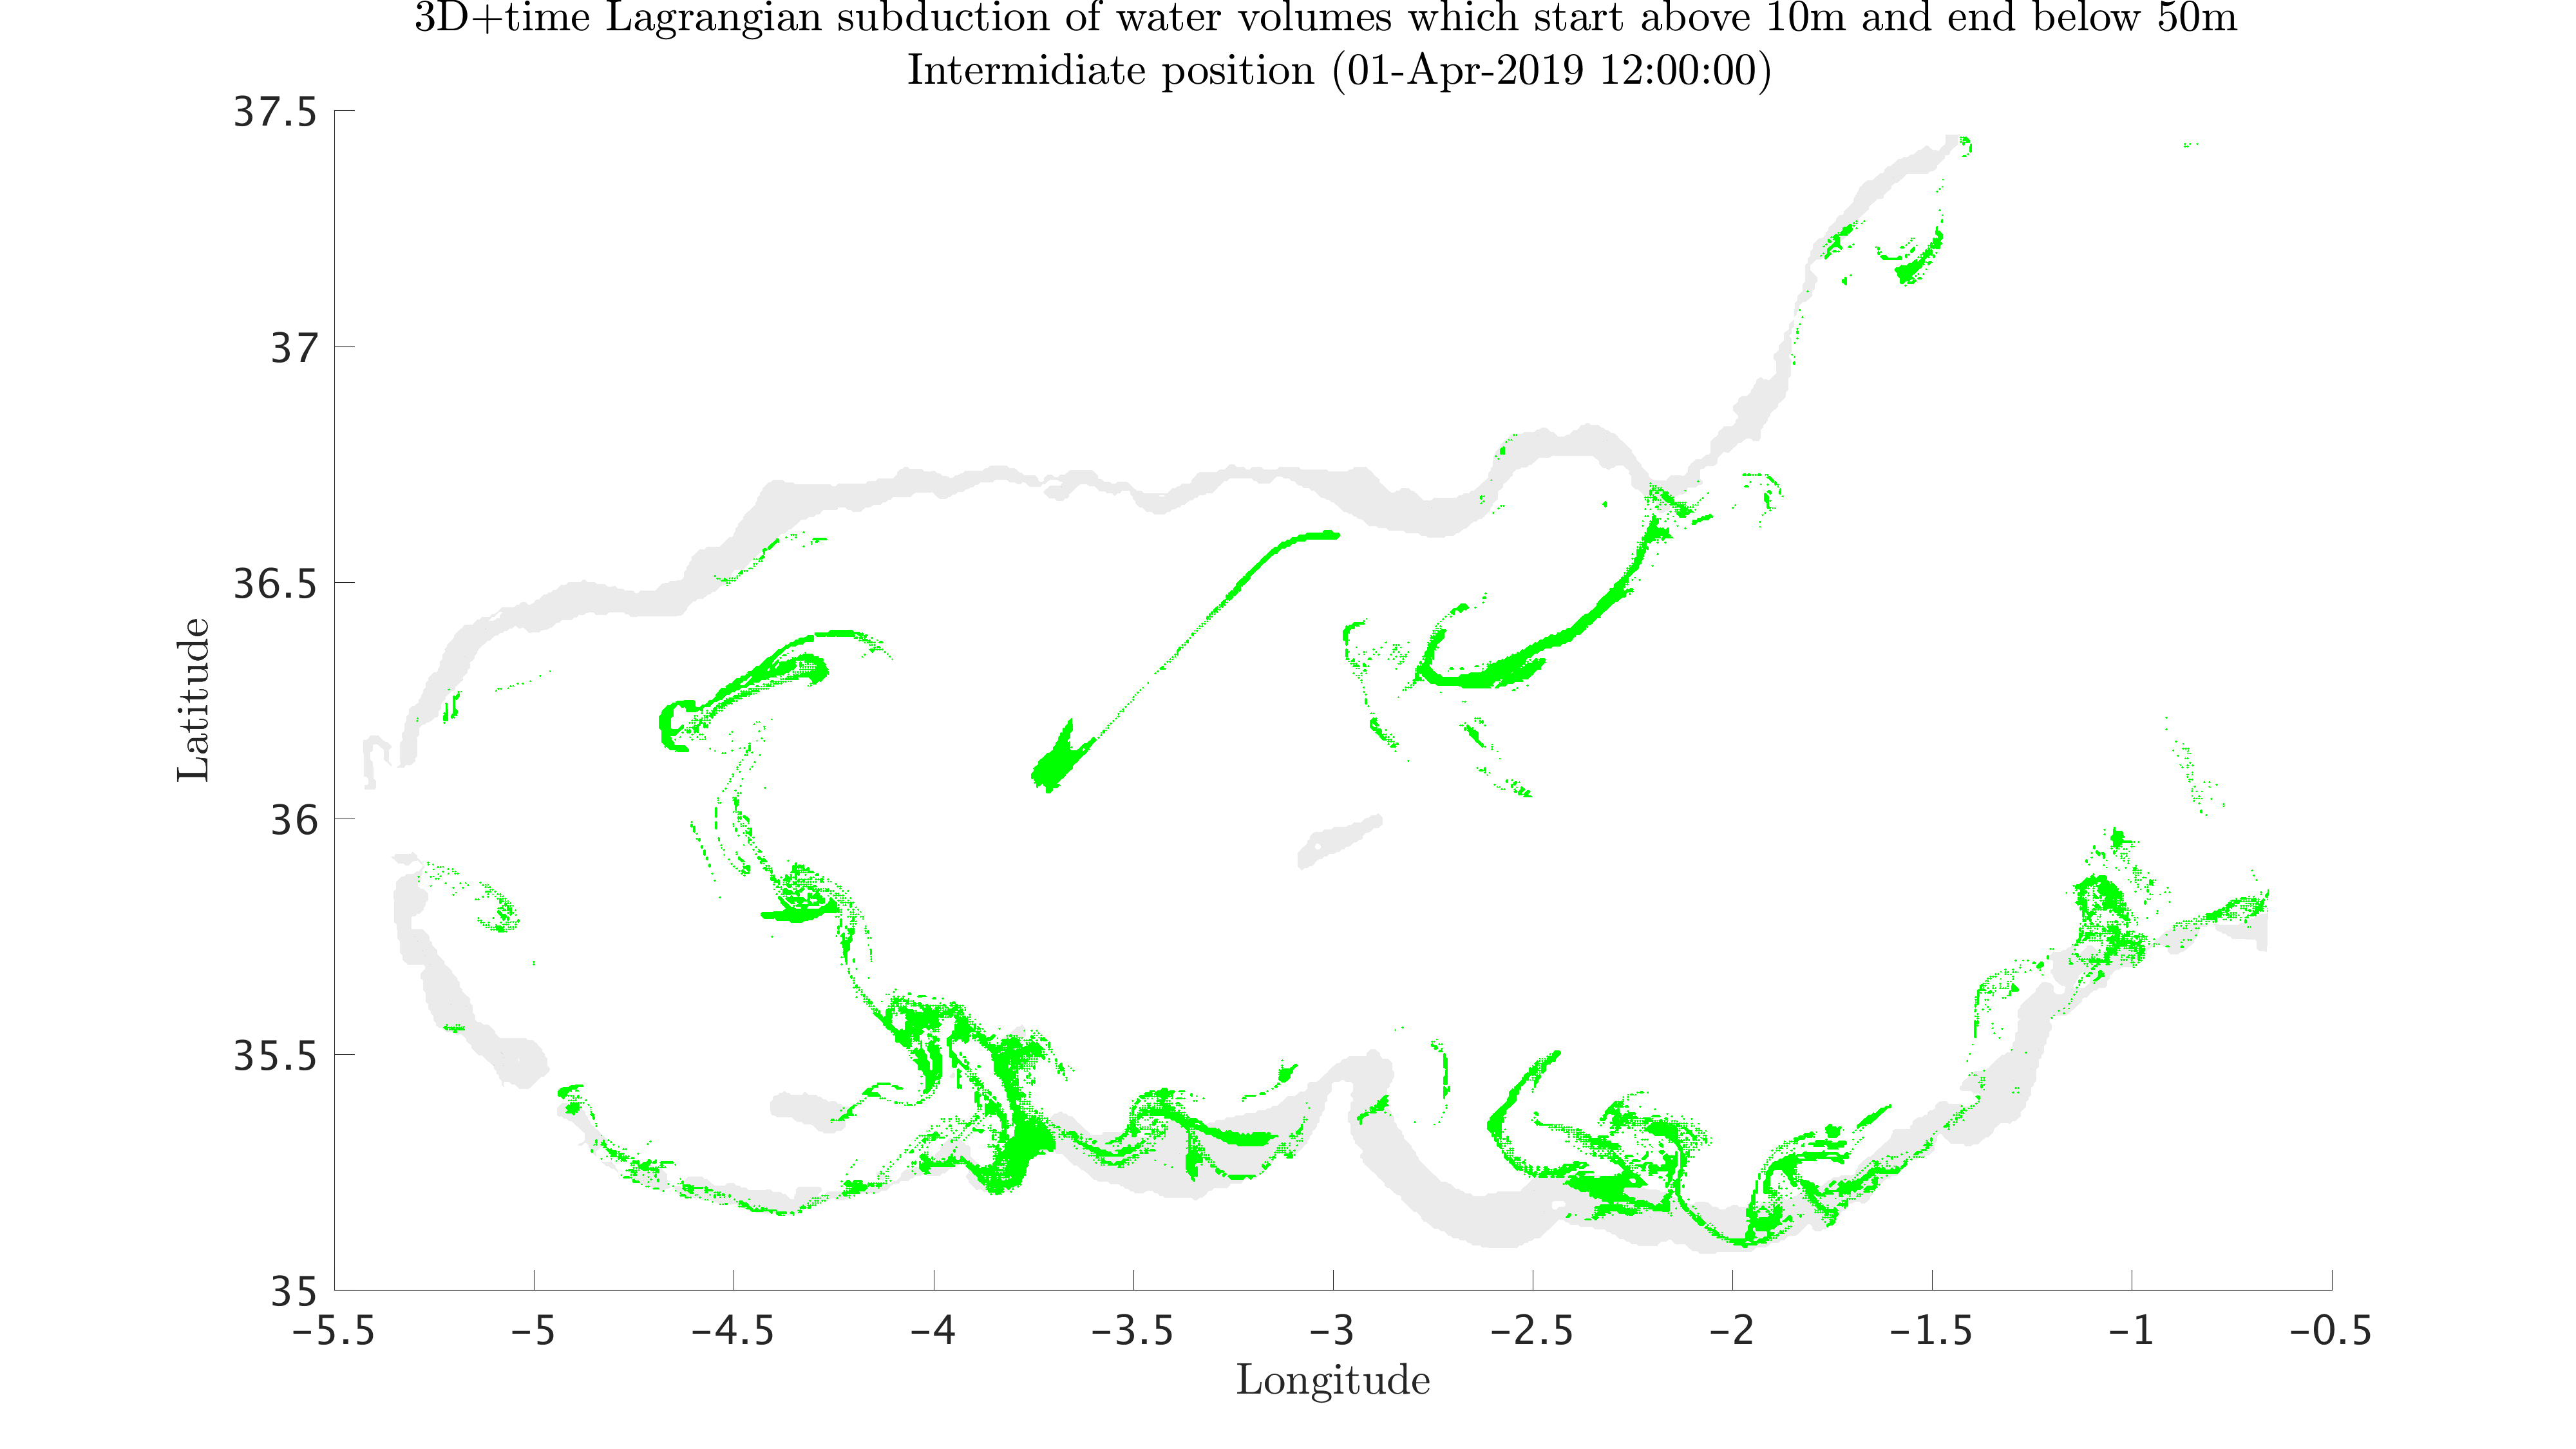
Below, the blue water volumes are the initial positions of these waters that start within 0-to-10 m depths and reach 50m after 4 days. These water volumes are advected using a flowmap-based and composition-based advection scheme, using our MSEAS forecast of the 3D ocean currents (u, v and w). The green water volumes represent the location of the parcels after two days while the red water volumes represent the final location after 4 days. The combined figures in the last row show the 3D water volumes, overlaid, at the 3 different times.
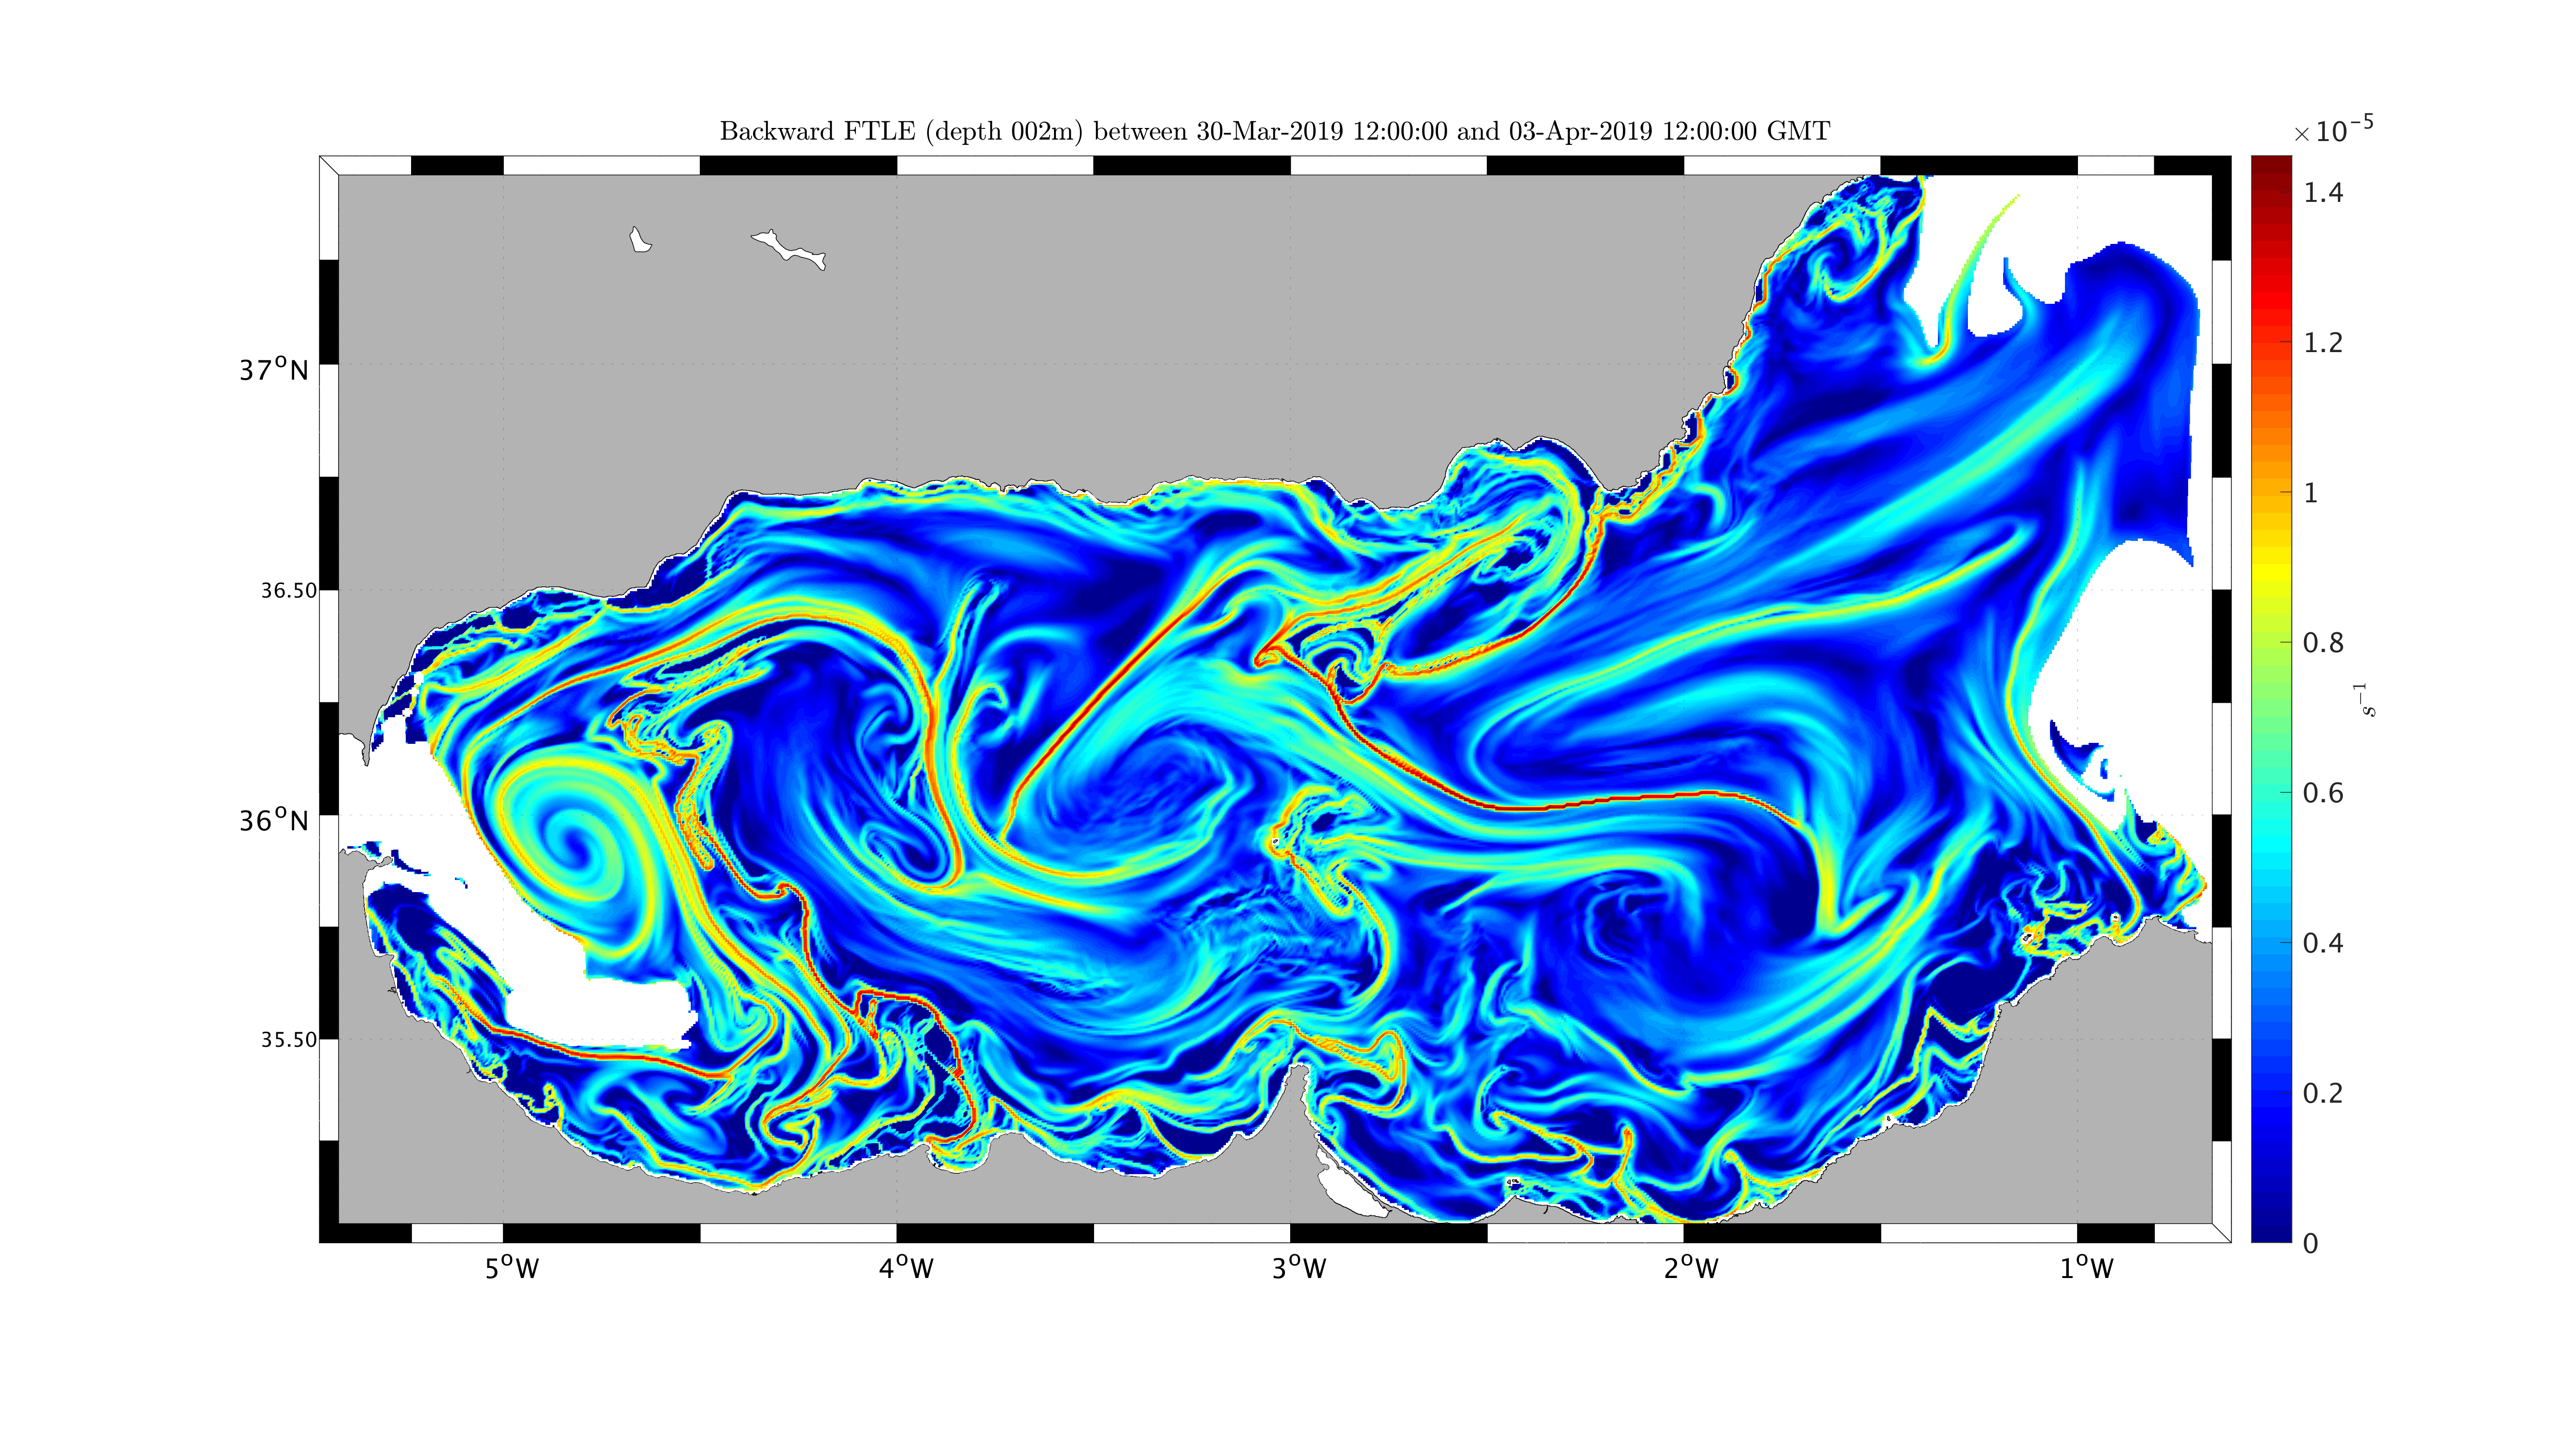
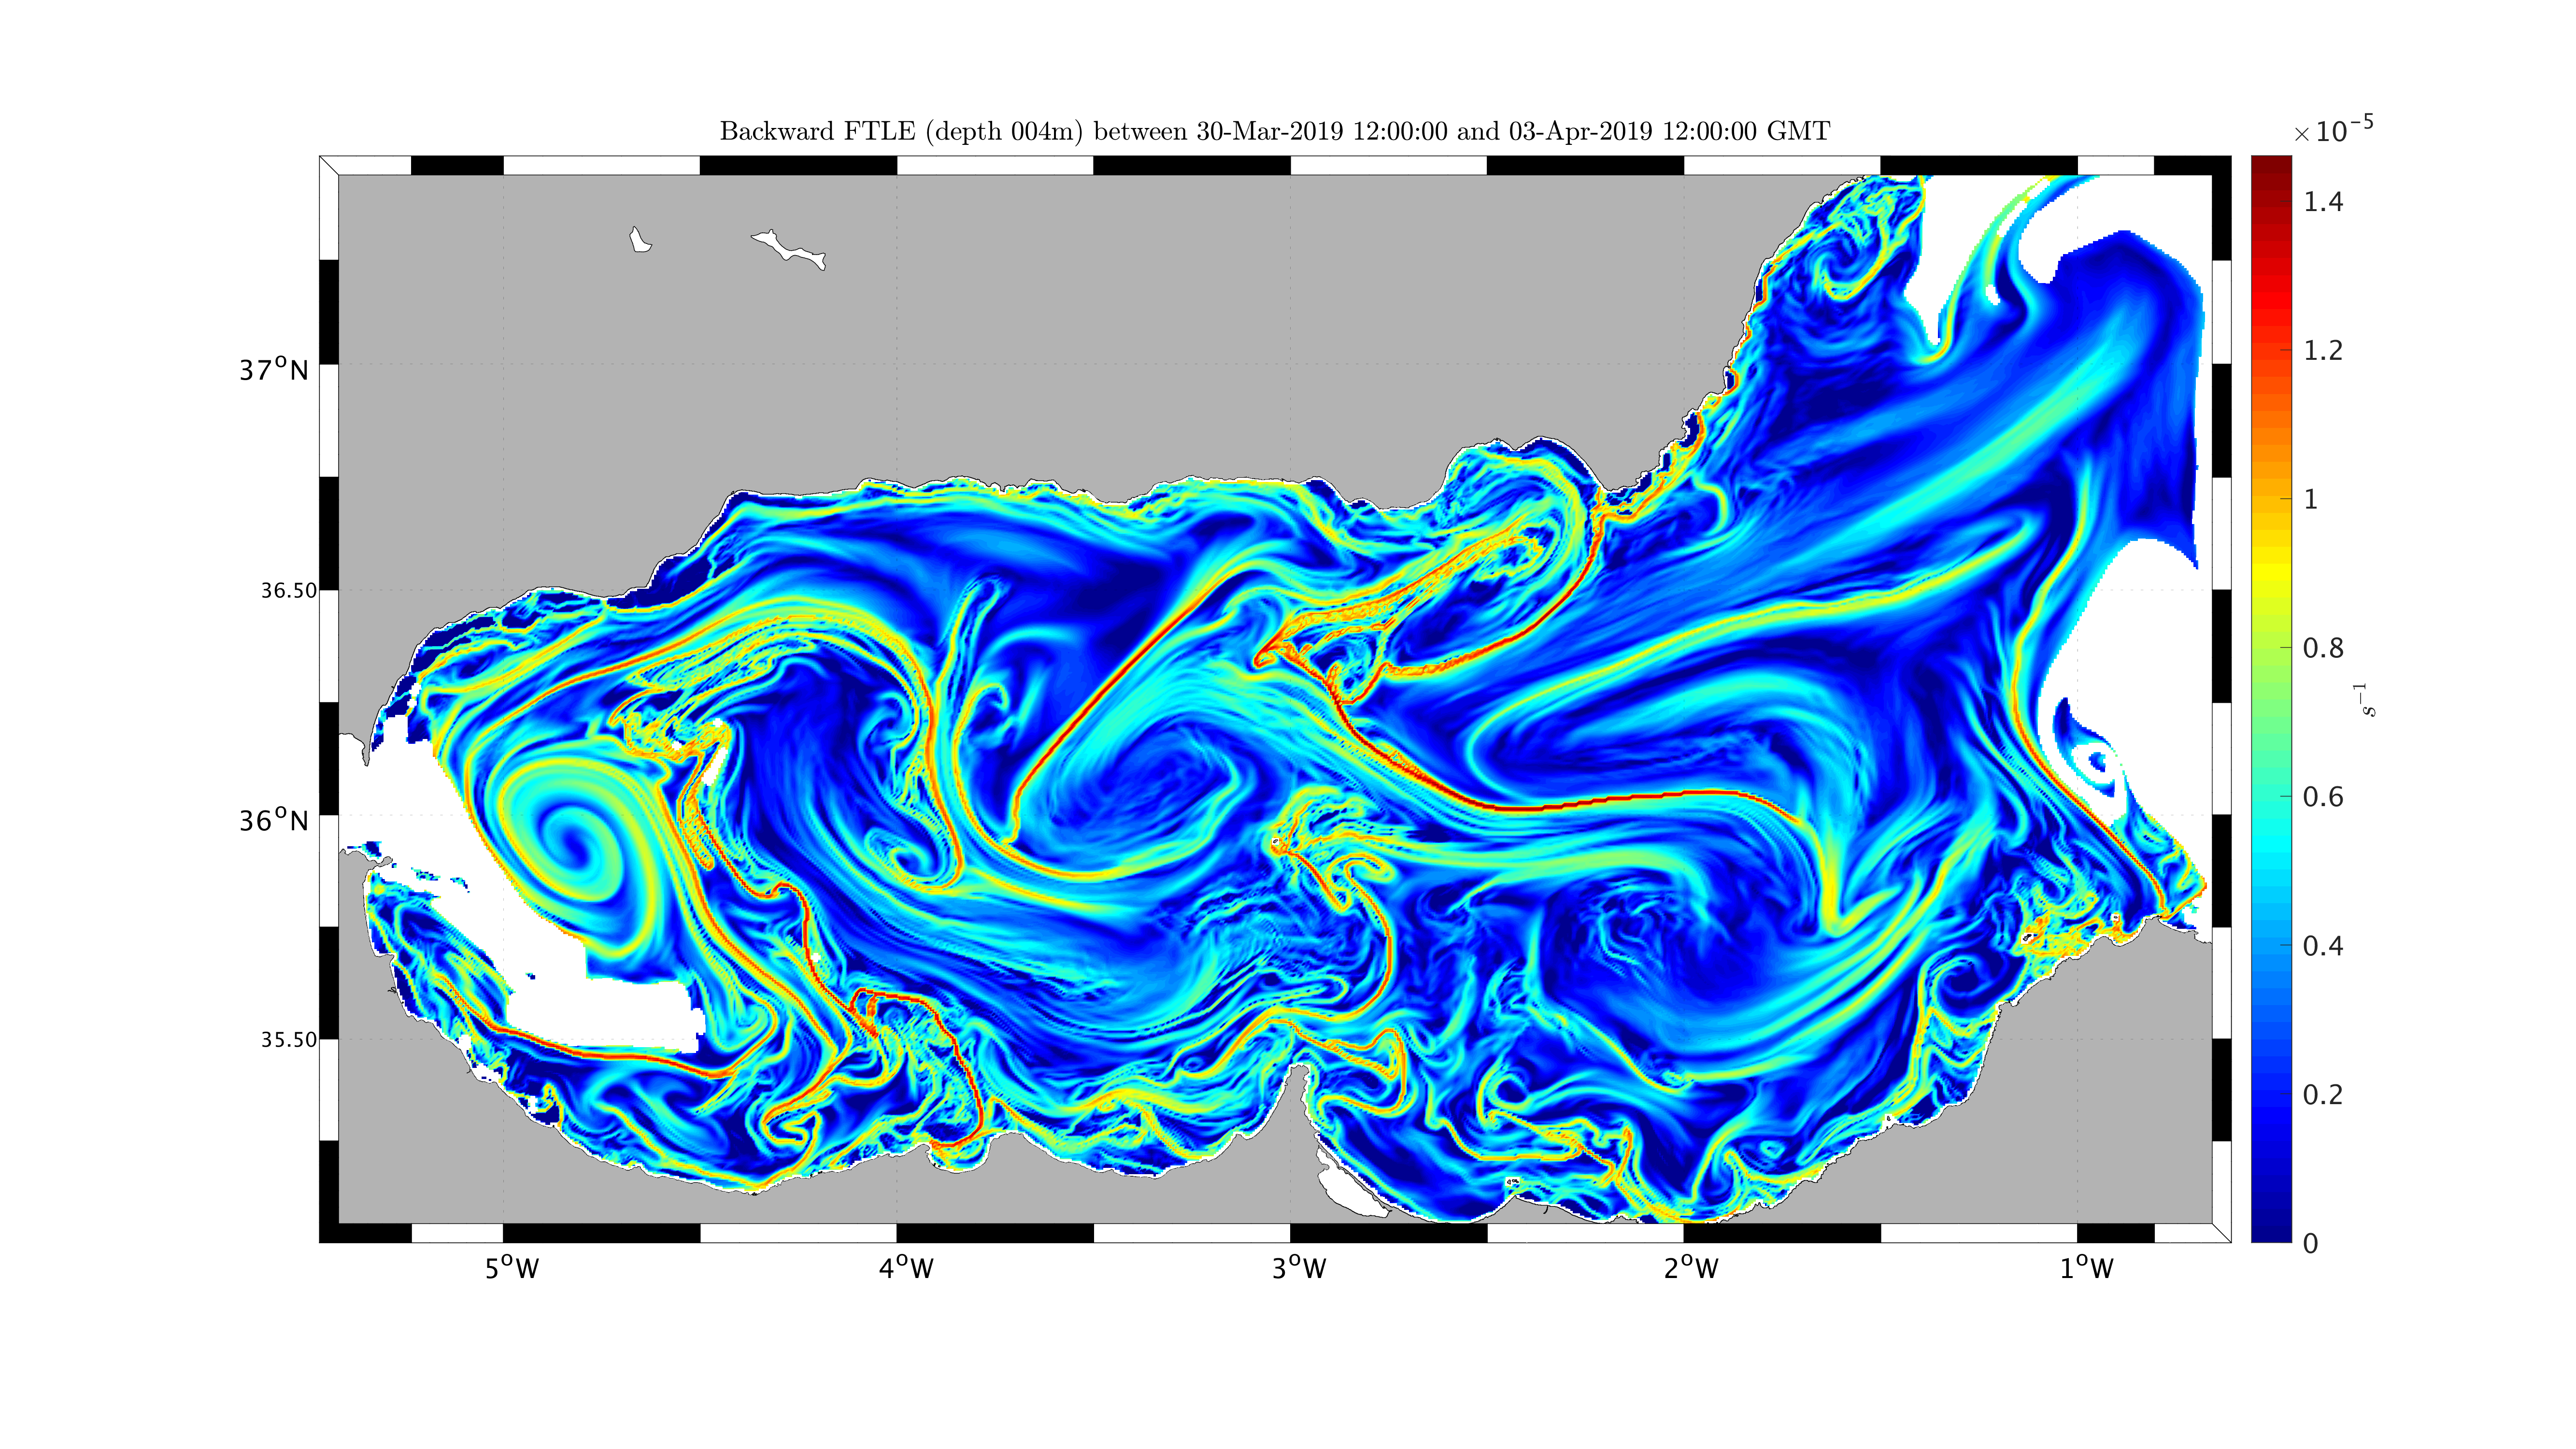
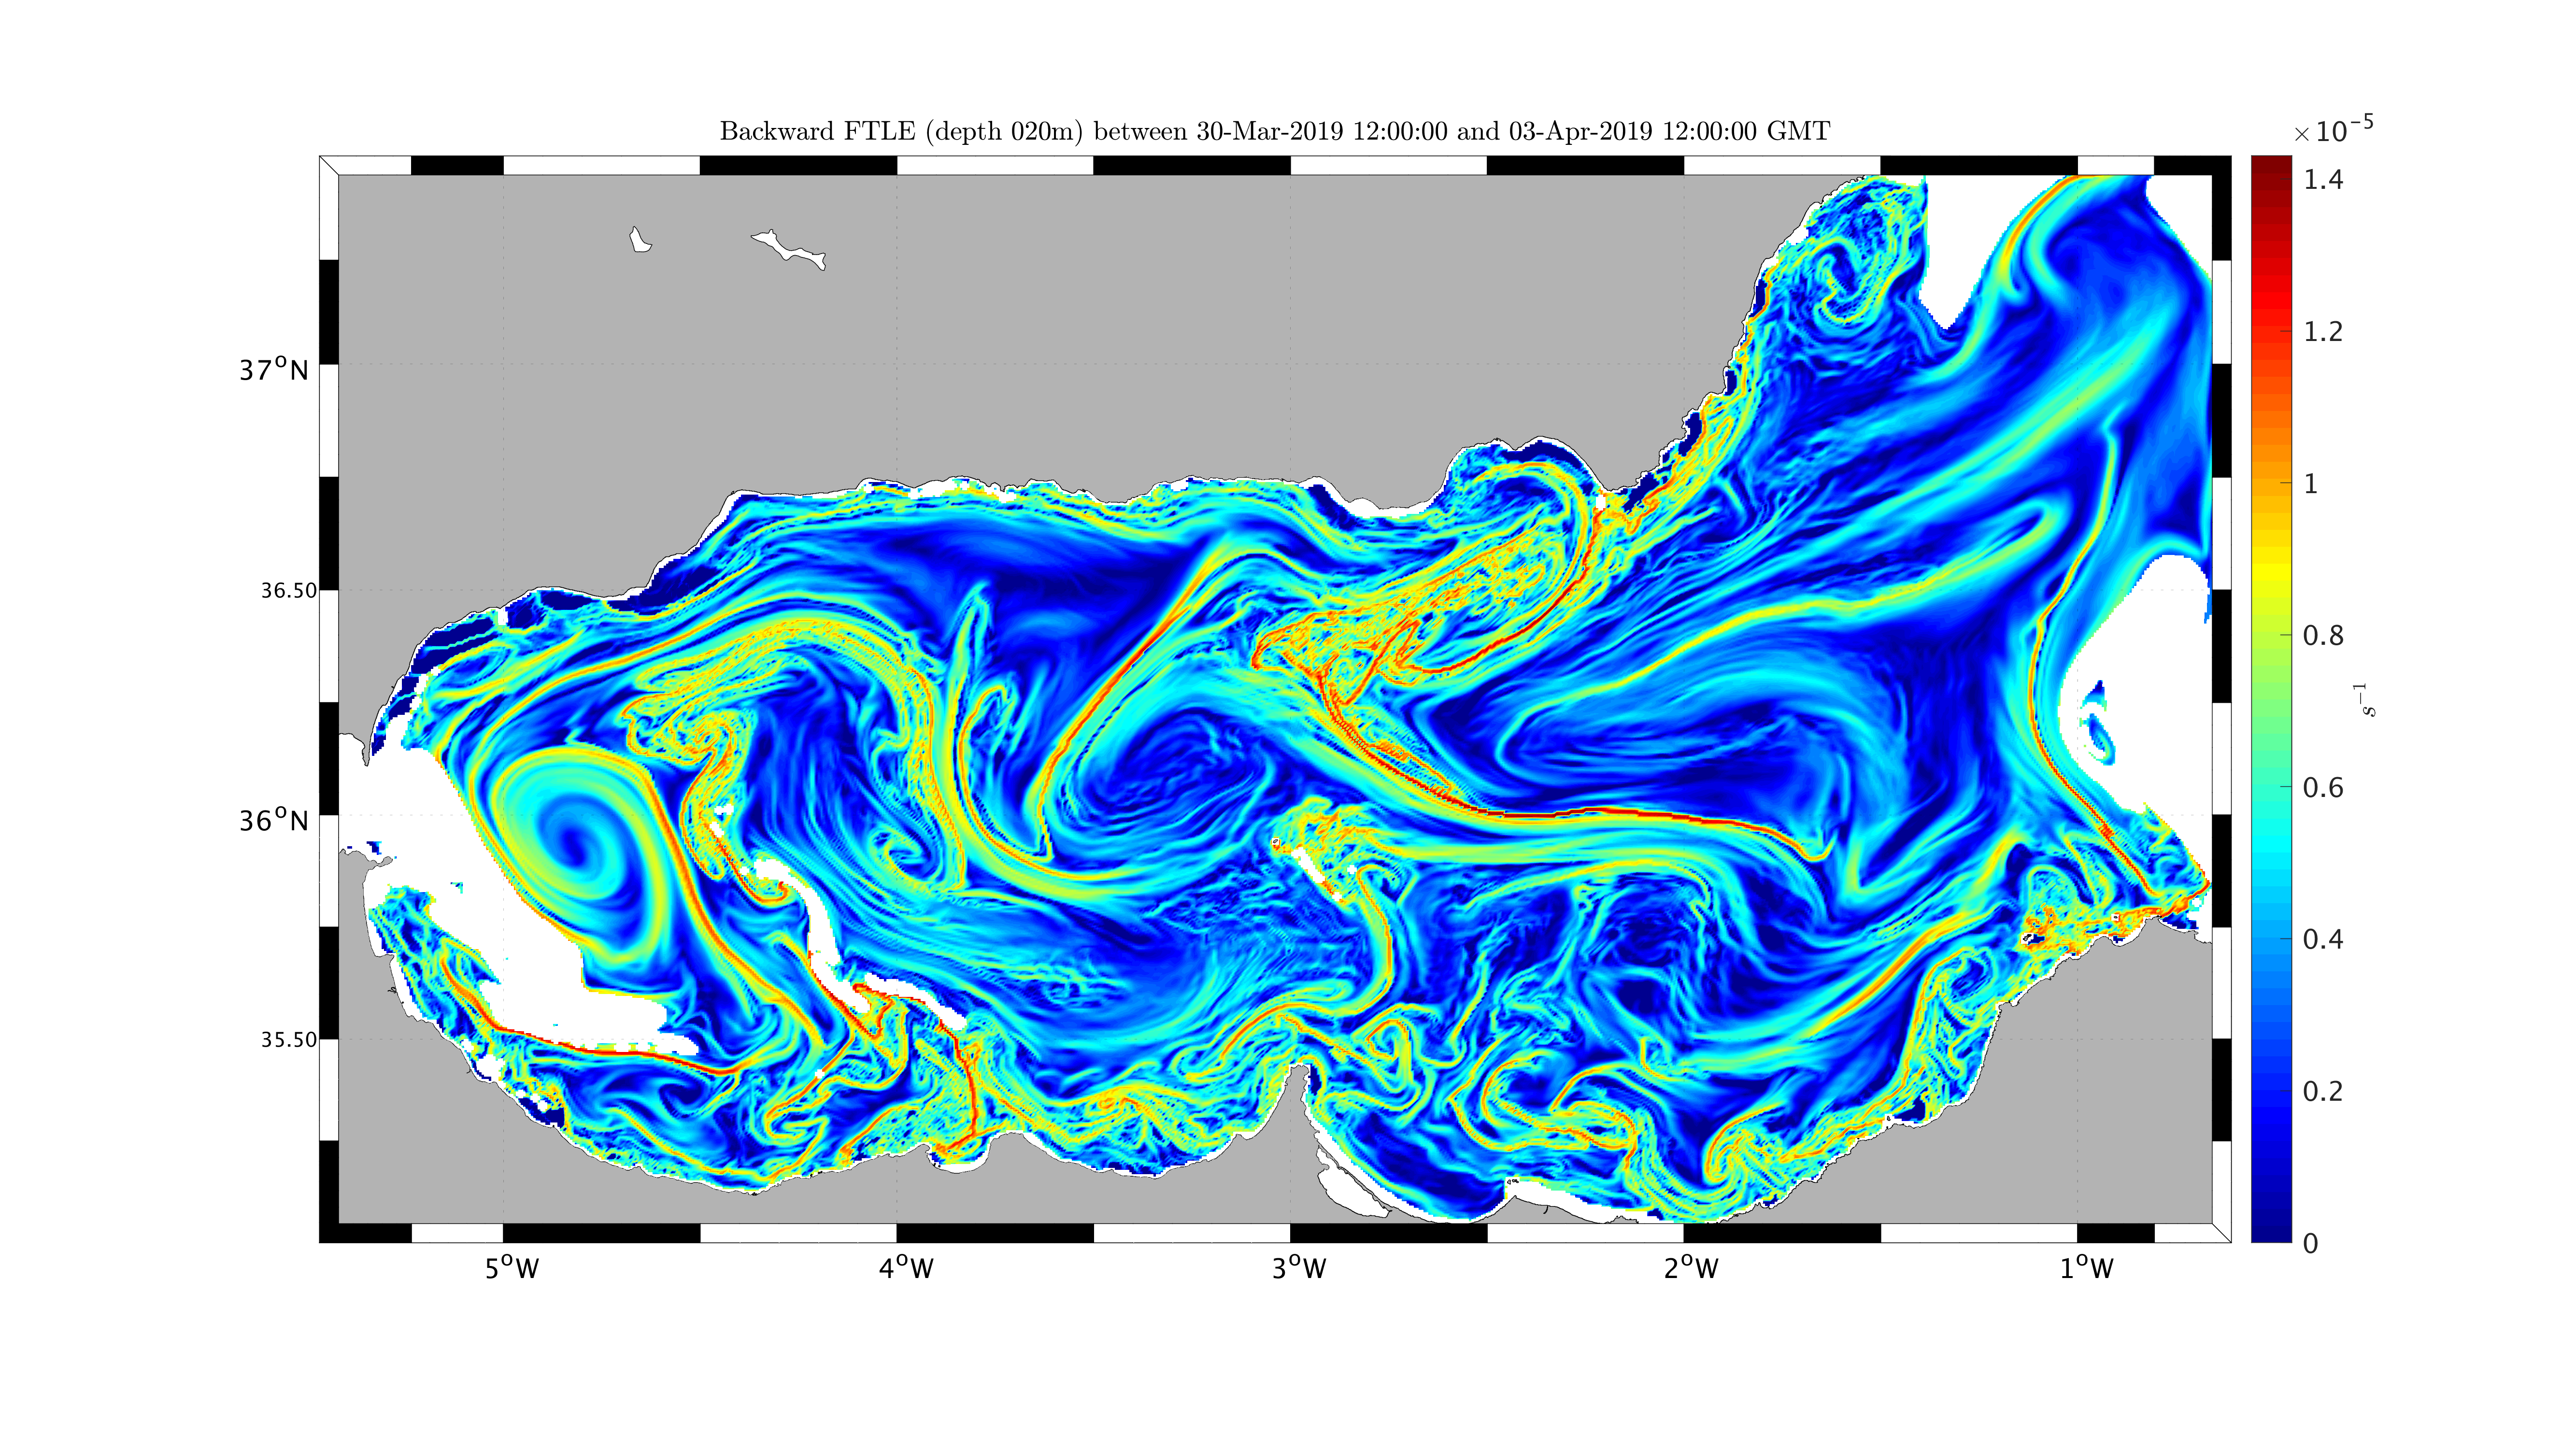
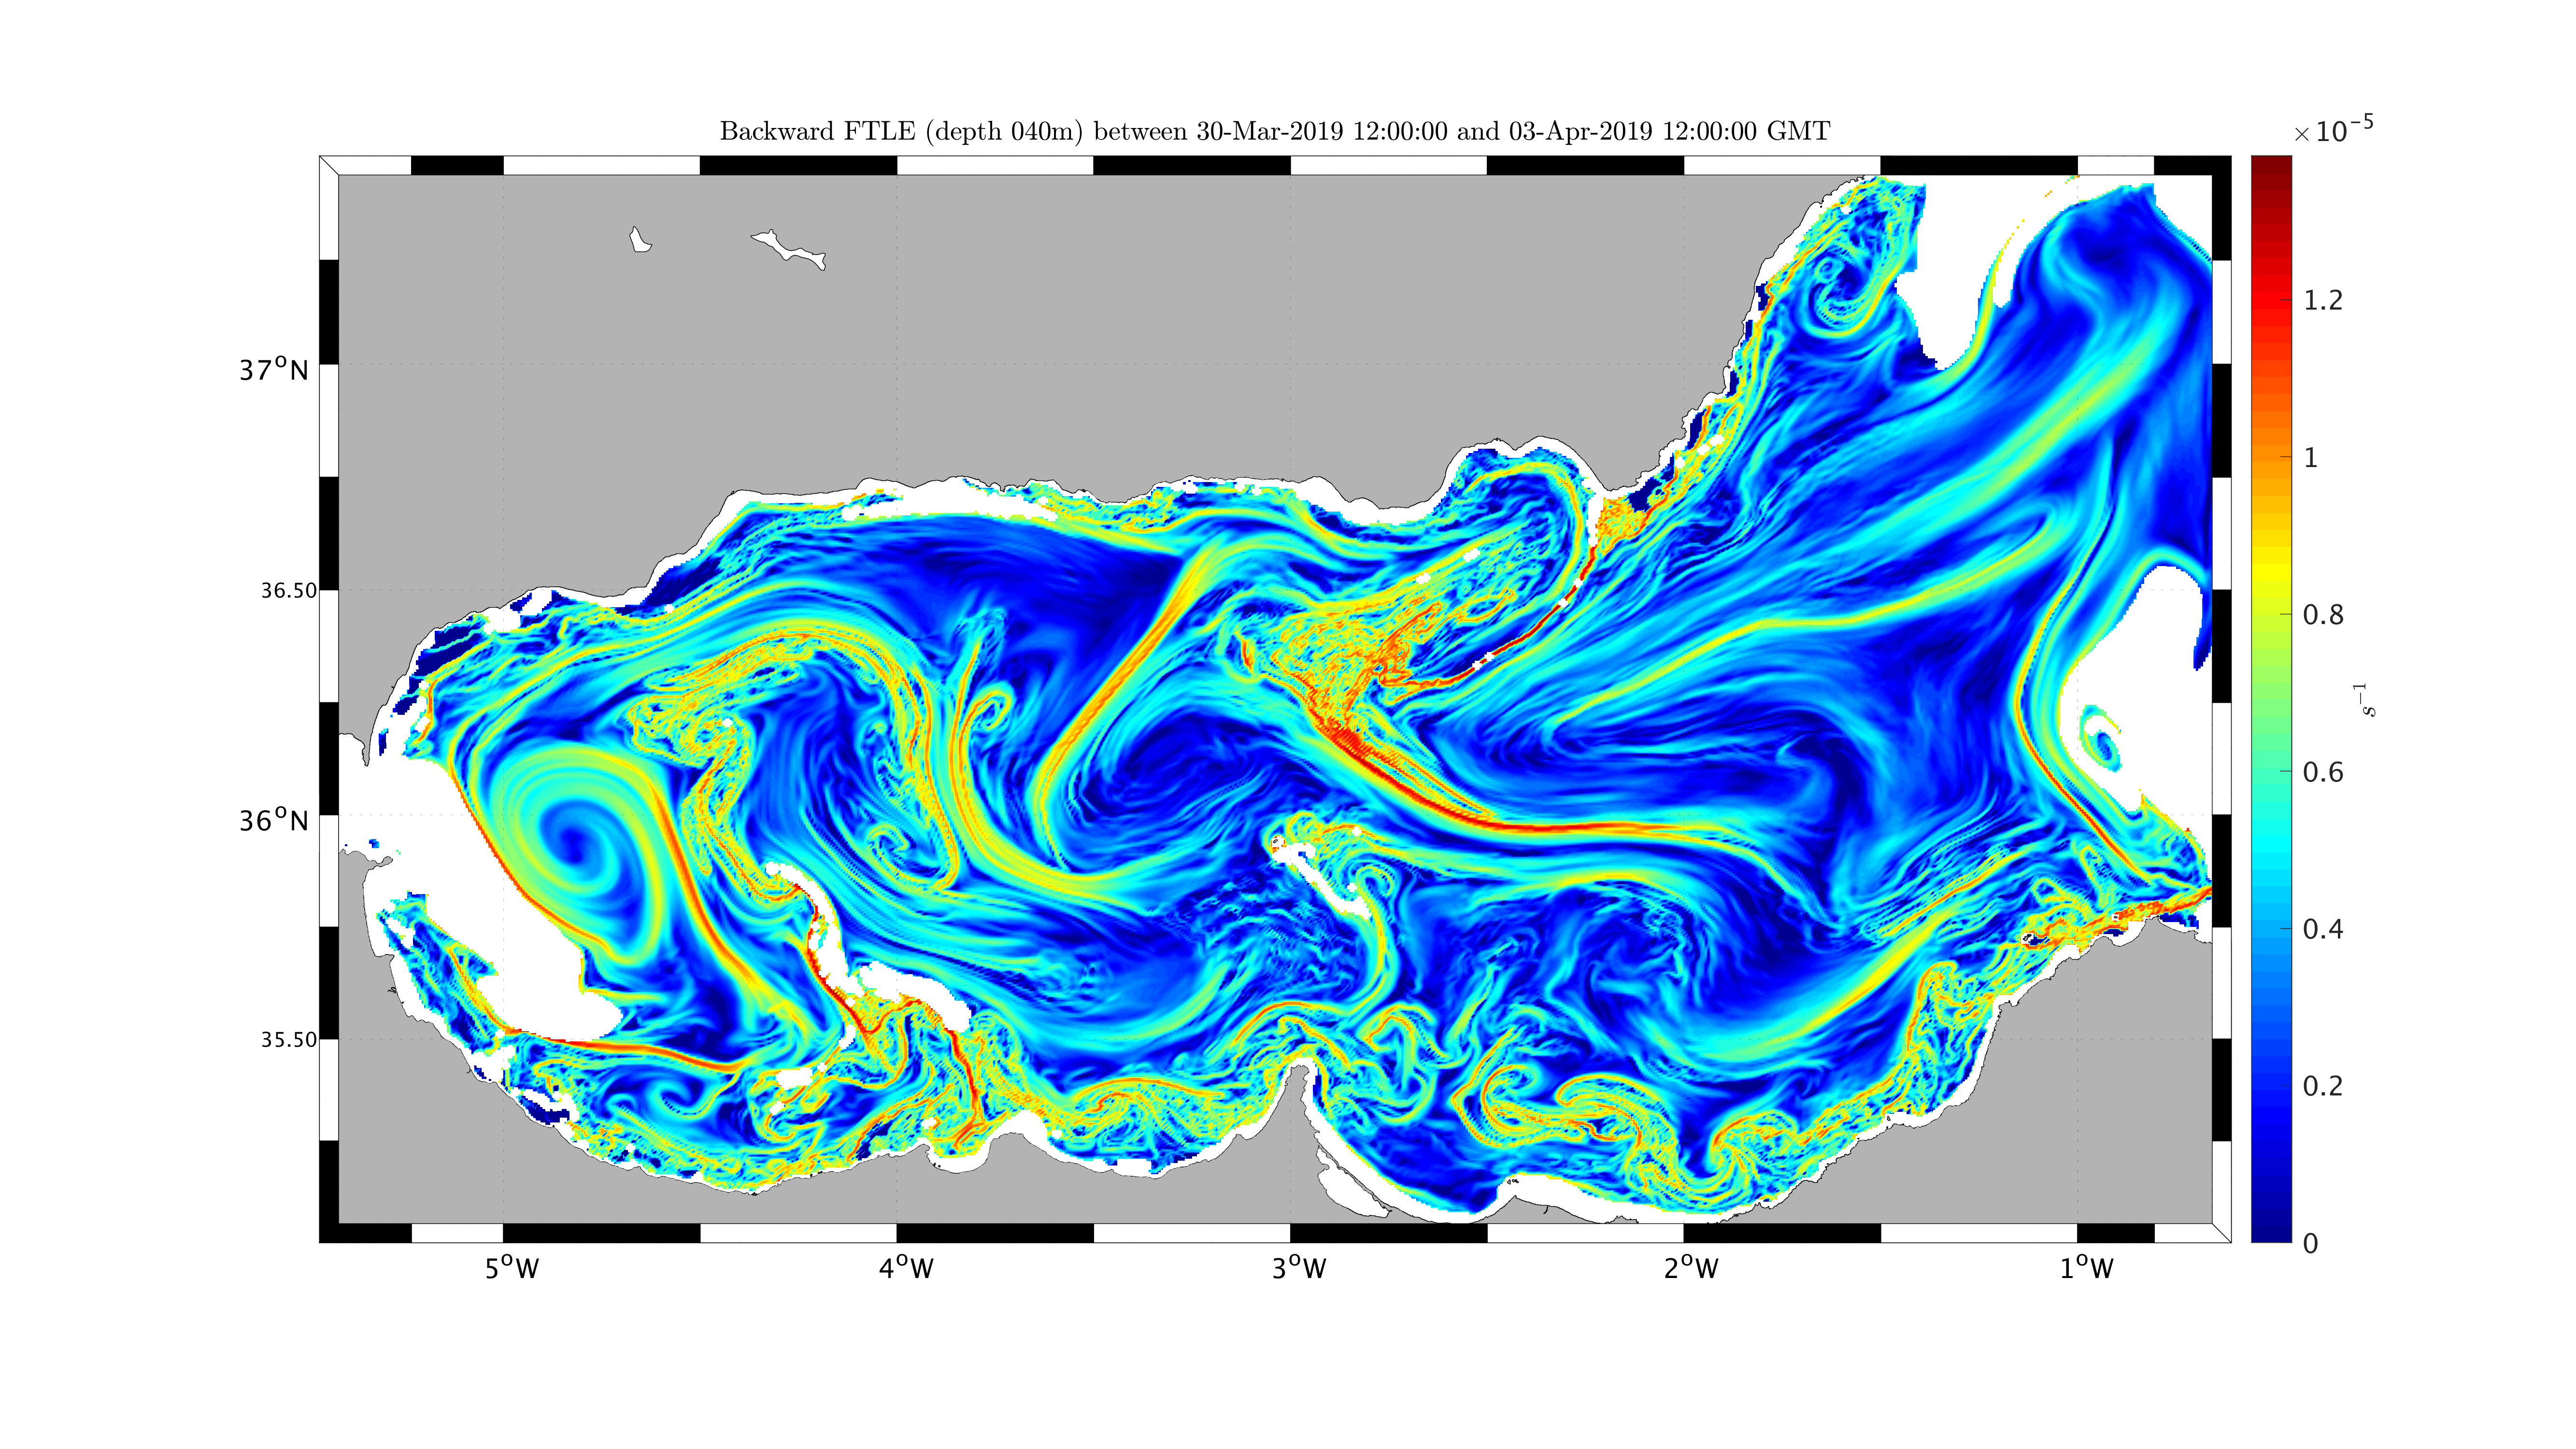
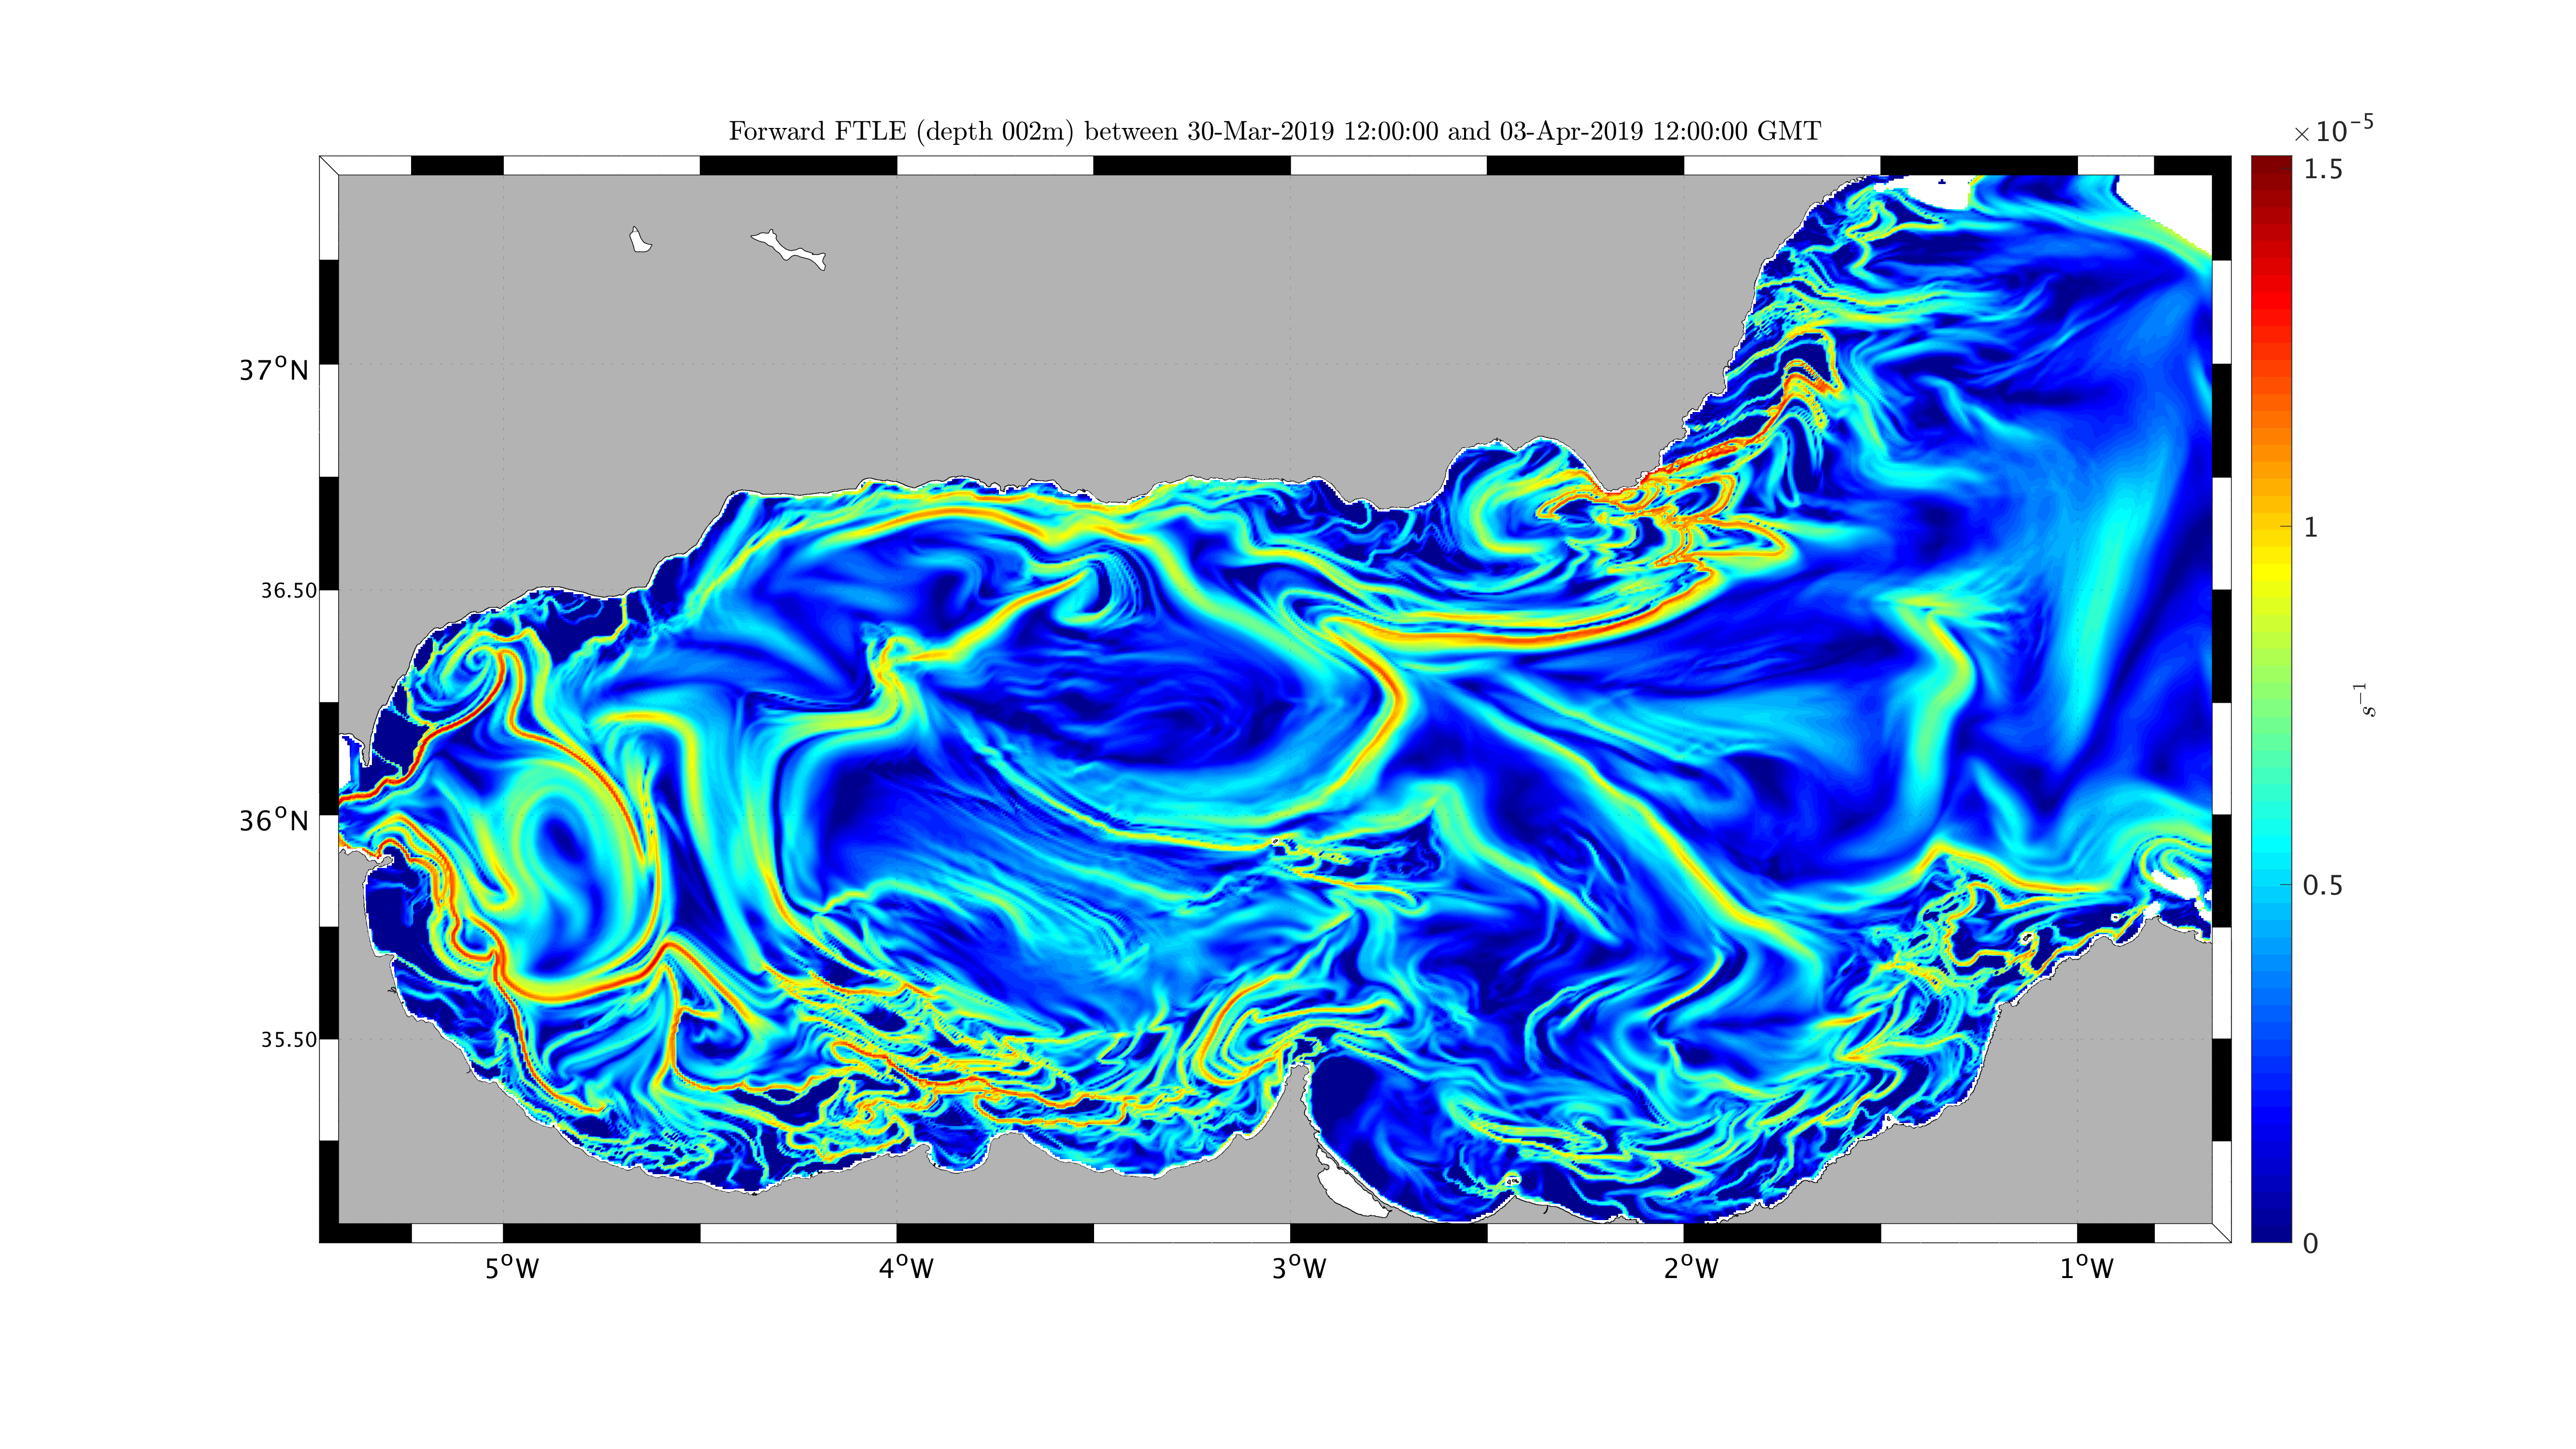
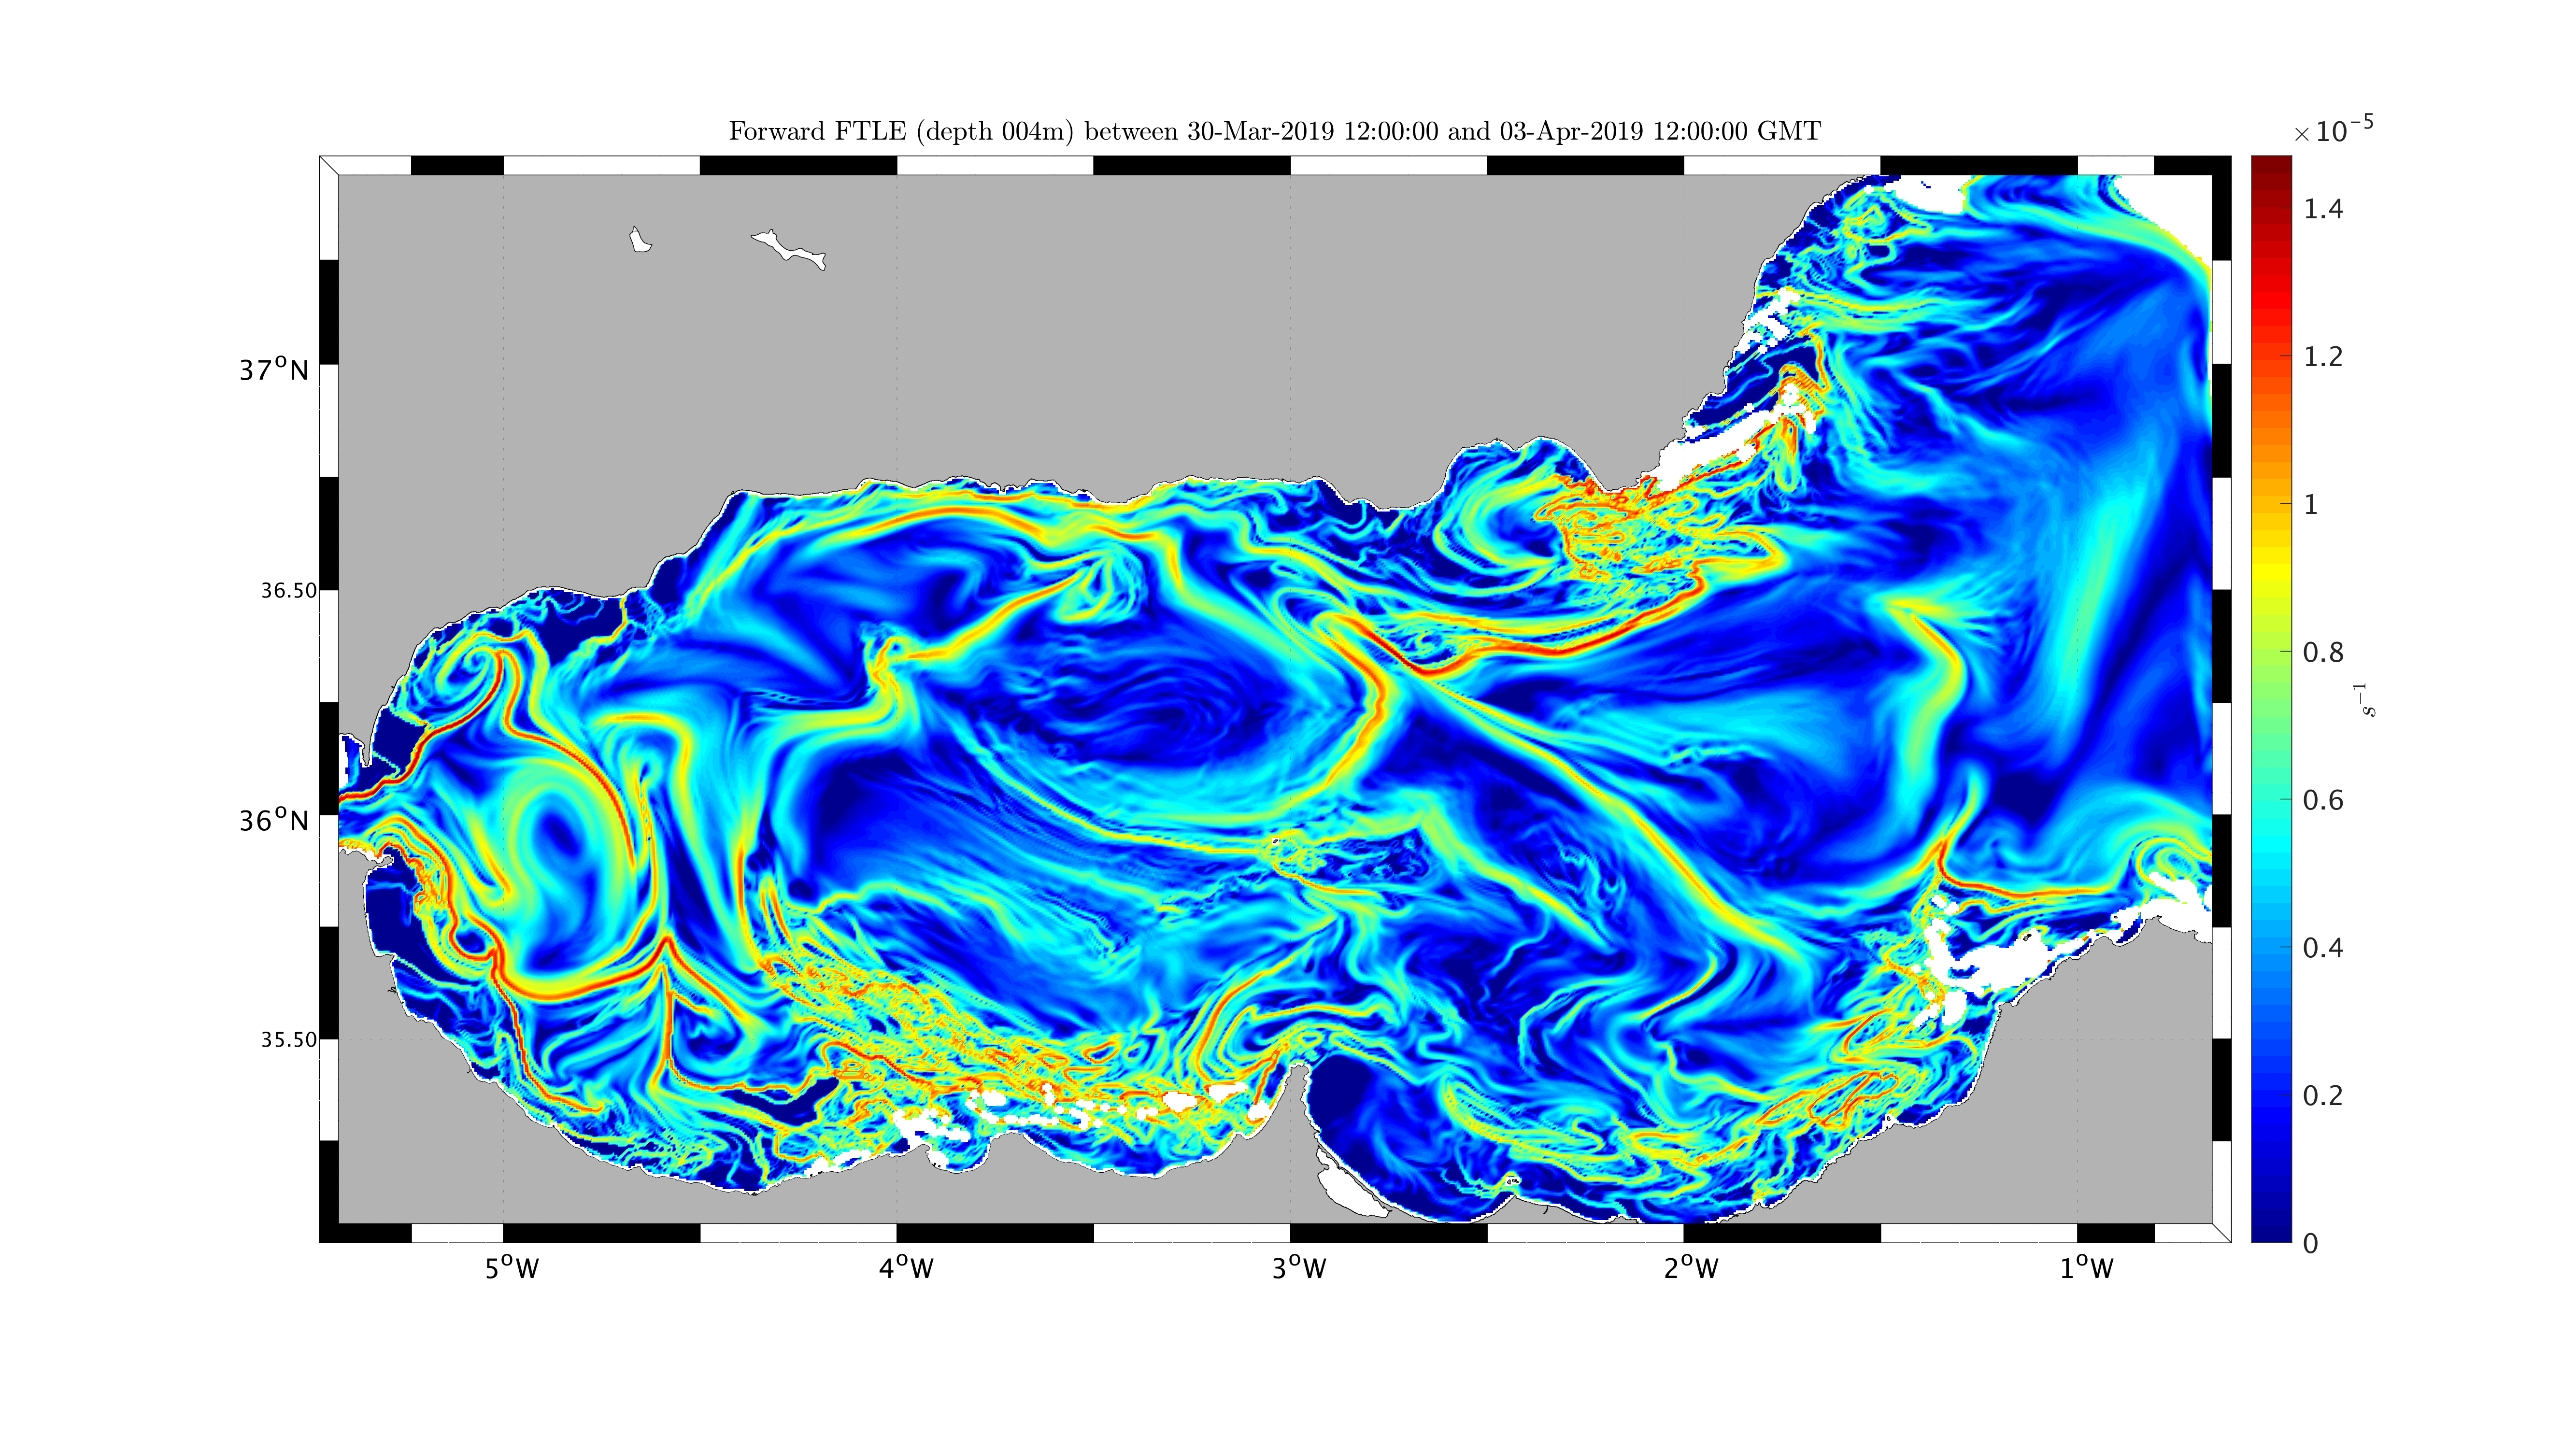
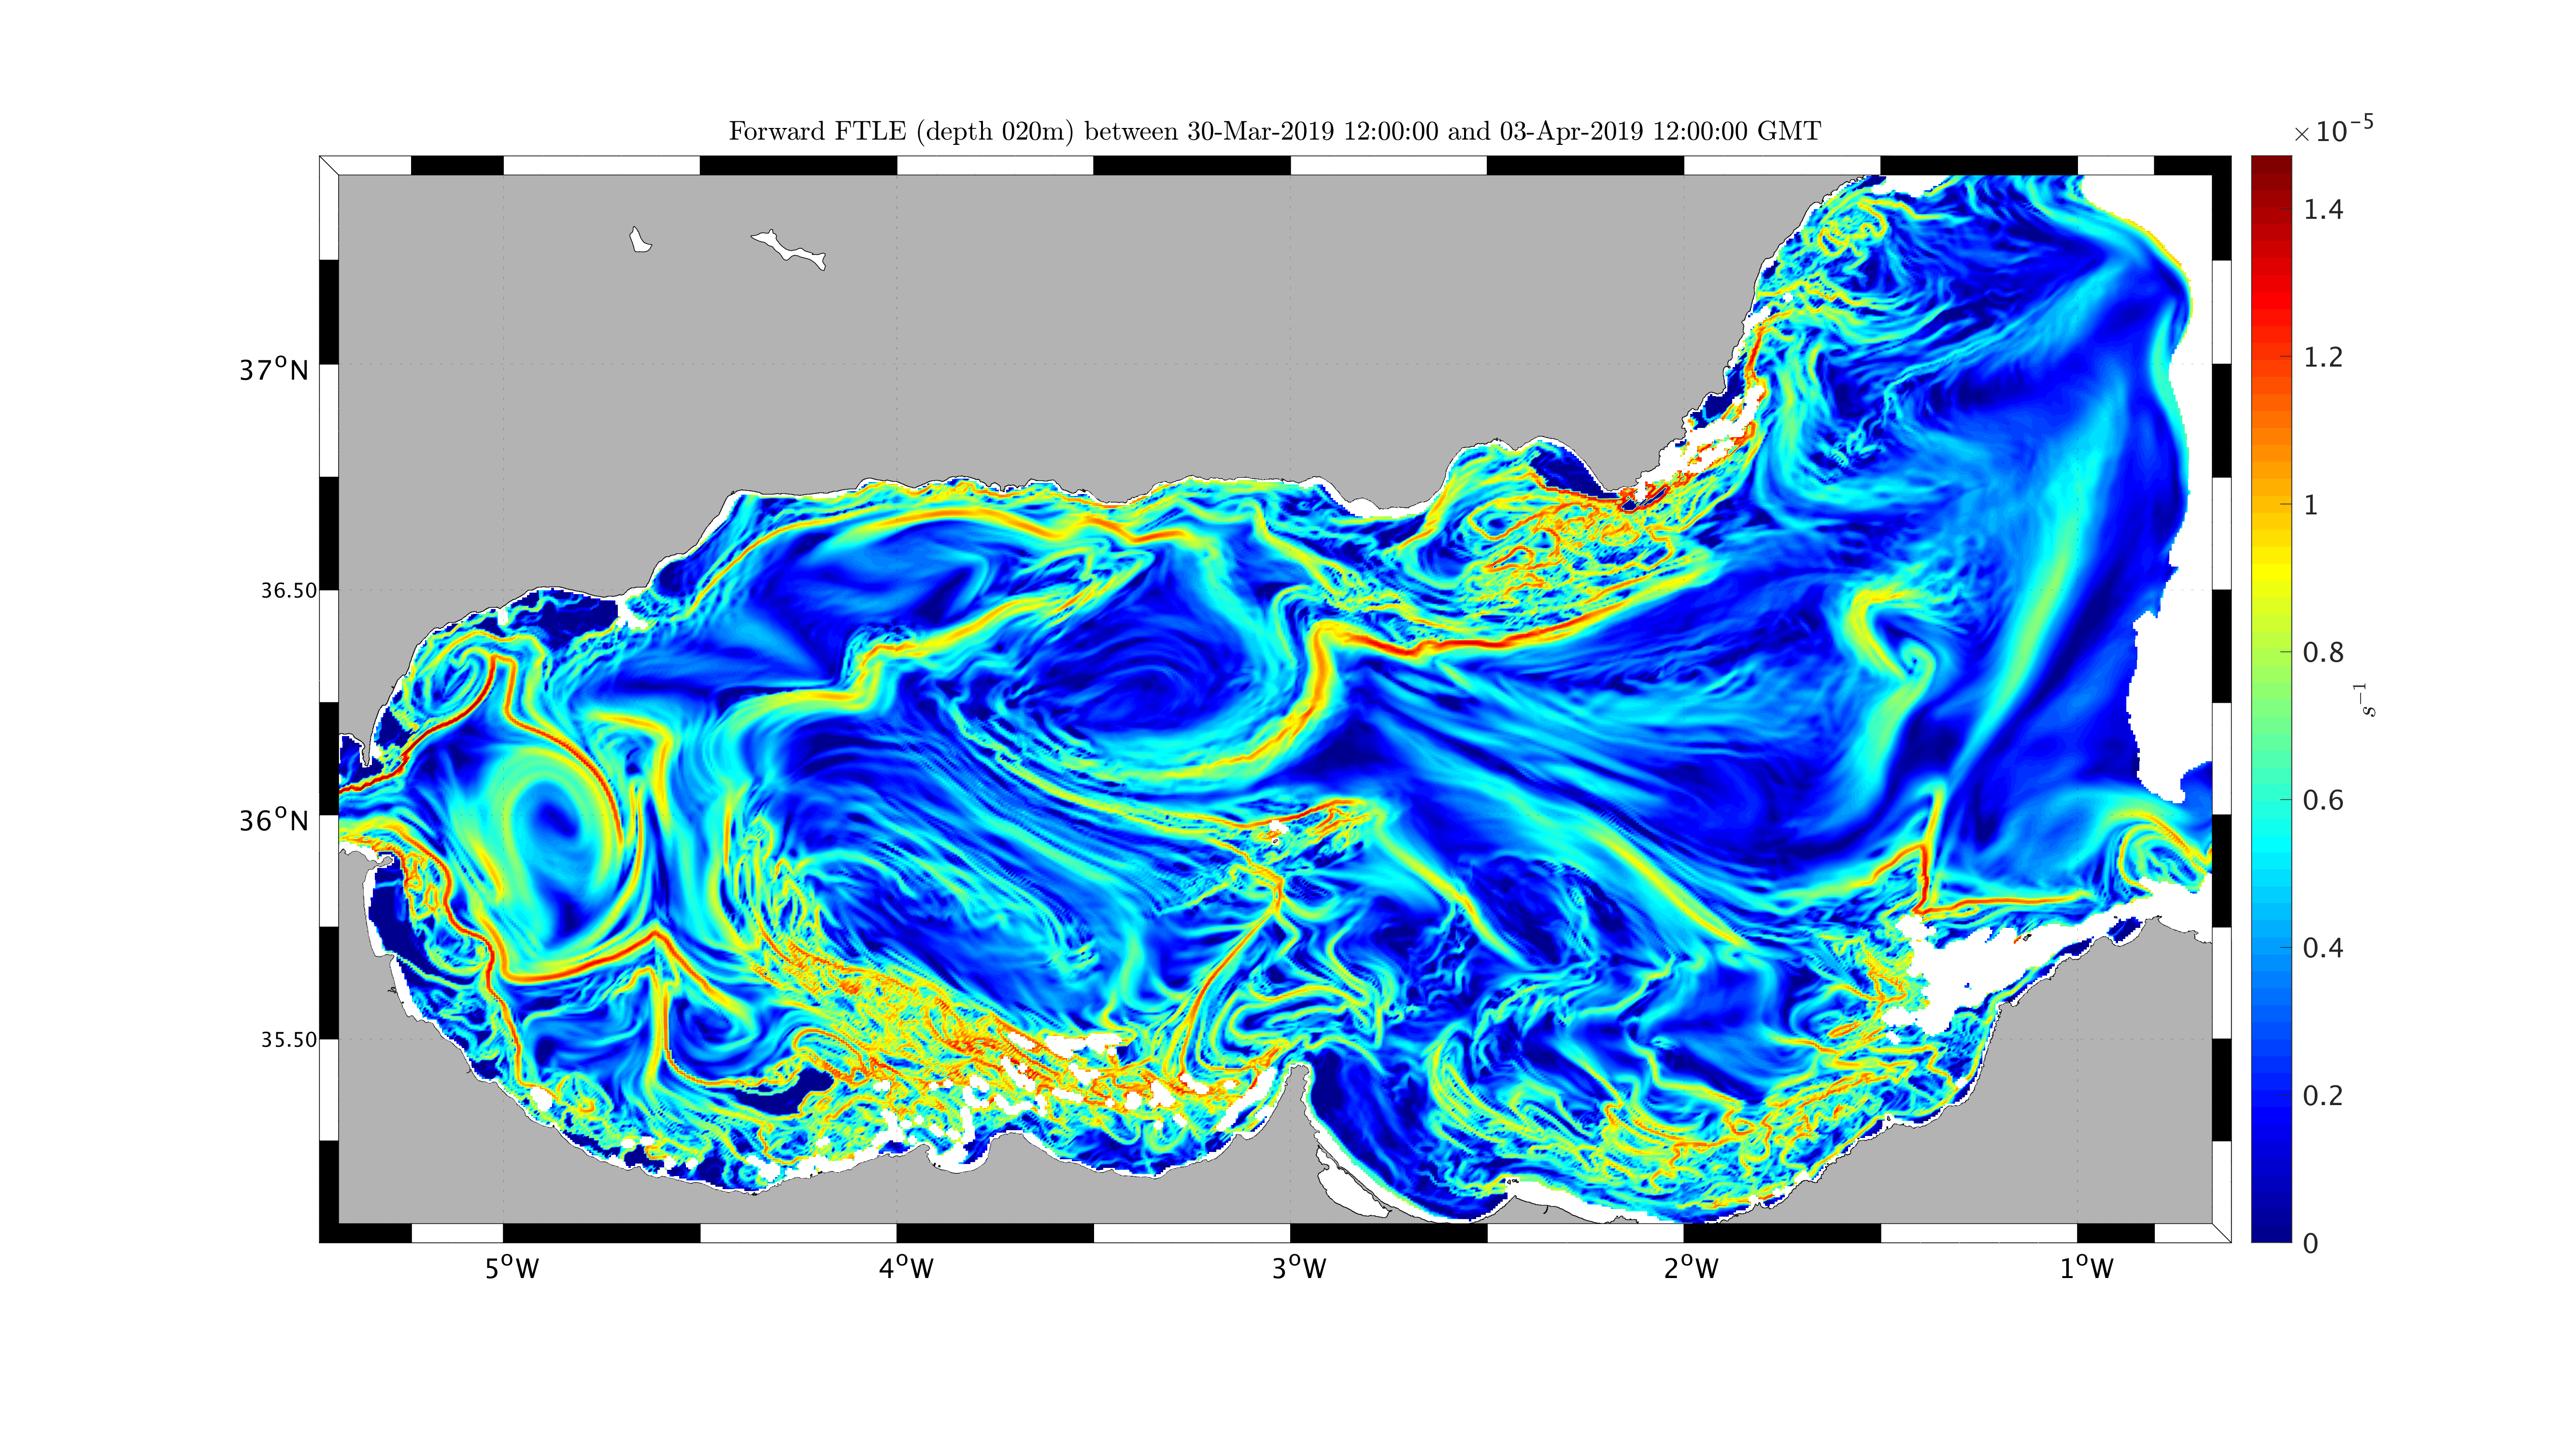
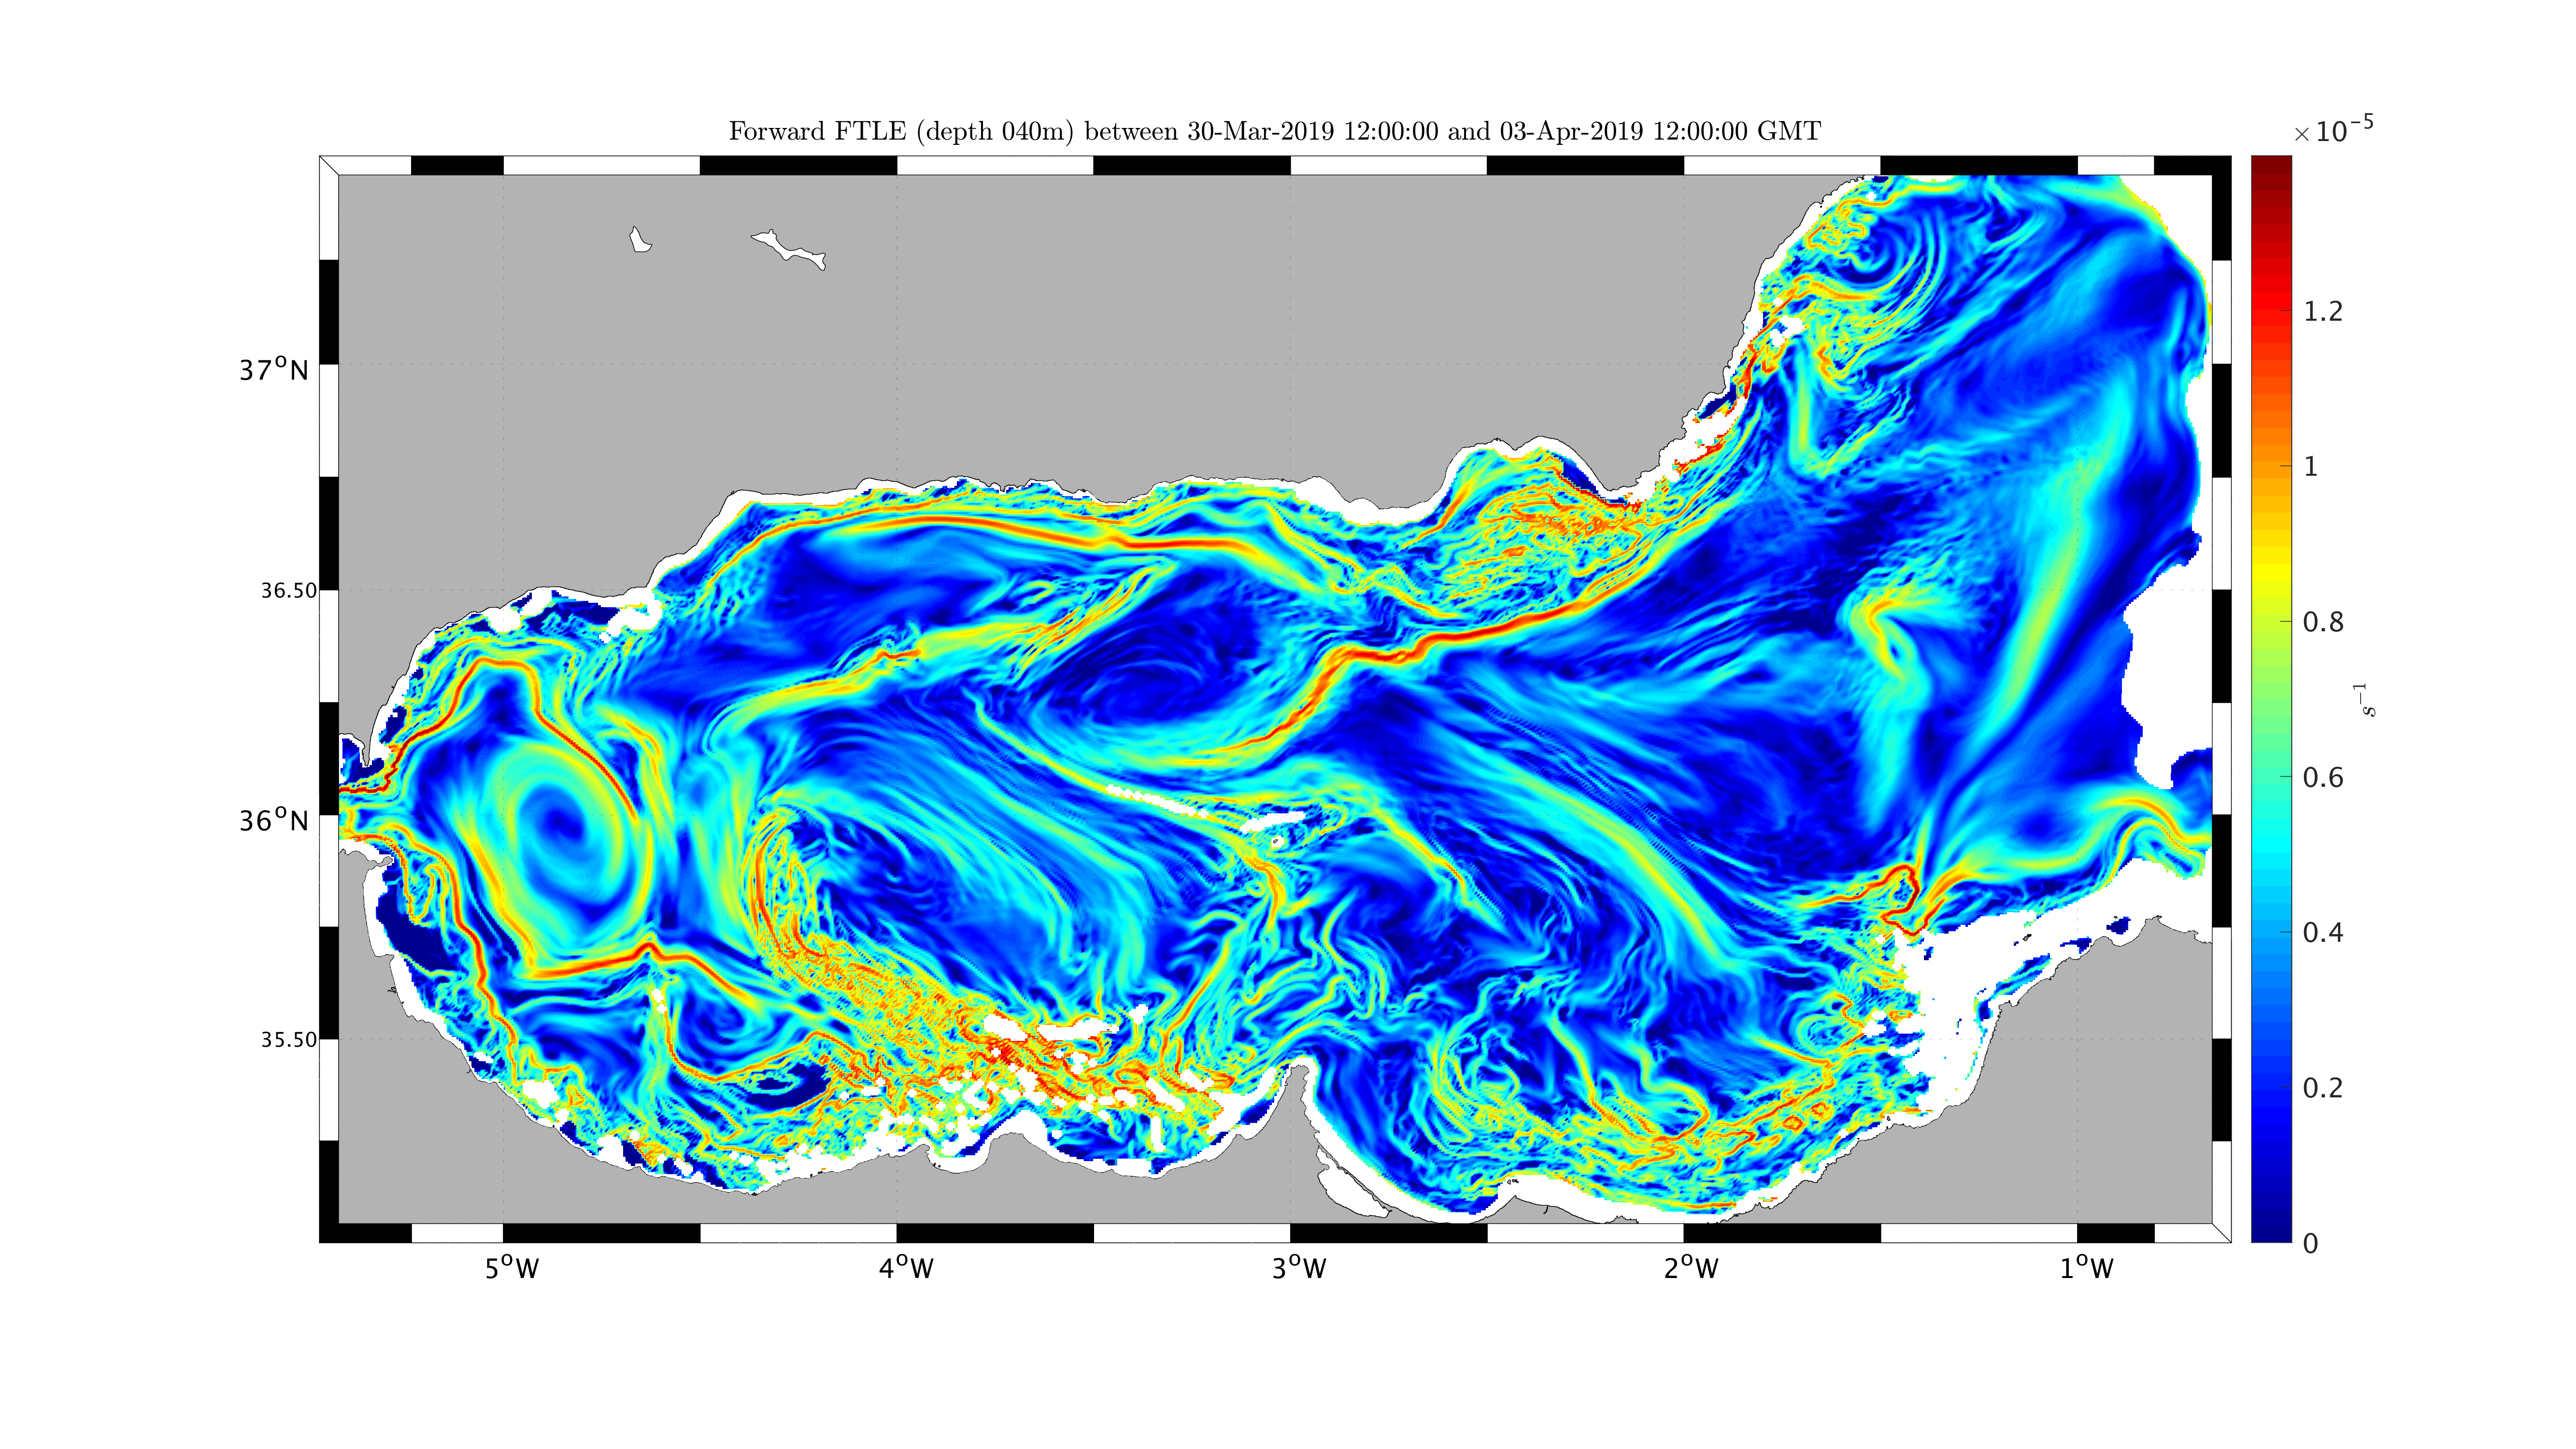
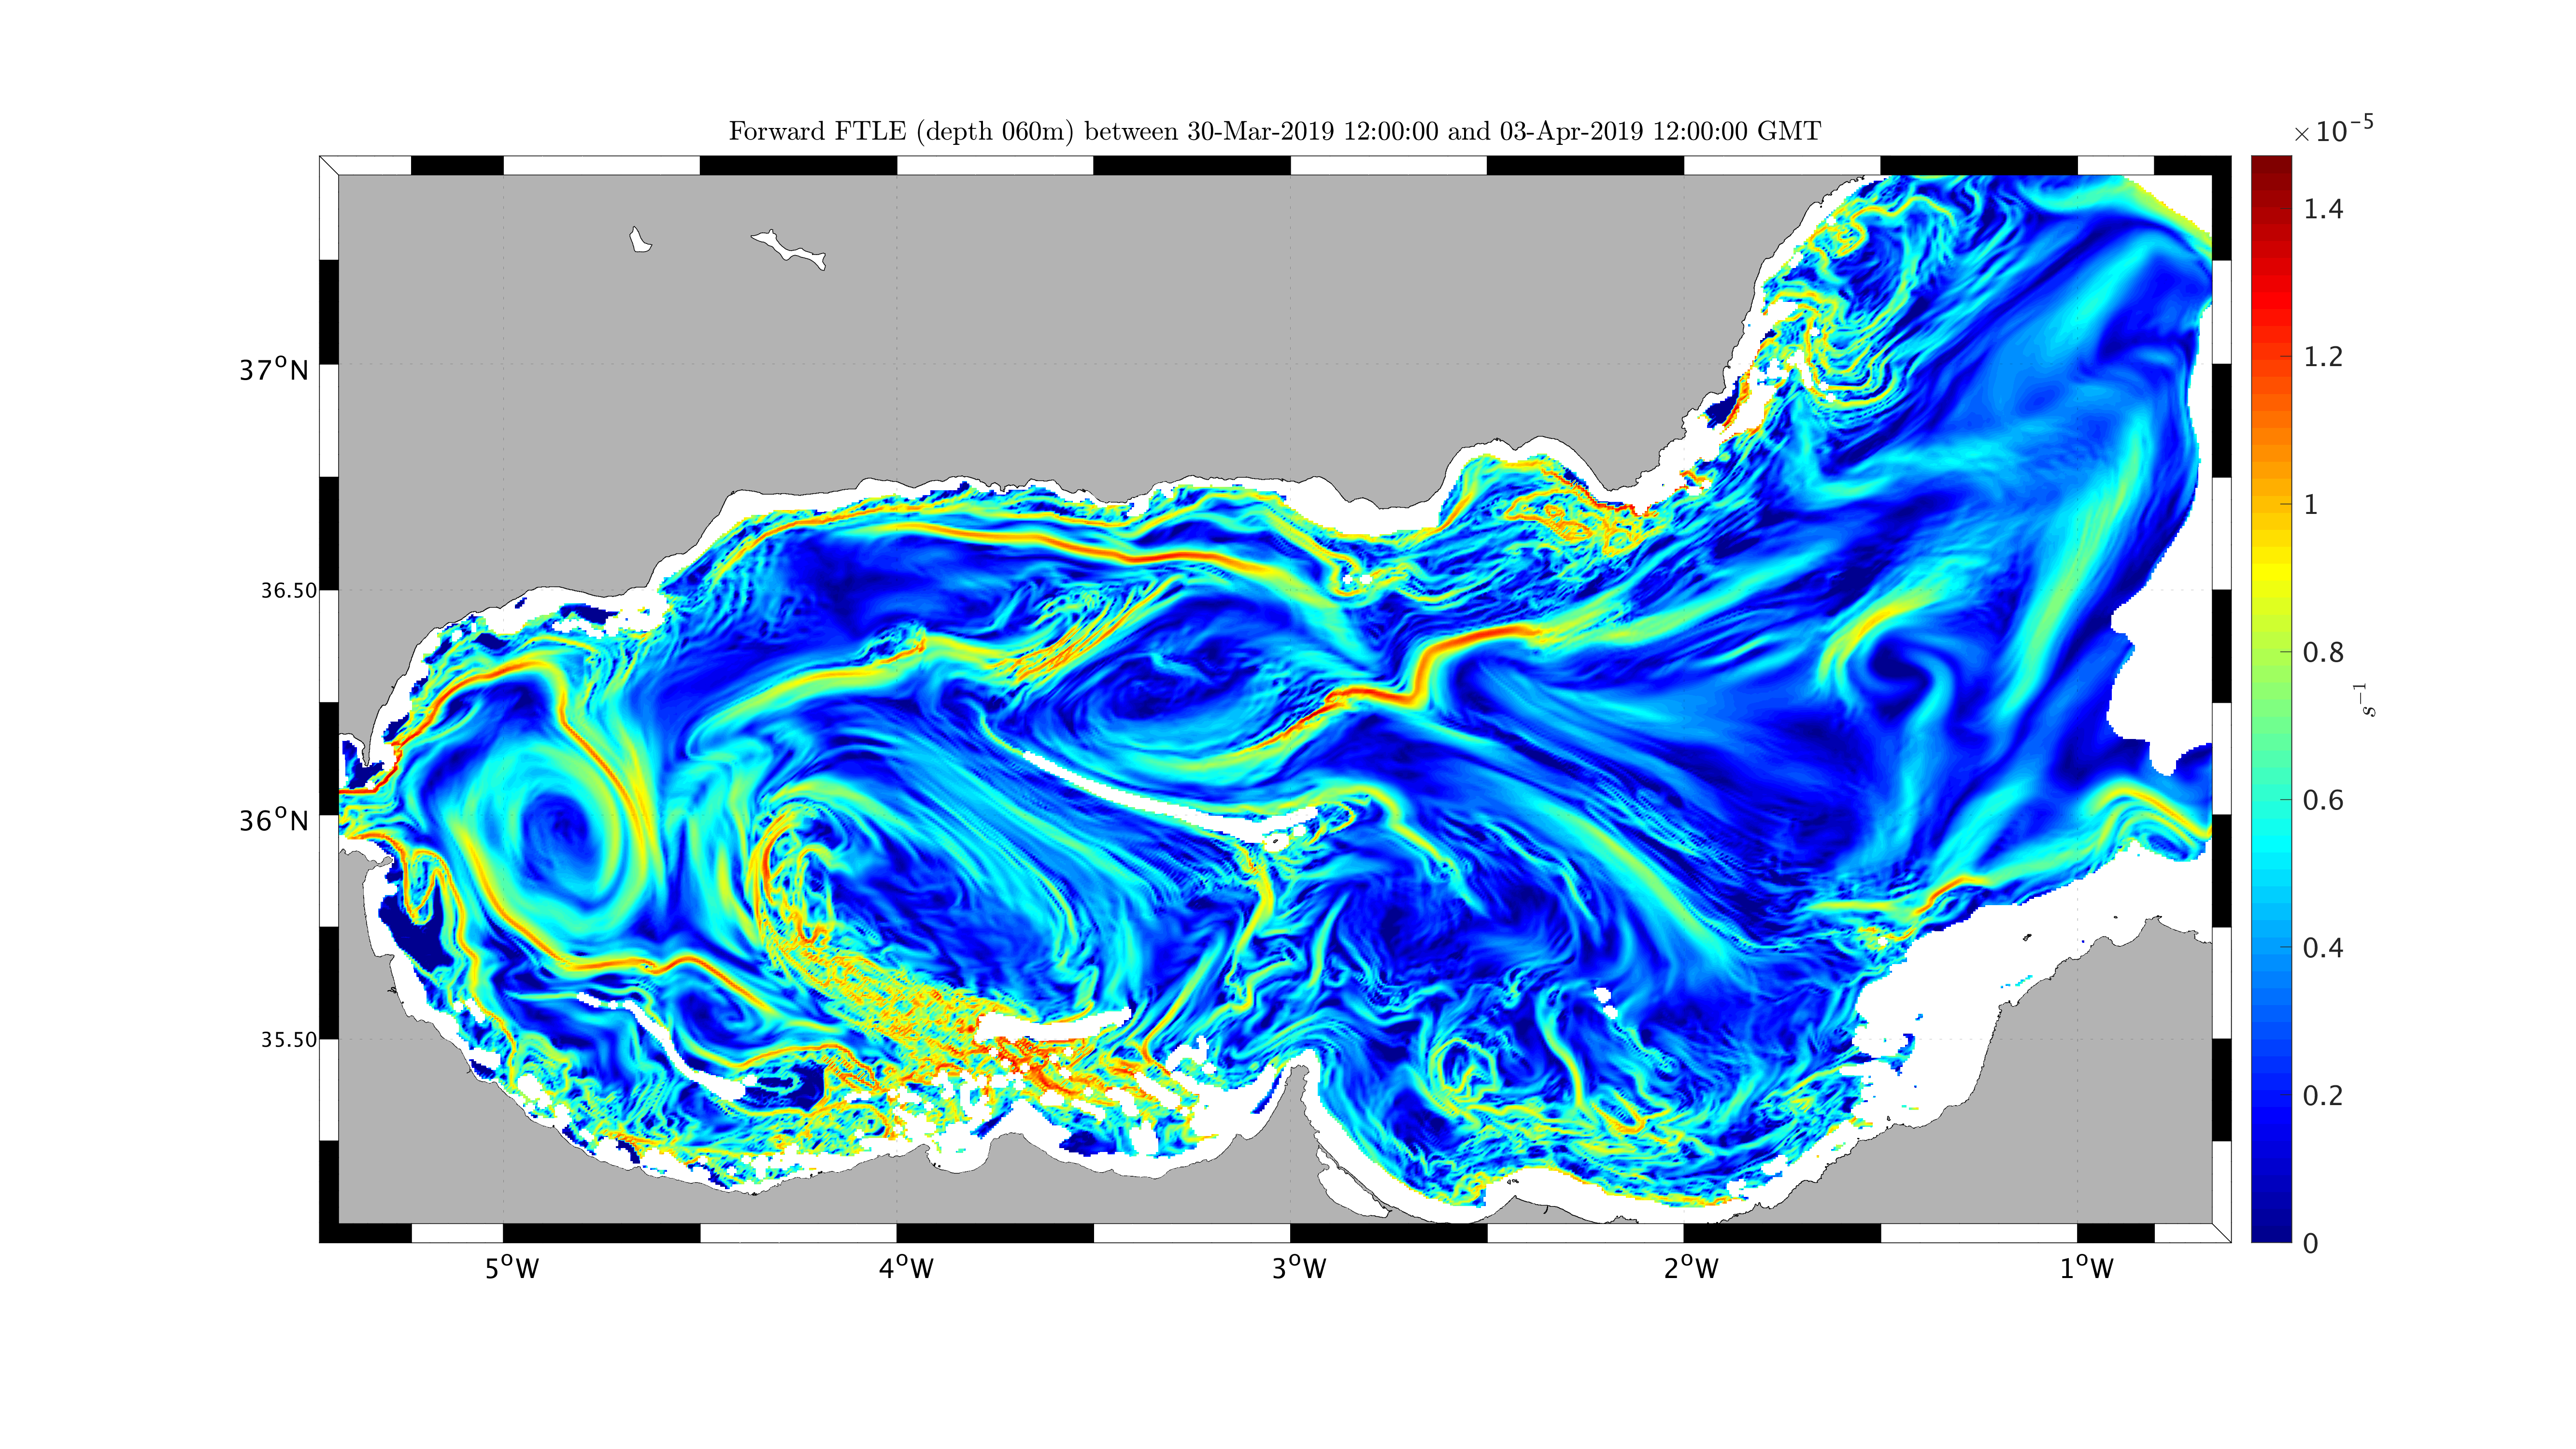
As also shown in the forecast below, the ridges of the forward Finite-Time Lyapunov Exponents (FTLEs) are the repelling FTLE structures: they tend to 'repel' water parcels. Two parcels that are close to each other at t=0 but on different sides of the forward FTLE ridge will advect further away from each other than other parcels. The ridges of the backward FTLEs are the attracting FTLE structures: they tend to 'attract' water parcels.
The figures for 30 Mar 1200Z to 3 Apr 1200Z 2019 presented below illustrate the MSEAS forecast of 3D subduction. The winds have weakened and turned to intermittent wind bursts to the south-southwest. This results to 3D downwelling along portions of the coast of Africa. The 3D subduction is forecast to take place along the corresponding (sub)-mesoscale eddies and frontal structures as well as along a converging front originating at Cabo Quilates and advecting to the north-northwest. Additional 3D subduction is still forecast to occur along eddies and fronts off the Spanish coastline, but much less than a few days ago. Note that there is a direct relation between these 3D subduction pathways (from above 10m depth to deeper than 50m depth) and the 3D attracting Lagrangian Coherent Structures that we forecast (see the maps of the forecast 3D backward FTLE fields below).
| Time & Depths | Top View | 3D View | Side View |
|---|---|---|---|
| t0 and upper 10m |
|
|
|
| t0 + 48 hours |
|
|
|
| t0 + 96 hours and water reaching 60m |
|
|
|
| Overlaid |
|
|
|
| Depth | 2 m | 4 m | 20 m | 40 m | 60 m |
|---|---|---|---|---|---|
| March 30 - April 3 |
 |
 |
 |
 |
 |
| Depth | 2 m | 4 m | 20 m | 40 m | 60 m |
|---|---|---|---|---|---|
| March 30 - April 3 |
 |
 |
 |
 |
 |
| Return to the MSEAS: | ||
| CALYPSO real-time web page | CALYPSO web page | Home page |