Initialized from downscaled Mercator
Click on any depth label for a full set of plots.
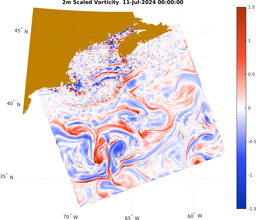
| Snapshot Time-Series of the Estimated Ocean State (every 12 hours) | |||||||||||||||||||||||||||||||
|---|---|---|---|---|---|---|---|---|---|---|---|---|---|---|---|---|---|---|---|---|---|---|---|---|---|---|---|---|---|---|---|
| NW-Atlantic Modeling Domain (2.4km resolution) | |||||||||||||||||||||||||||||||
|
|
||||||||||||||||||||||||||||||
|
|
||||||||||||||||||||||||||||||
|
|
||||||||||||||||||||||||||||||
|
|||||||||||||||||||||||||||||||

To obtain the MSEAS files, contact the MSEAS group.
The file names can be interpreted as follows (all times are in UTC):