Click on any depth label for a full set of plots.
| Snapshot Time-Series of the Estimated Ocean State (every 3 hours) |
|---|
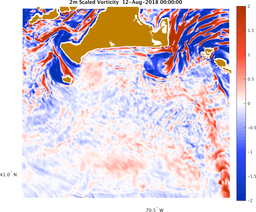
| Martha's Vineyard Modeling Domain (200 m resolution, Implicit-2-way Nested) |
|
0m |
| Sigma-T |
Velocity |
Temperature |
Salinity |
 |
 |
 |
 |
|
|
10m |
| Sigma-T |
Velocity |
Temperature |
Salinity |
 |
 |
 |
 |
|
|
20m |
| Sigma-T |
Velocity |
Temperature |
Salinity |
 |
 |
 |
 |
|
|
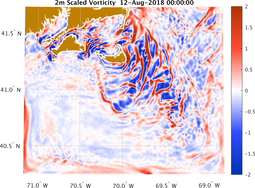
| Shelf Modeling Domain (600 m resolution, Implicit-2-way Nested) |
|
0m |
| Sigma-T |
Velocity |
Temperature |
Salinity |
 |
 |
 |
 |
|
|
10m |
| Sigma-T |
Velocity |
Temperature |
Salinity |
 |
 |
 |
 |
|
|
20m |
| Sigma-T |
Velocity |
Temperature |
Salinity |
 |
 |
 |
 |
|
|