Deceased Right Whale #2701 - Predicted Path
HARVARD OCEAN PREDICTION SYSTEM
Harvard Predicted Paths
NOAA Fisheries Observation and Prediction Map
January 24 - 31, 2000
A.R. Robinson, P.J. Haley, Jr., W.G. Leslie
HARVARD UNIVERSITY
Division of Applied Sciences
Department of Earth and Planetary Sciences
Cambridge, Massachusetts
(617)495-2819
http://www.deas.harvard.edu/~robinson
Accessibility

Using the Harvard Ocean Prediction System, the potential paths
of the remains of a deceased Right Whale have been estimated and forecast
for the period 23 - 31 January, 2000.
The results presented here were completed on 29 January.
For this application, a modeling domain with a horizontal resolution of .045
degrees (~5km) and 42 vertical sigma (terrain following) levels is utilized.
The simulation assimilates sea surface temperature from satellite observations
(when available)
and is forced by Fleet Numerical Meteorology and Oceanography Center (FNMOC)
winds. The simulation is for the period 20 January - 1 February.
Predicted Paths
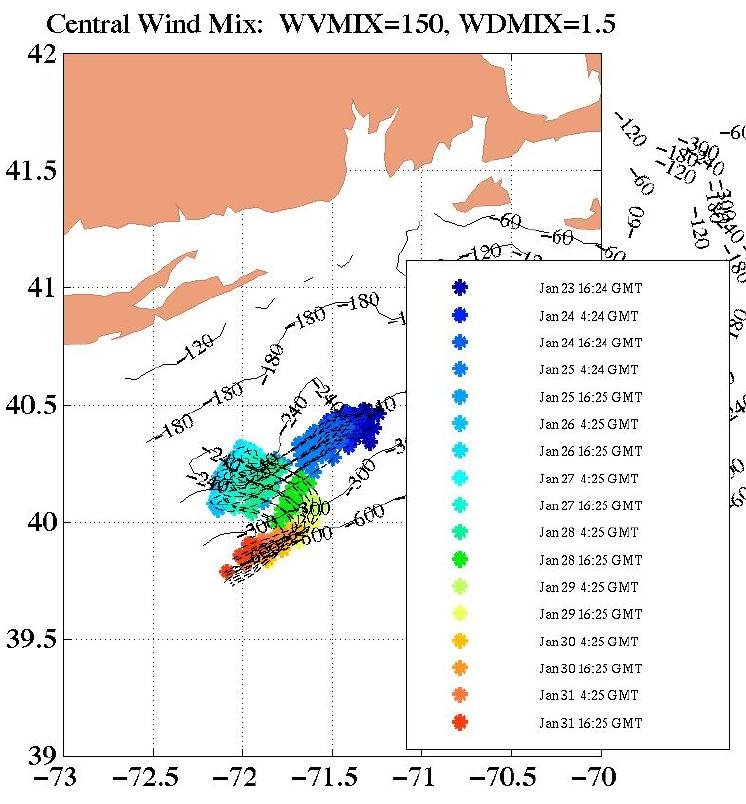
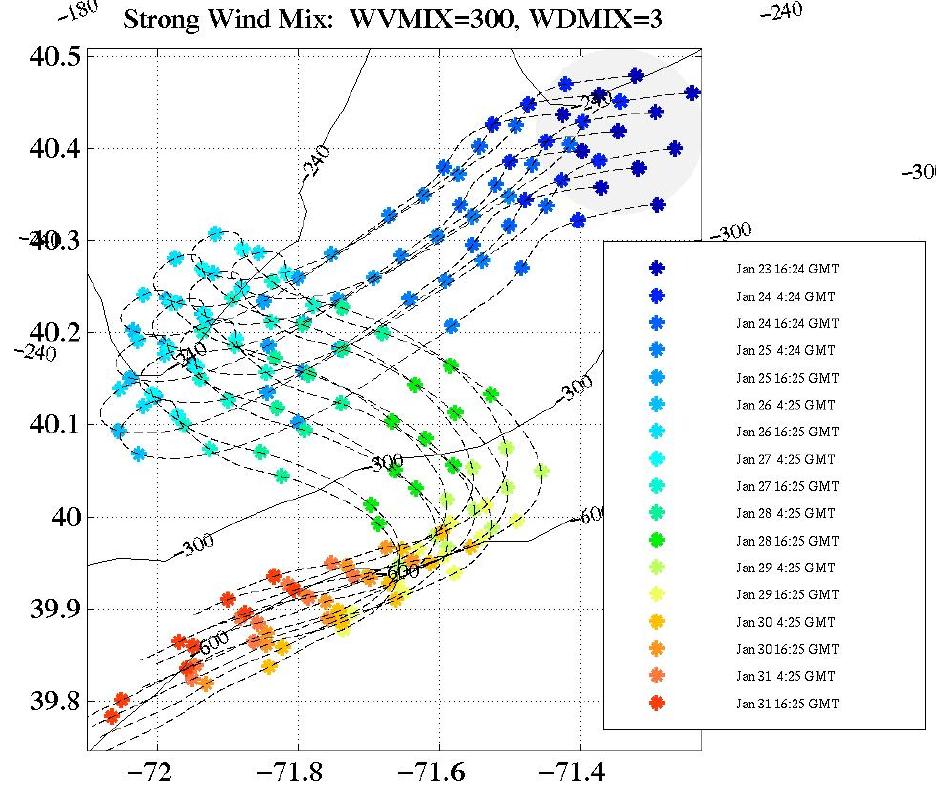
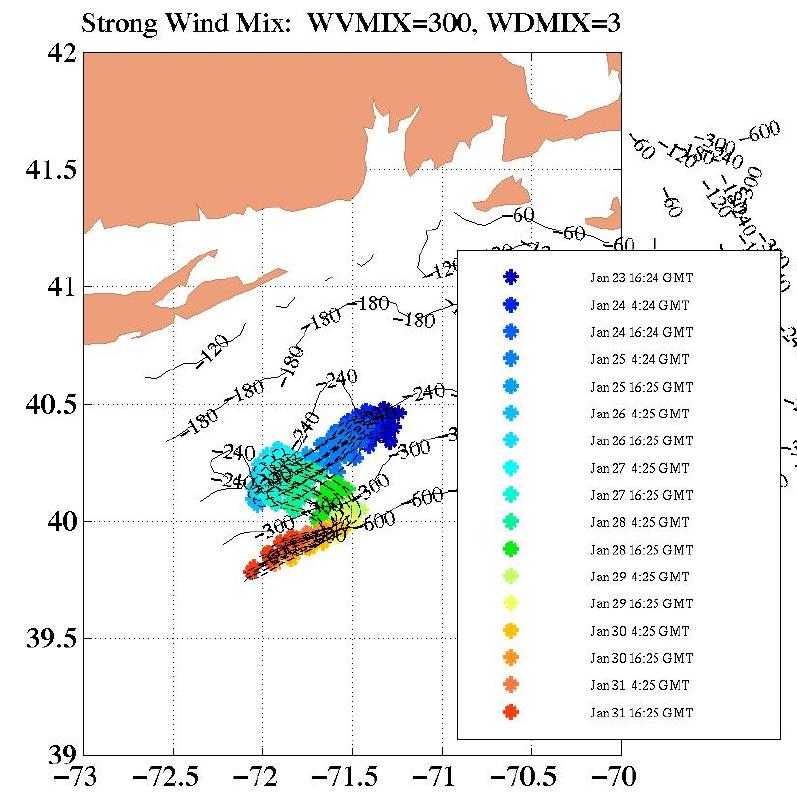
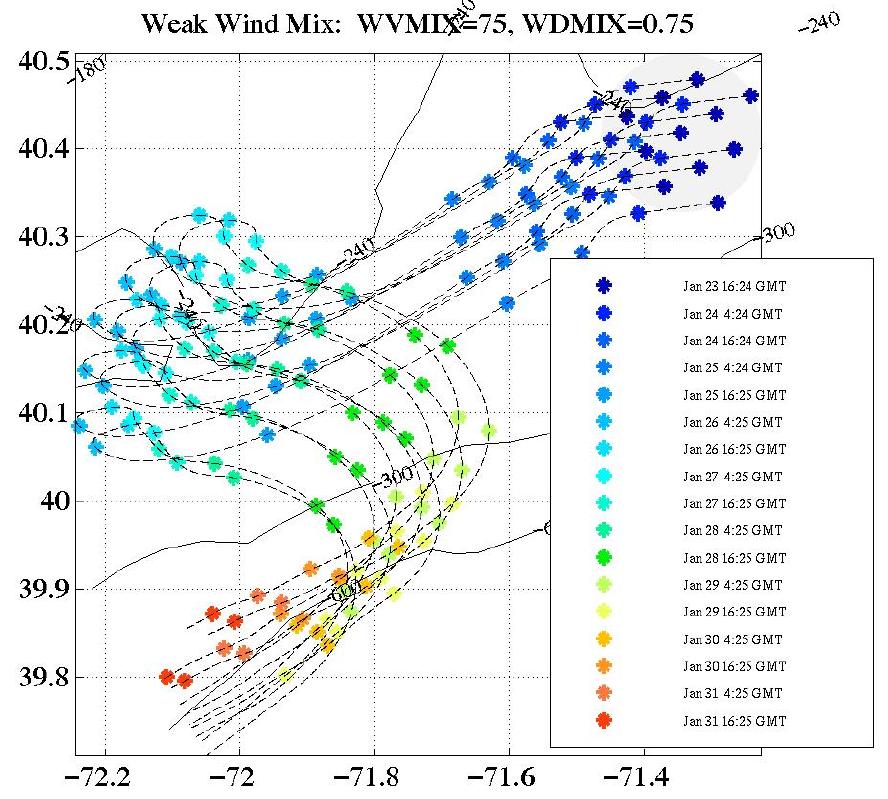
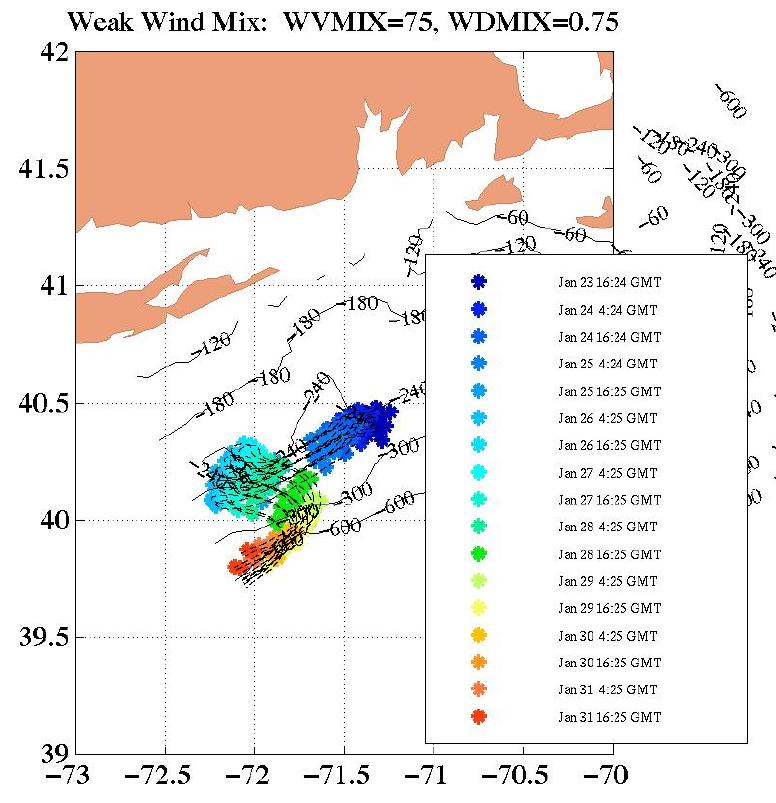
The figures below depict the potential predicted drift paths of the whale remains
for the period 23 January - 1 February. The gray circle indicates an area 10km in radius
from the last known observation of the Right Whale. Particles located within
the gray circle at the time of the last sighting (1120 EST 23 January) are tracked for the
duration of the simulation period. The paths of these particles are plotted
for every model time step. 12 hour intervals are indicated by the asterisks.
Bottom contours are labeled in feet.
Overall, the trajectories of the floating debris are dependent upon
the winds (strength, direction and pattern) and
the internal ocean dynamics (meandering shelfbreak front,
westward sluggish shelf currents and eddies, etc.).
The surface currents of the front are westward-southwestward,
meandering approximately along the path of the 300 foot isobath.
The prevailing wind patterns have forced the whale generally southwestward, interrupted
by a significant loop created by the strong storm on January 25-26.
The left-hand figures focus on the patterns of the trajectories, while the right-hand
figures are plotted on the same lat/lon scale as the NOAA figure below.
|
Central Model Run (Zoom)
|
Central Model Run
|

|
|
|
Strong Wind Mixing (Zoom)
|
Strong Wind Mixing
|
|
|
|
Weak Wind Mixing (Zoom)
|
Weak Wind Mixing
|
|
|
(Click on each image for larger size version)
Return to top of document
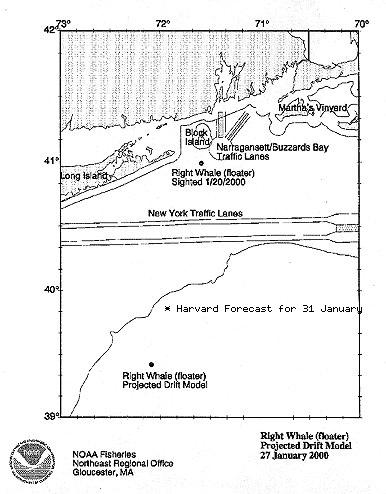
NOAA Fisheries Observation and Prediction Map
The figure below from NOAA depicts the location of the deceased Right Whale on 20 January
and the potential location of the whale on 27 January from a US Coast Guard 'drift model'.
The observation of the whale on 23 January at 40.42N, 71.35W has not been included on the
NOAA map. The location of the Harvard forecast position for 31 January has been
added to the NOAA map.
The Center for Coastal
Studies described the situation in this manner:
"The right whale research community has spent much of the last week trying
to reclaim the body of a right whale found floating off the coast of Block
Island, NY. The whale was spotted by a fisherman over a week ago and bad
weather has blocked all efforts to bring the body ashore for necropsy.
This is the third, known right whale death since late May, when the aerial
survey team found the body of 'Staccato' floating
in Cape Cod Bay. Researchers have been able to identify the whale from
video taken by the US Coast Guard during jet and helicopter surveys in
search of the animal. Despite the fact that the whale was found foating
belly up, the unique pattern of white on the throat and belly could be
clearly seen and matched. The whale has been identified as #2701, a three
year-old female and daughter of #1601. She was last seen alive in September
in the Bay of Fundy, Canada. Cause of death may remain unknown until a
necropsy can be performed".
Harvard Ocean Prediction System (HOPS)
HOPS is a flexible, portable and generic system for inter-disciplinary
nowcasting, forecasting and simulations. HOPS can rapidly be deployed to
any region of the world ocean, including the coastal and deep oceans and
across the shelfbreak with open, partially open or closed boundaries. Physical,
and acoustical, real time and at sea forecasts have been carried out for more
than fifteen years at numerous sites and coupled at sea biological forecasts
were initiated in 1997. The present system is applicable in waters from 10m depth
to several
thousand meters and the heart of the system is a primitive equation physical
dynamical model.
This page was last revised at 2230 31 January 2000.
Return to top of document