Initialized from downscaled HYCOM
Click on any depth label for a full set of plots.
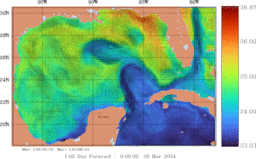
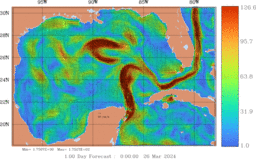
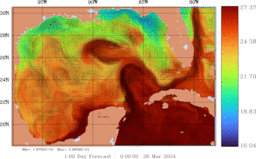
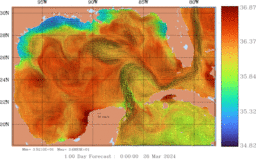
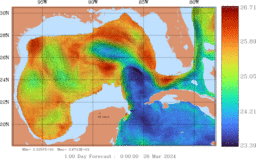
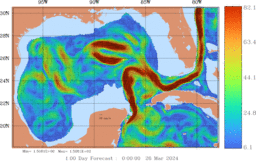
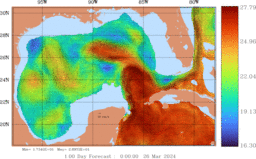
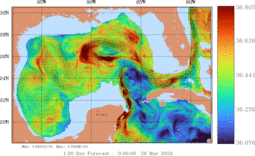
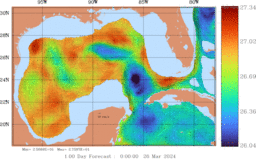
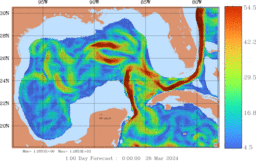
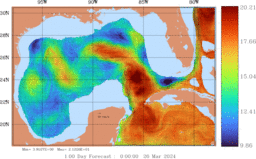
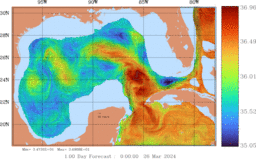
| Snapshot Time-Series of the Estimated Ocean State (every 24 hours) | |||||||||||||||||||||||||
|---|---|---|---|---|---|---|---|---|---|---|---|---|---|---|---|---|---|---|---|---|---|---|---|---|---|
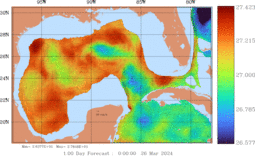
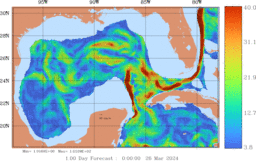
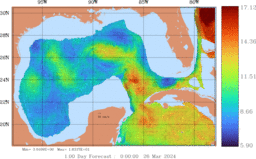
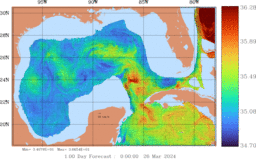
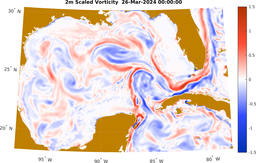
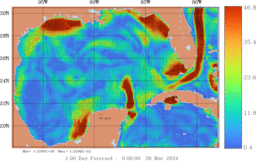
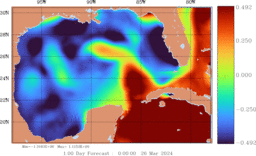
| Gulf Modeling Domain (1/25° resolution) | |||||||||||||||||||||||||
|
|
||||||||||||||||||||||||
|
|
||||||||||||||||||||||||
|
|||||||||||||||||||||||||
To obtain the MSEAS files, contact the MSEAS group.
The file names can be interpreted as follows (all times are in UTC):