Analysis and Forecasts for 15 Jun 0000Z to 17 Jun 0000Z 2017, Issued 15 Jun 2017

Click on any depth label for a full set of plots.

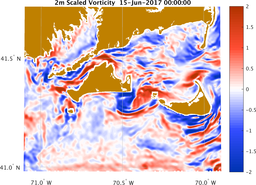
Snapshot Time-Series of the Estimated Ocean State (every 3 hours)
Full Modeling Domain
0m
Sigma-T Velocity Temperature Salinity
10m
Sigma-T Velocity Temperature Salinity
20m
Sigma-T Velocity Temperature Salinity
Vorticity, Barotropic Velocity, and Surface Elevation
2m Vorticity Barotropic Velocity Surface Elevation
 

To obtain the MSEAS files, click here.

The file names can be interpreted as follows (all times are in UTC):

            time of last
          analysis field          time of last
           in simulation        fields in file
              yyyymmddHH            yyyymmddHH
MIT_nsf_alpha_2017061500_2017061500_2017061700_01h.nc.gz
                         yyyymmddHH            HH
                      time of first    frequency with which
                     fields in file  fields are stored in file


Return to the MSEAS:
NSF-ALPHA real-time web page NSF-ALPHA web page Home page