Nantucket and Martha's Vineyard – June-July 2017
|
P.F.J. Lermusiaux, P.J. Haley, S. Jana, C. Mirabito, C. Kulkarni, A. Dutt, A. Gupta Massachusetts Institute of Technology Center for Ocean Engineering Mechanical Engineering Cambridge, Massachusetts
|
Real-time modeling Data sources |
|
|
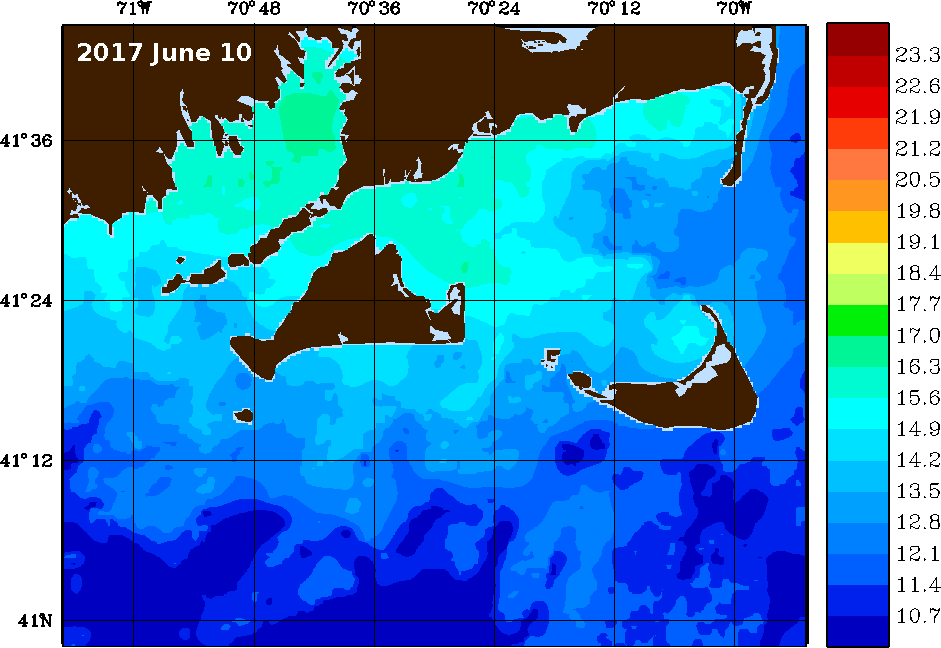
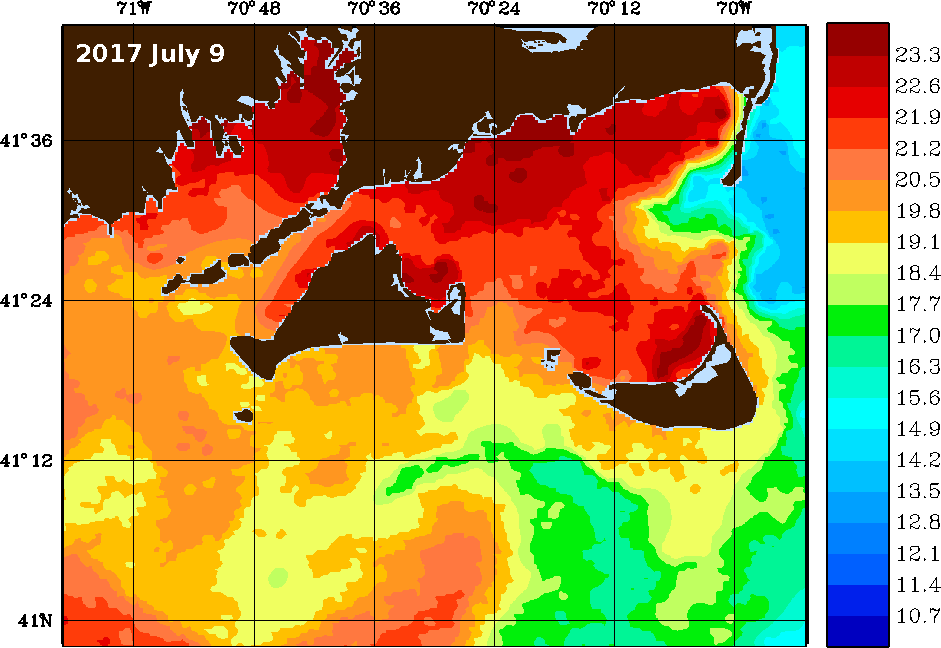
The NSF-ALPHA 2017 Virtual Forecasting Exercises occured in the Nantucket and Martha's Vineyard coastal region during June 14-16, 2017, and July 18-21, 2017, periods. The MIT-MSEAS Primitive-Equation (PE) ocean-modeling system is utilized in real-time to provide ocean forecasts for Lagrangian transport and coherent structure analyses in the region. The ocean forecasts are initialized using historical and synoptic ocean CTD data from the National Marine Fisheries Service (NMFS) and the Martha's Vineyard Coastal Observatory (MVCO), SST images from the Johns Hopkins University's Applied Physics Lab (JHU APL), and other data from varied sources of opportunity. These ocean simulations are forced by atmospheric flux fields forecast by the National Centers for Environmental Prediction (NCEP).
Our longer-term goal is to utilize our modeling systems for stochastic Lagrangian predictions and hazards assessment and mitigation. The specific objectives of the real-time exercises are to: (i) forecast the regional high-resolution ocean fields and their probability, using our ESSE methodology; (ii) utilize these fields and our Lagrangian methods to forecast Lagrangian Coherent Structures and Coherent Sets; (iii) forecast the probability and quantify the uncertainty of such Lagrangian quantities using stochastic differential equations. We thank all of the NSF-ALPHA team members for their inputs and collaboration.
This research is sponsored by the National Science Foundation.
Real-time MSEAS Forecasting
- MSEAS Ocean Forecasts
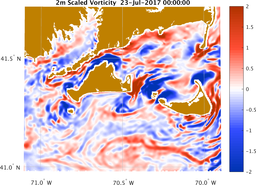
Real-Time Estimates of Present (23 Jul 0000Z) Environmental Conditions Full Modeling Domain MVCO Section Temperature 2m Vorticity Forward FTLE Backward FTLE Temperature Salinity 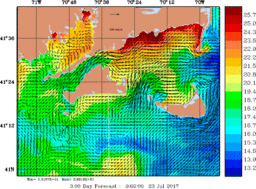
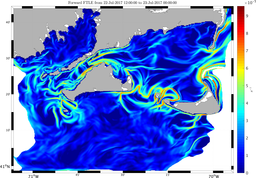
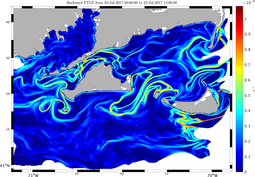
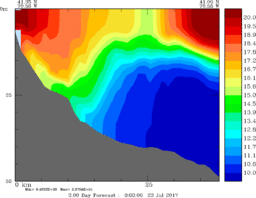
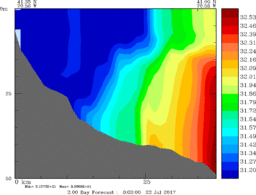
Nowcast and Forecast Products
with dynamics descriptionsAnalyses and Forecasts Issued On June 2017 July 2017 13 14 15 16 18 19 20 21 (8am) 21 (noon) Ocean Physics Horizontal Maps Central Forecast X X X X X X X X X Operational Vertical Section Central Forecast X X X X X X X X X PE files Full Fields X X X Surface Fields X X X X X X X X Lagrangian Coherent Structures LCS Maps Central Forecast X X X X X X X X X Mean and Uncertainty X X
- Ocean Forecast Skill Evaluation (June and July 2017)
- MSEAS-processed atmospheric forcing flux forecasts:
NCEP NAM 3km July 2017 Forecast snapshot plots 12 13 14 15 16 17 18 19 20 21 Forecast data files (all fields) 00Z 00Z 00Z 00Z 00Z 00Z 00Z 00Z 00Z 00Z 06Z 06Z 06Z 06Z 06Z 06Z 06Z 06Z 06Z 06Z 12Z 12Z 12Z 12Z 12Z 12Z 12Z 12Z 12Z 12Z 18Z 18Z 18Z 18Z 18Z 18Z 18Z 18Z 18Z 18Z Daily average wind stress, E-P, heat flux, and SW Radiation
- Comparison of wind, temperature, and pressure data with buoy data [July 2017]
- Comparison of wind, temperature, and pressure data with MVCO data [July 2017]
NCEP HIRESW 5km June 2017 July 2017 Forecast snapshot plots 9 10 11 12 13 14 15 16 12 13 14 15 16 17 18 19 20 21 Forecast data files (all fields) 00Z 00Z 00Z 00Z 00Z 00Z 00Z 00Z 00Z 00Z 00Z 00Z 00Z 00Z 00Z 00Z 00Z 00Z 12Z 12Z 12Z 12Z 12Z 12Z 12Z 12Z 12Z 12Z 12Z 12Z 12Z 12Z 12Z 12Z 12Z 12Z Daily average wind stress, E-P, heat flux, and SW Radiation
- Comparison of MVCO and NCEP HIRESW wind data [June 2017]
- SST Images
- Additional Information
- Acknowledgements: We wish to thank Matthew Pyle, Eric Rogers, Geoff DiMego, and Arun Chawla of NCEP for help and support for atmospheric forcing data, NOAA for supplying buoy data, MVCO for providing both ocean and atmospheric data, the JHU APL for providing processed SST images, and Tamara Holzwarth-Davis and Paula Fratantoni of NOAA for support for ocean historical/climatological data from NMFS.
| Top of page |
Data sources
- Ocean synoptic
- WHOI Martha's Vineyard Coastal Observatory (MVCO)
- The Global Temperature and Salinity Profile Programme (GTSPP)
- National Data Buoy Center Real-Time & historical data from moored buoy & C-MAN stations
- SST Images
- Ocean historical/climatological
- NOAA/NOS tidal elevation stations
- CO-OPS current station data (historical)
- The Global Temperature and Salinity Profile Programme (GTSPP)
- Data sets & products NOAA National Centers for Environmental Information
- World Ocean Database (WOD)
-
Northeast Fisheries Science Center Ecosystem Processes Division Oceanography Branch
NMFS. Includes data from CTDs, fish hauls, hull-mounted sensors, eMOLT
moorings, drifters, etc.
- Hydrographic Conditions of the Northeast Continental Shelf Northeast Fisheries Science Center Oceanography Branch
- Data/Mapping Interface Northeast Fisheries Science Center, Oceanography Branch
- Atmospheric forcing
- Weather Research and Forecasting (WRF) Model Real-Time Forecasts
- National Centers for Environmental Prediction (NCEP) products:
- High-Resolution Window (HIRESW) (5 km resolution):
- Global Forecast System Model: version 4 (GFS), at 0.5 degree resolution (GFSp5) and also at 0.25 degree resolution (GFSp25)
- The European Centre for Medium-Range Weather Forecasts (ECMWF) ERA Intrim (global Re-Analysis)
- Coupled Ocean / Atmosphere Mesoscale Prediction System (COAMPS)
- Navy Global Environmental Model (NAVGEM) products:
| Top of page |


