
These are data collected by the MIT Laboratory for Autonomous Marine Sensing Systems (LAMSS) in collaboration with the Multidiscplinary Simulation, Estimation, and Assimilation Systems (MSEAS) group.
The LAMSS group (Henrik, Arjuna and Stephanie) utilized their AUVs with vehicule control using MOOSDB and MOOS-IvP software including specific observing behaviors. The LAMSS test plan is given here: LAMSS Test Plan.
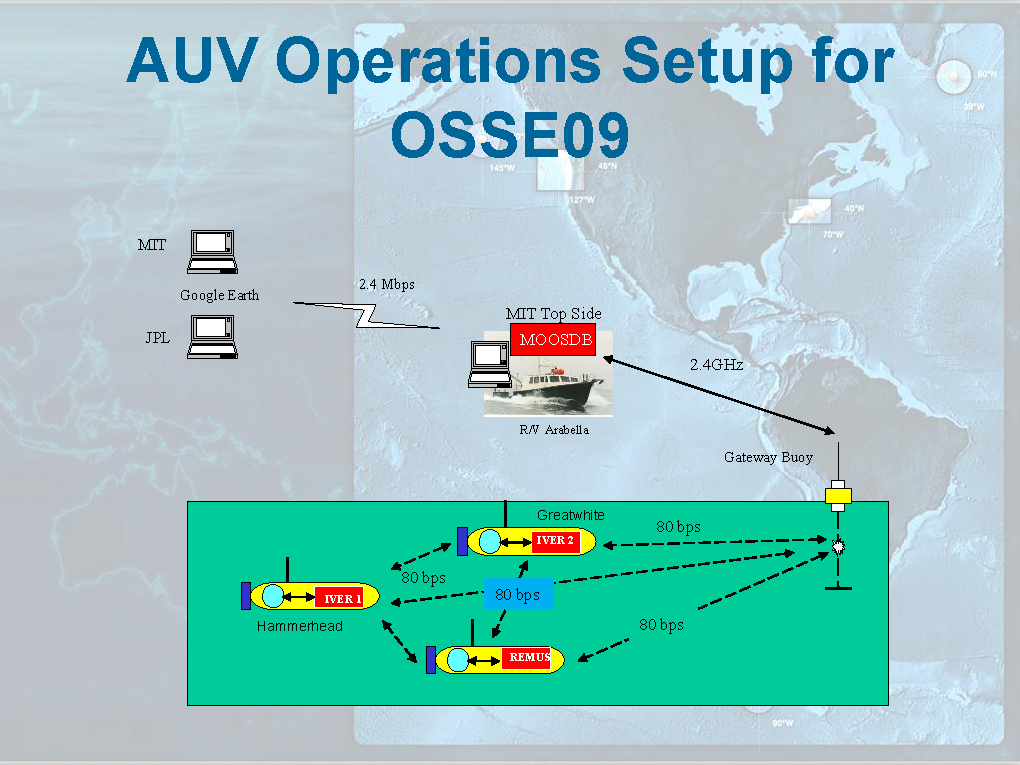
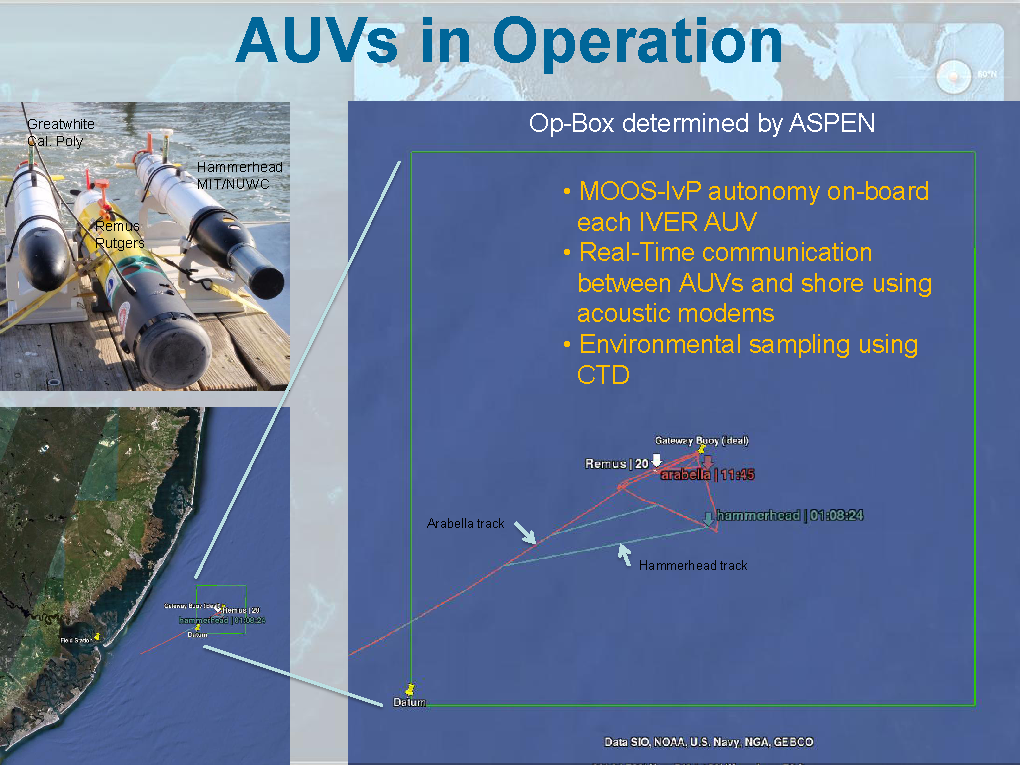
The path of the LAMMS AUVs were first fully-simulated in the MSEAS real-time ocean forecast. This "shore-side planning" was guided by the MSEAS group (Pierre, Pat and Wayne) who recommended focusing on: (i) Tidal effects (which were forecast to dominate at least for the first half of Nov 5 due to weak wind forecasts), see, for example, our: MSEAS Barotropic Tide Forecast and the full MSEAS Nov. 4 Ocean Forecast; (ii) The along-shore and cross-shore gradients (more interesting than a thermocline yoyo) since the water column was forecast to be relatively well-mixed in the AUV ops area, excepted mid-afternoon due very shallow surface warming (afternoon effect for the acousticians). The along-shore AUV-path to the north was forecast to show a bit colder waters slowly advected from the NY Bay. The cross-shore AUV path was forecast to show a small temperature gradient in the area (see MSEAS Nov. 4 Ocean Forecast). Schematics of the AUV operations are shown below.
 |
 |
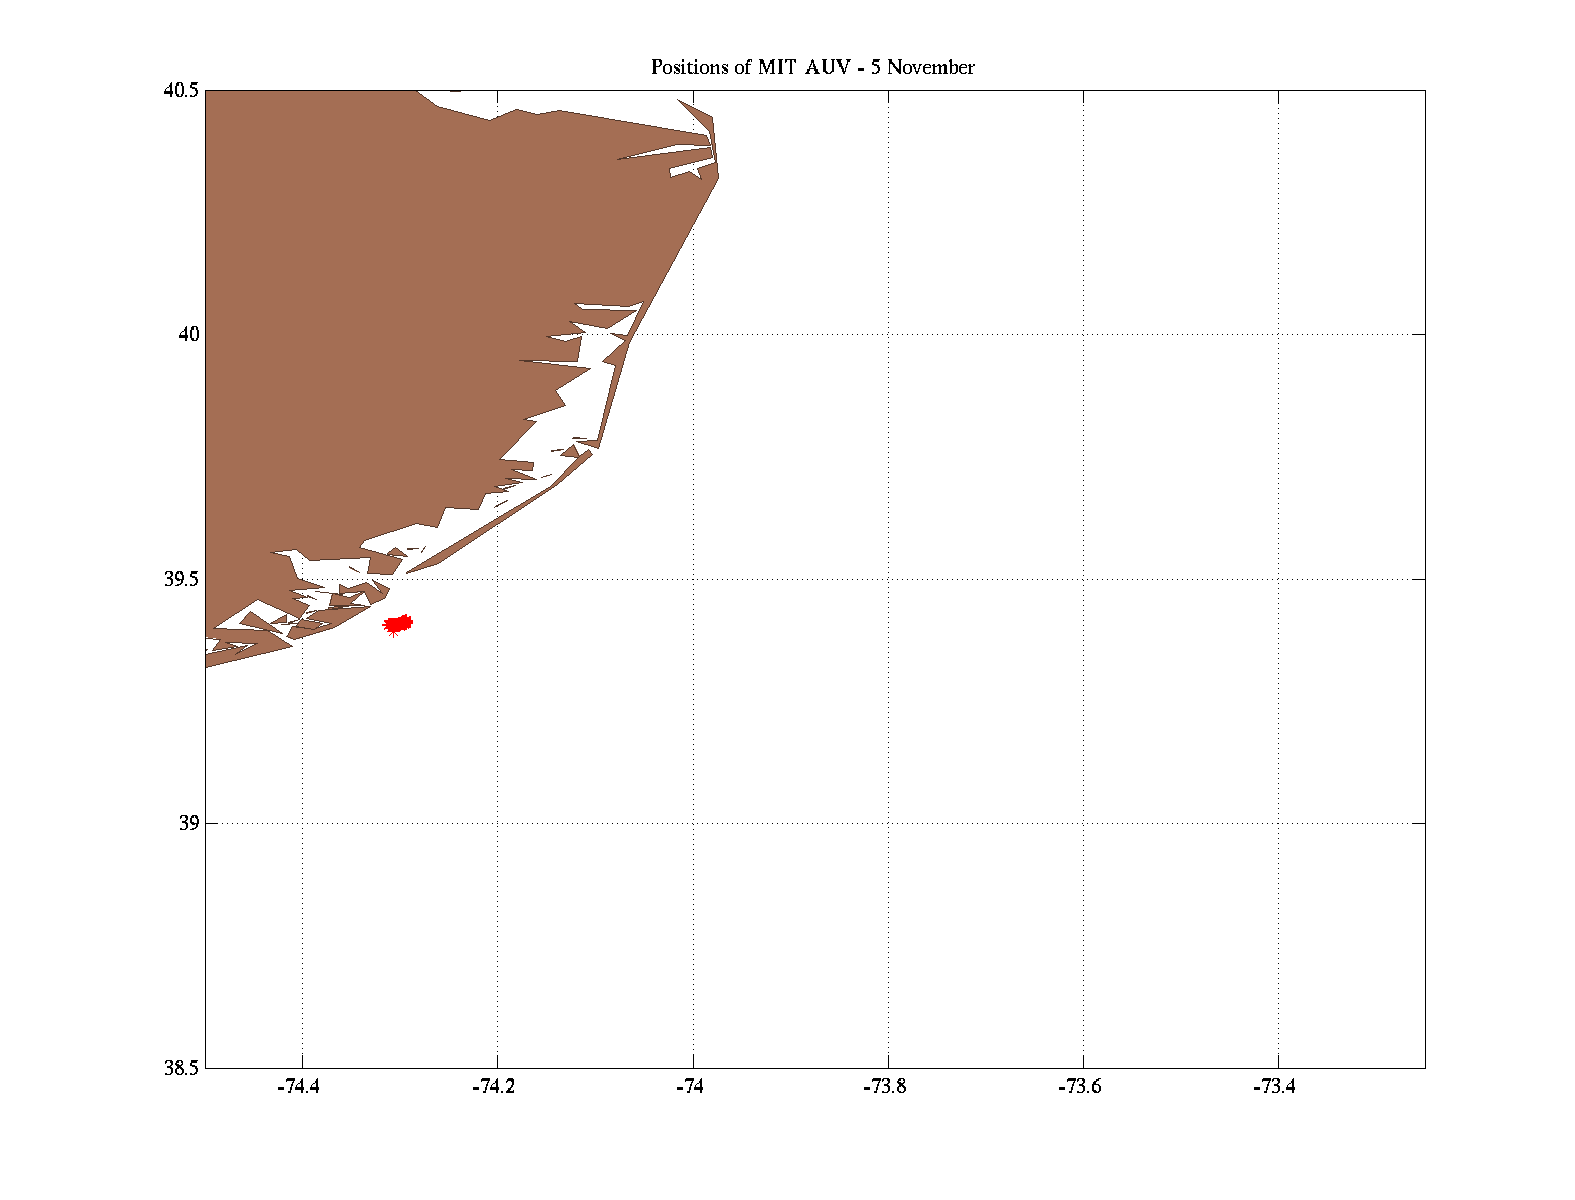
The AUV data is represented below, organized by missions (see, for example, the circle behavior focusing on tidal effects). The plots are of temperature along the AUV track. The 2D view is looking down from the surface, the 3D view is looking through the water column so that the vertical excursions of AUV can be seen.
| Data Location |

|