This web page presents the output from a fifty-one day long free surface simulation in our archipelago domain. This is the latest re-analysis for the full PHILEX-IOP period (issued on 9 June 2009).
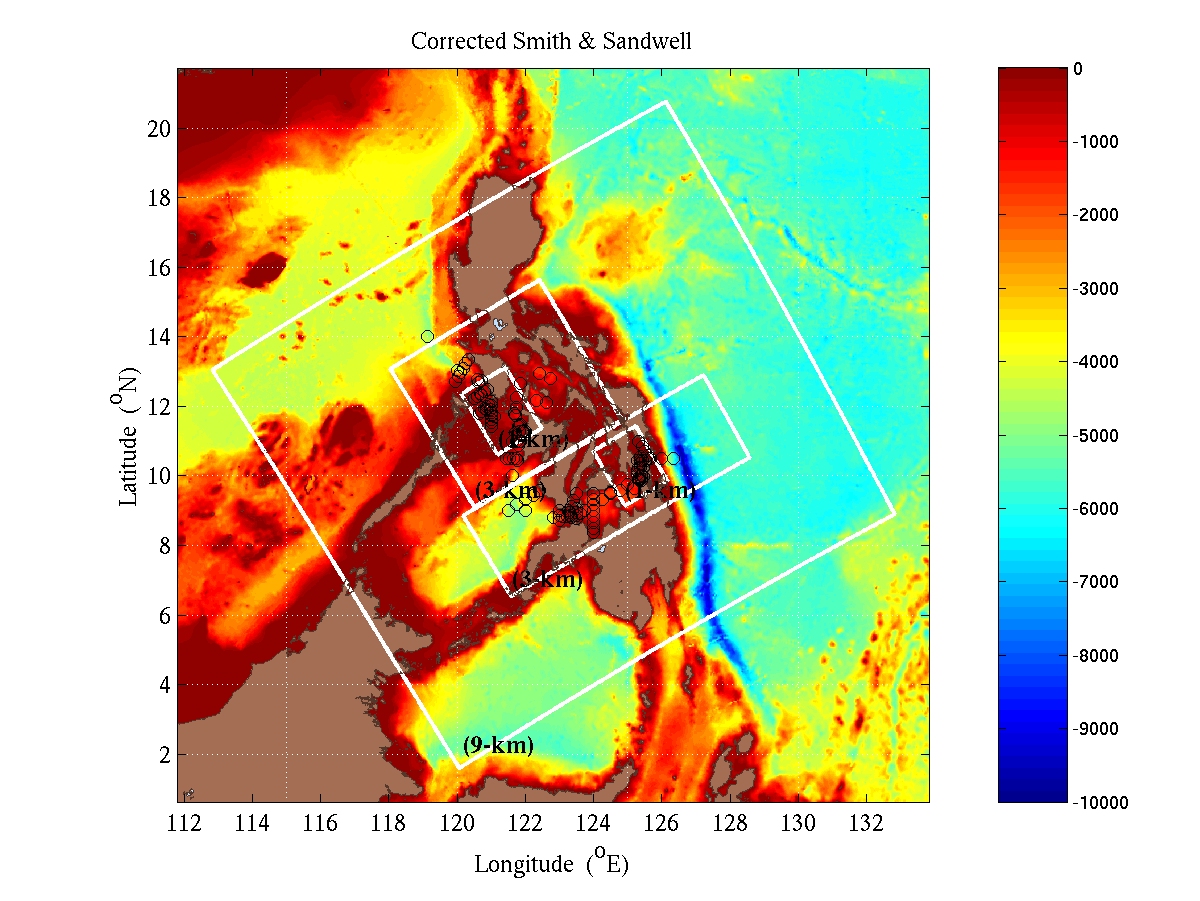
The simulation is forced with a combination of COAMPS (wind stress) and NOGAPS (heat-flux, E-P) atmospheric forcing. It is initialized using a February climatology from the World Ocean Atlas, created using our Fast-Marching-Method Objective Analysis scheme to account for the complex geometries and the disconnected seas at depth. Large-scale open boundary conditions are weakly forced by HYCOM fields, provided by Joseph Metzger, Ole Martin Smedstad and Harley Hurlburt (NRL-SSC). The bathymetry used is that of Smith and Sandwell. All simulations are forced with our Generalized Inverse High-Resolution Barotropic Tides. Plots of the COAMPS winds can be found here.
Remotely-sensed Sea Surface Height anomalies and Sea Surface Temperature are the only synoptic data utilized for initialization and assimilation. No hydrographic data are currently available.
The min/max values under each plot are for the plotted field, while the plot values are indicated by the colorbar. The velocity vectors are scaled by the vector seen on the plot. The colorbars are consistent for each variable and location, but differ from variable to variable.
| February 2 - March 24: Snapshot Time-Series of the Estimated Ocean State (every 6 hours) | |||||||||||||||||||||||||||||||||||||||||||||||
|---|---|---|---|---|---|---|---|---|---|---|---|---|---|---|---|---|---|---|---|---|---|---|---|---|---|---|---|---|---|---|---|---|---|---|---|---|---|---|---|---|---|---|---|---|---|---|---|
|
|
||||||||||||||||||||||||||||||||||||||||||||||
|
|
||||||||||||||||||||||||||||||||||||||||||||||
| Vertical Sections | ||||
|---|---|---|---|---|
| Mindoro Strait 1 | Temperature | Salinity | Velocity - Along | Velocity - Across |
| Mindoro Strait 2 | Temperature | Salinity | Velocity - Along | Velocity - Across |
| Sulu Sea | Temperature | Salinity | Velocity - Along | Velocity - Across |
| Bohol Sea | Temperature | Salinity | Velocity - Along | Velocity - Across |
| San Bernadino Strait | Temperature | Salinity | Velocity - Along | Velocity - Across |
Plots for the biological variables are located here.
| NetCDF files | |
|---|---|
| Along Grid | MIT_phys_reanal_20090609_20090202_20090325_06h.nc.gz |
| Geographic | MIT_phys_reanal_geo_20090609_20090202_20090325_06h.nc.gz |
To help extract data from these files in Matlab, we include the function readhopspe.m. To use this function, you'll also need to download
        /matlab/toolbox/local/mexnc
        /matlab/toolbox/local/netcdf_toolbox/netcdf
        /matlab/toolbox/local/netcdf_toolbox/netcdf/ncutility
        /matlab/toolbox/local/netcdf_toolbox/netcdf/nctype