Real-Time MIT Product and Descriptive Pages for QPE IOP09
Acoustic Forecasts for 900Hz on 2 September 1500Z and 2100Z, Issued 2 September 2009
This modeling is to designed show the acoustic variability computed using predicted oceanography over the QPE Acoustic Area. The purpose of
the work is to provide a better insight into the oceanographic variability for the purpose of sensor placement. In order to do so, a 56km by 33 km
rectangle area is chosen for such acoustic modeling, which covers most interesting area for OMAS activities. A 31 by 31 point grid
has been chosen. A source (900 and 600 Hz frequency) is placed at each grid point and sound is propagated to 15 km distance in 8 different
directions (with 45 degree intervals). An N(=8) by 2D transmission loss TL(latitude,longitude,bearing,depth,range) at each grid point is
estimated by using parabolic equation Range-dependent Acoustic Model (RAM). A two-layer depth-dependent geo-acoustic model is applied here:
20 m deep sediment layer on the top of basement with sound sound speed (c) 1,800 m/s, density (ρ) 2.0 g/cm3 and attenuation (α) 0.5 dB/λ.
The sediment type depends on the local water depth (WD) :
WD < 140m: Sand sediment (sound speed ratio: 1.038, ρ: 1.90 g/cm3, α: 0.9 dB/λ)
140m < WD < 210m: Muddy-sand (sound speed ratio: 1.021, ρ: 1.76 g/cm3, α: 1.15 dB/λ)
210m < WD: Mud (sound speed ratio: 0.980 , ρ: 1.42 g/cm3, α: 0.1 dB/λ)
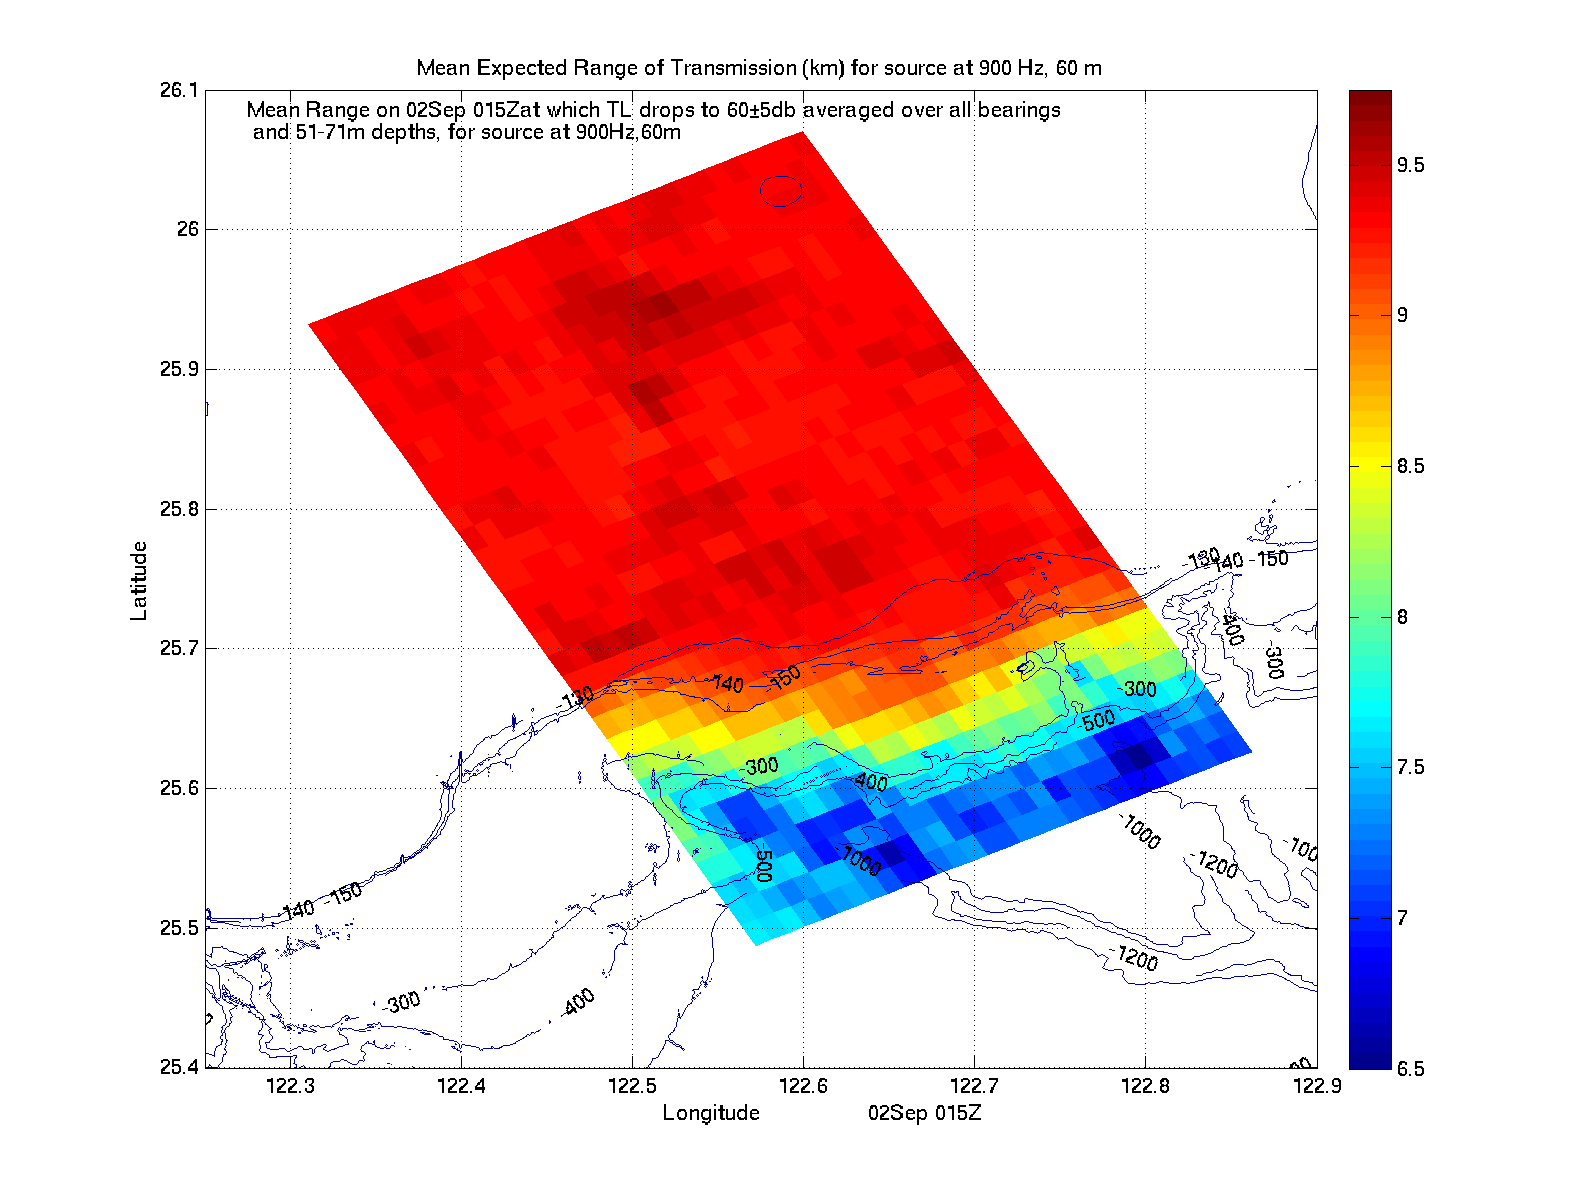
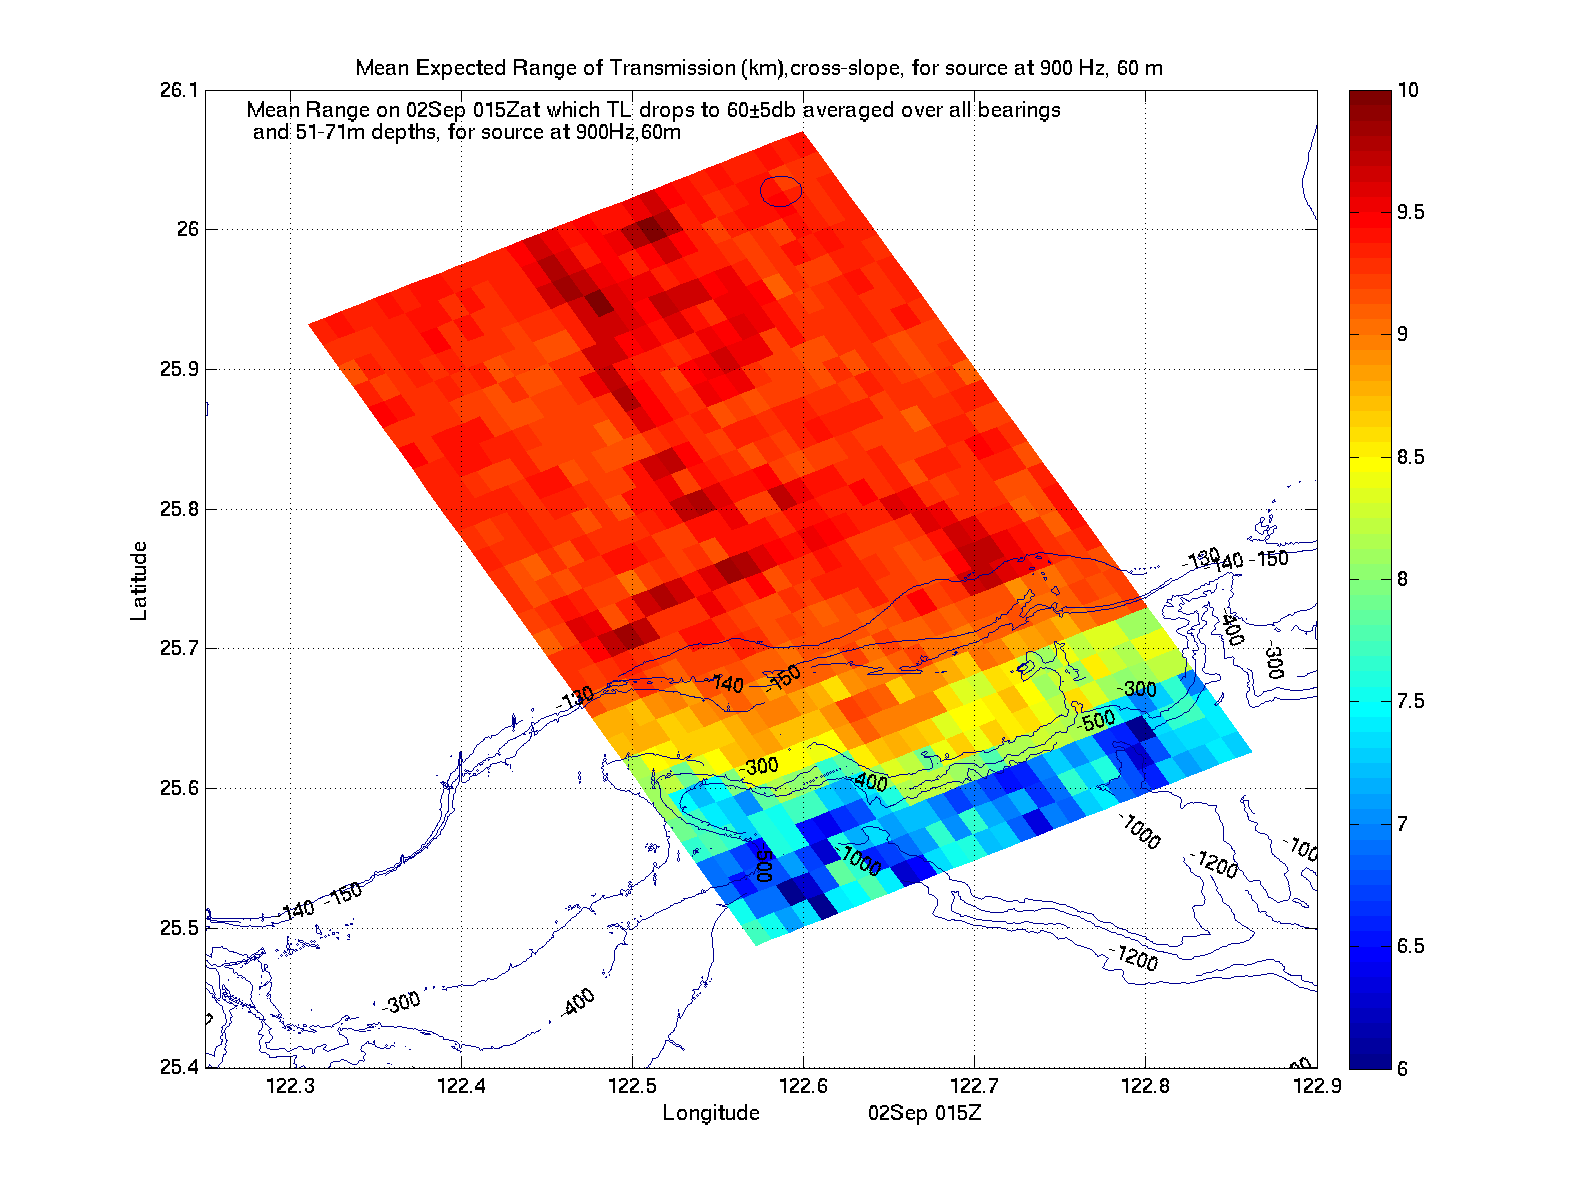
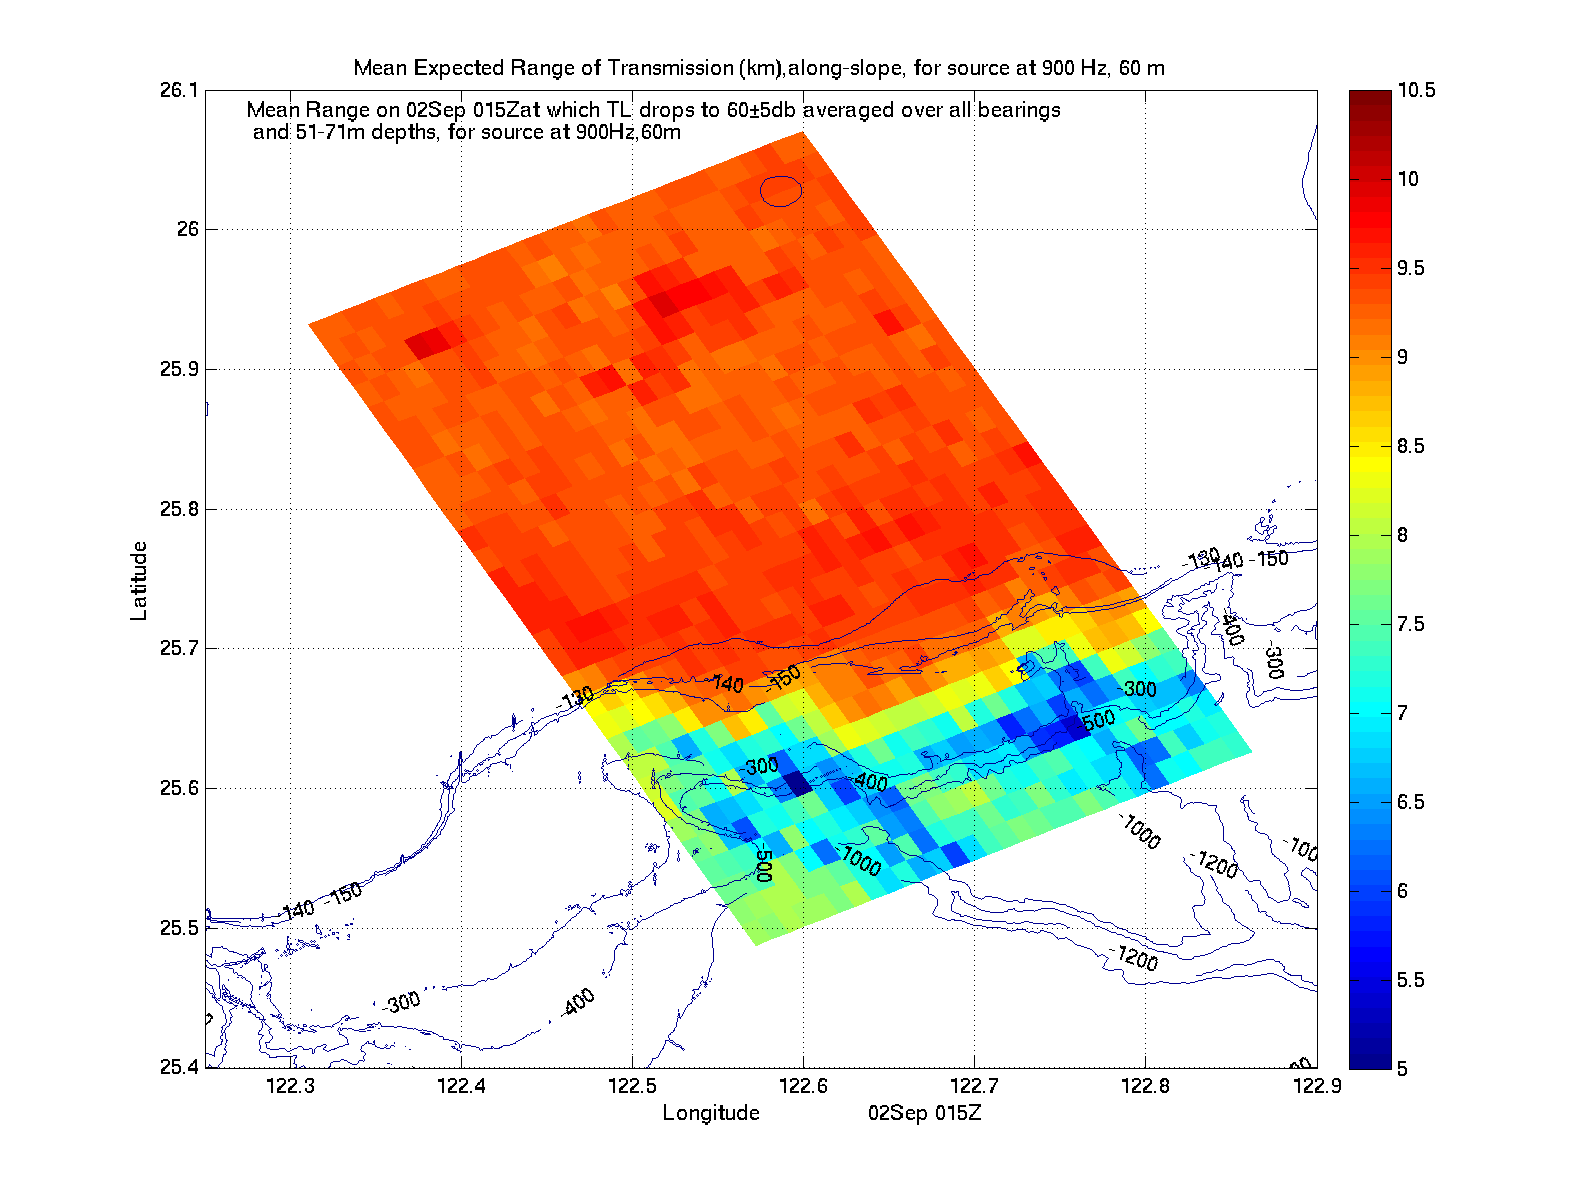
Based on TL (latitude,longitude,bearing,depth,range), expected range (R) of transmission for TL drop to 60 (+/-5)dB level and 80 (+/-5) dB level
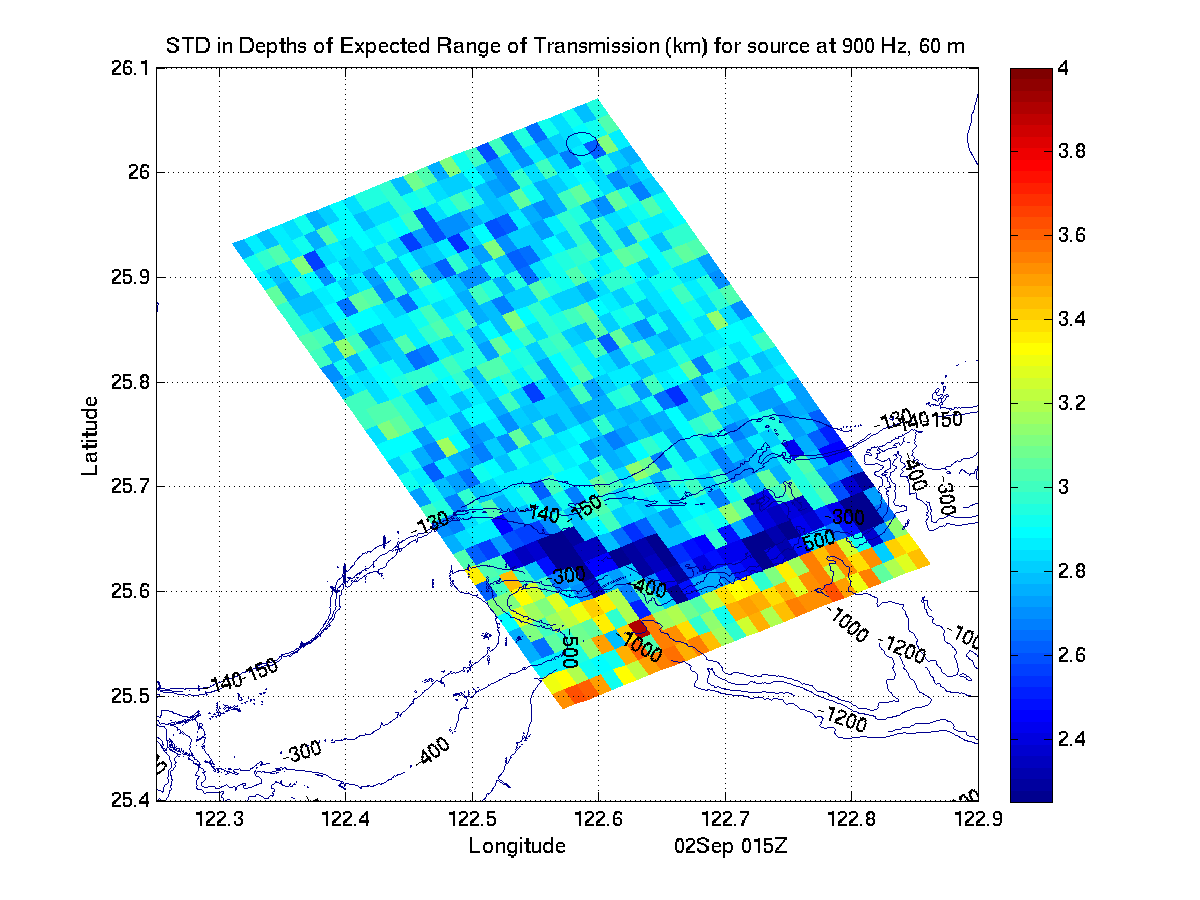
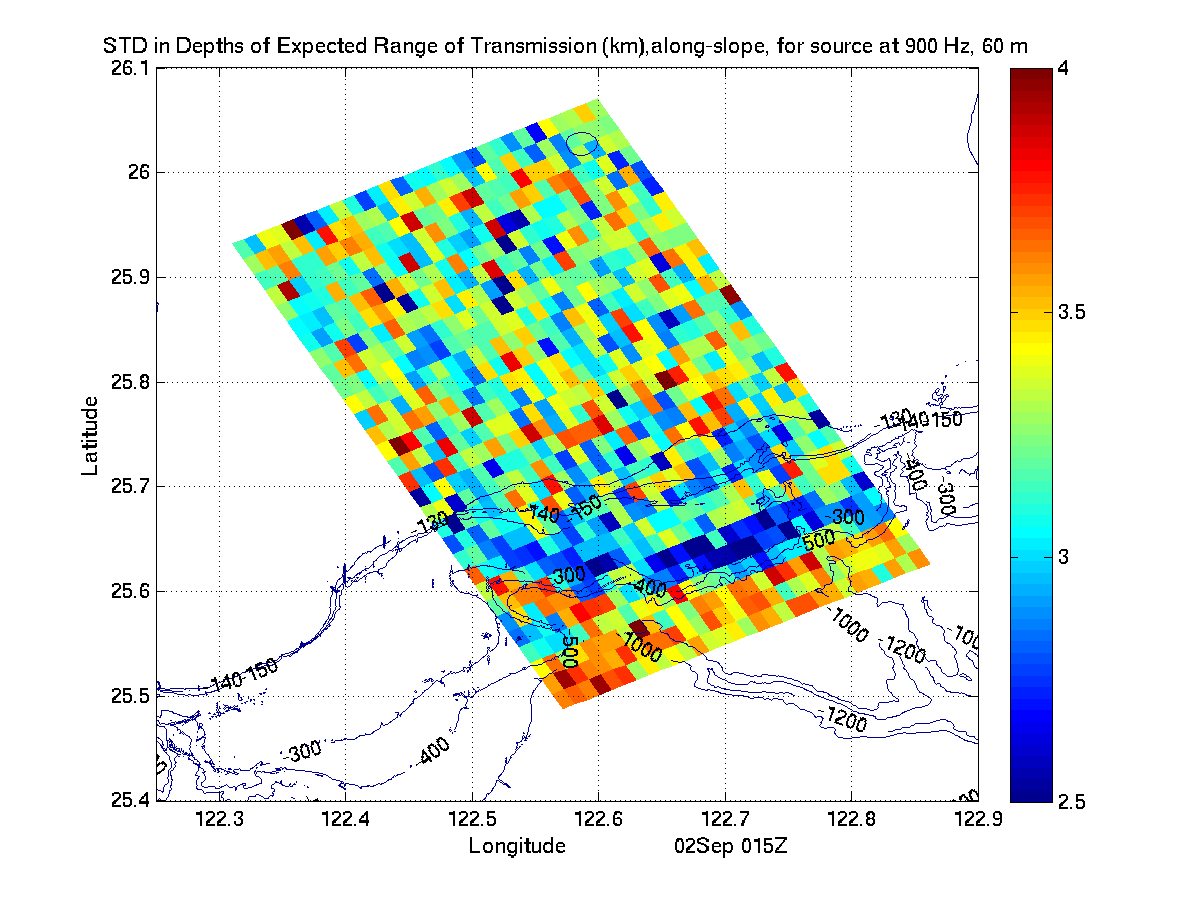
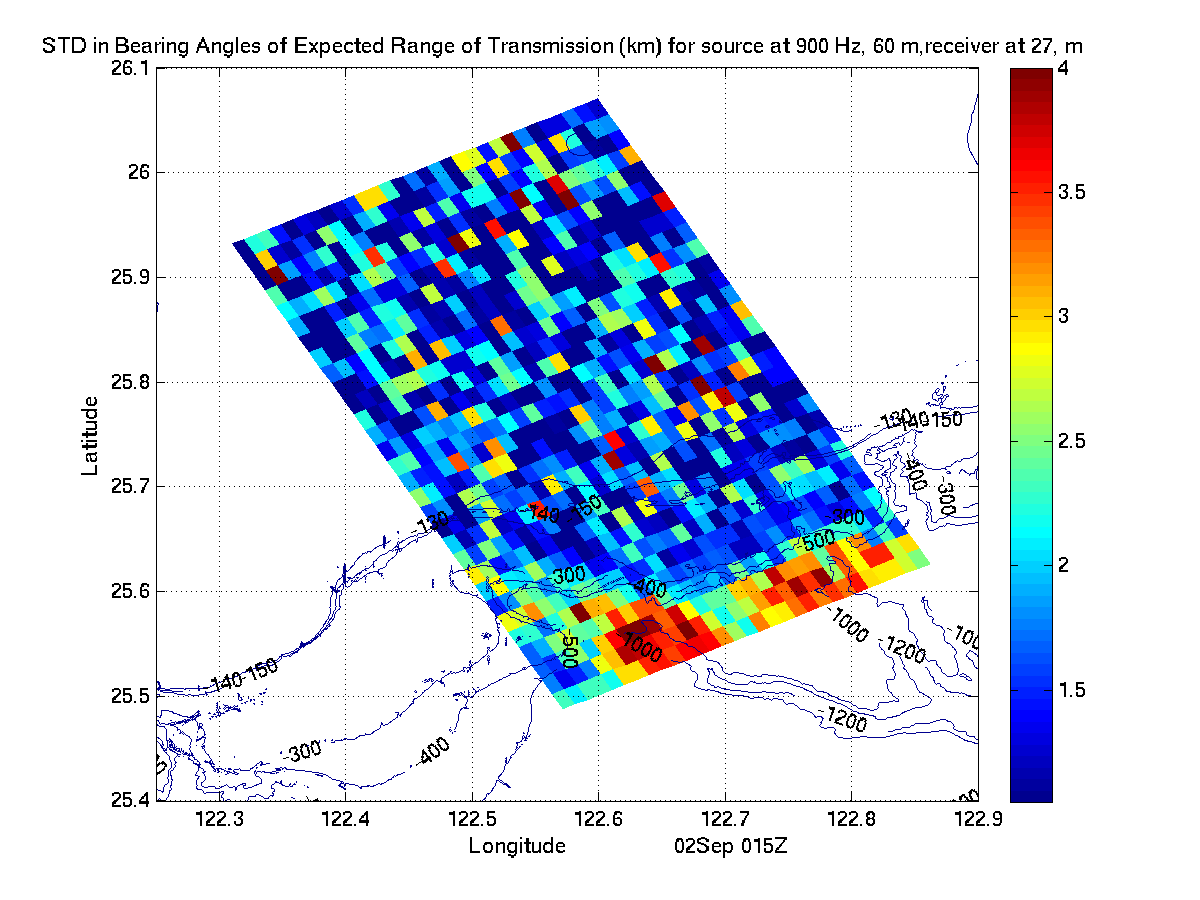
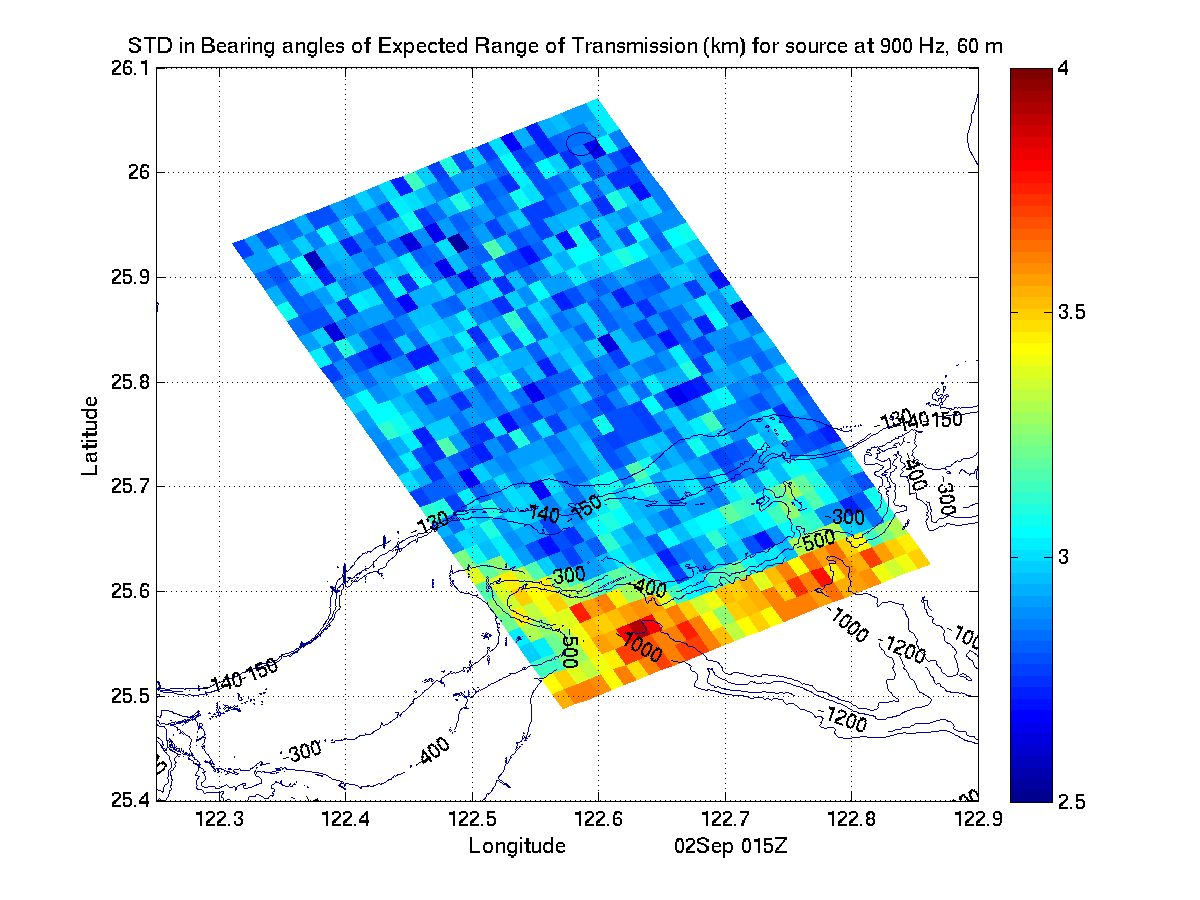
are estimated as R_60 (latitude,longitude,bearing,depth,range) and R_80 (latitude, longitude, bearing, depth,range). The mean and standard
deviation (over depth or bearing angles) of those three variable are shown in the following figures.
| Fcst. for 2 Sep. 15Z |
|---|
| Acoustic Climate Maps for a TL drop to 60±5 db |
|---|
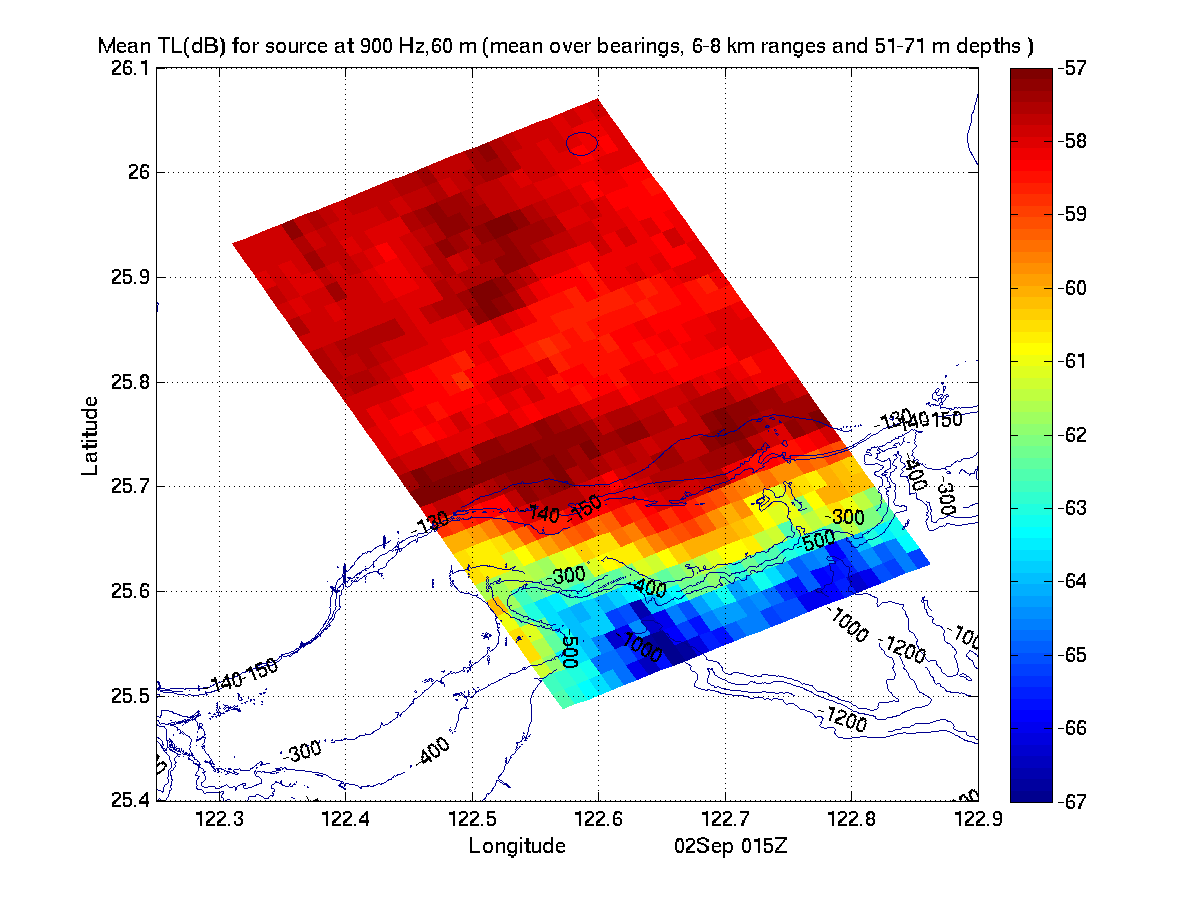
TL(xs,ys,ts)
(TL (db) for source at 900Hz, 60m
averaged over all bearings, 6-8km ranges and 51-71m depths) |
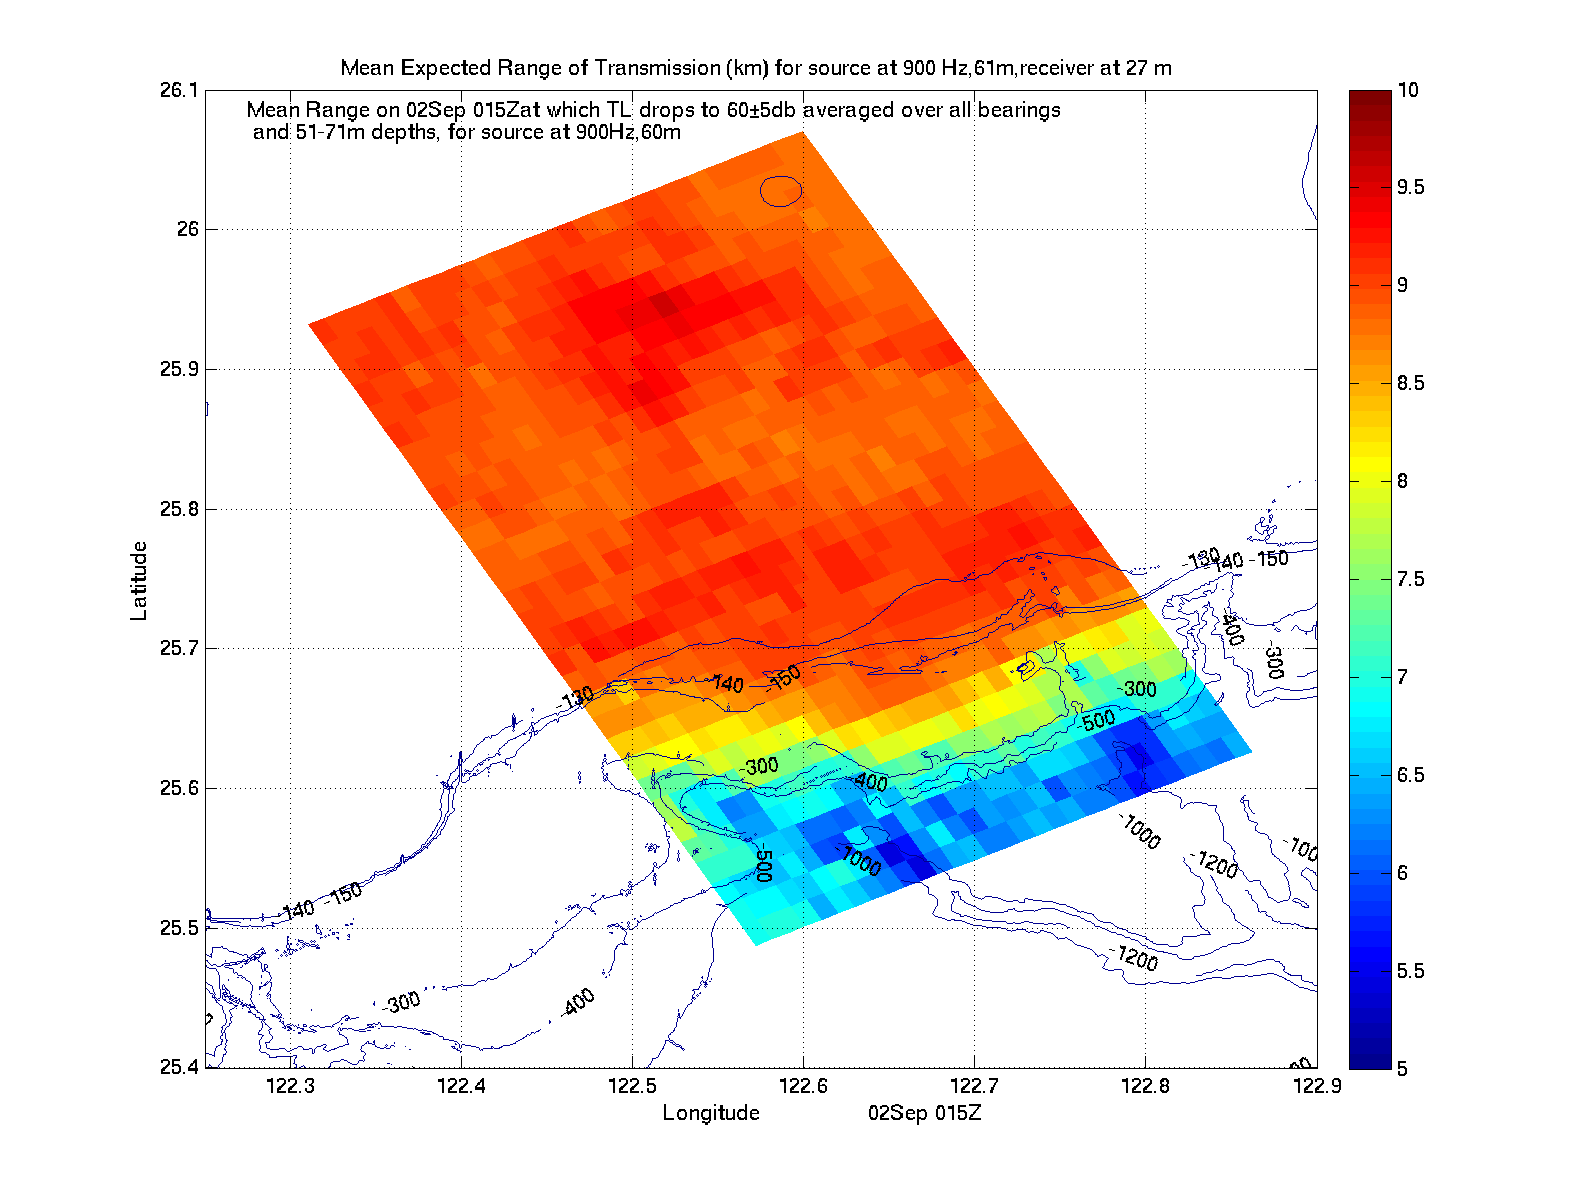
Expected Range (km) at fixed time ts for source at (xs,ys)
(Mean
Range on 02Sep 15Z at which TL drops to 60±5 db averaged over all
bearings and 51-71m depths, for source at 900Hz, 60m) |
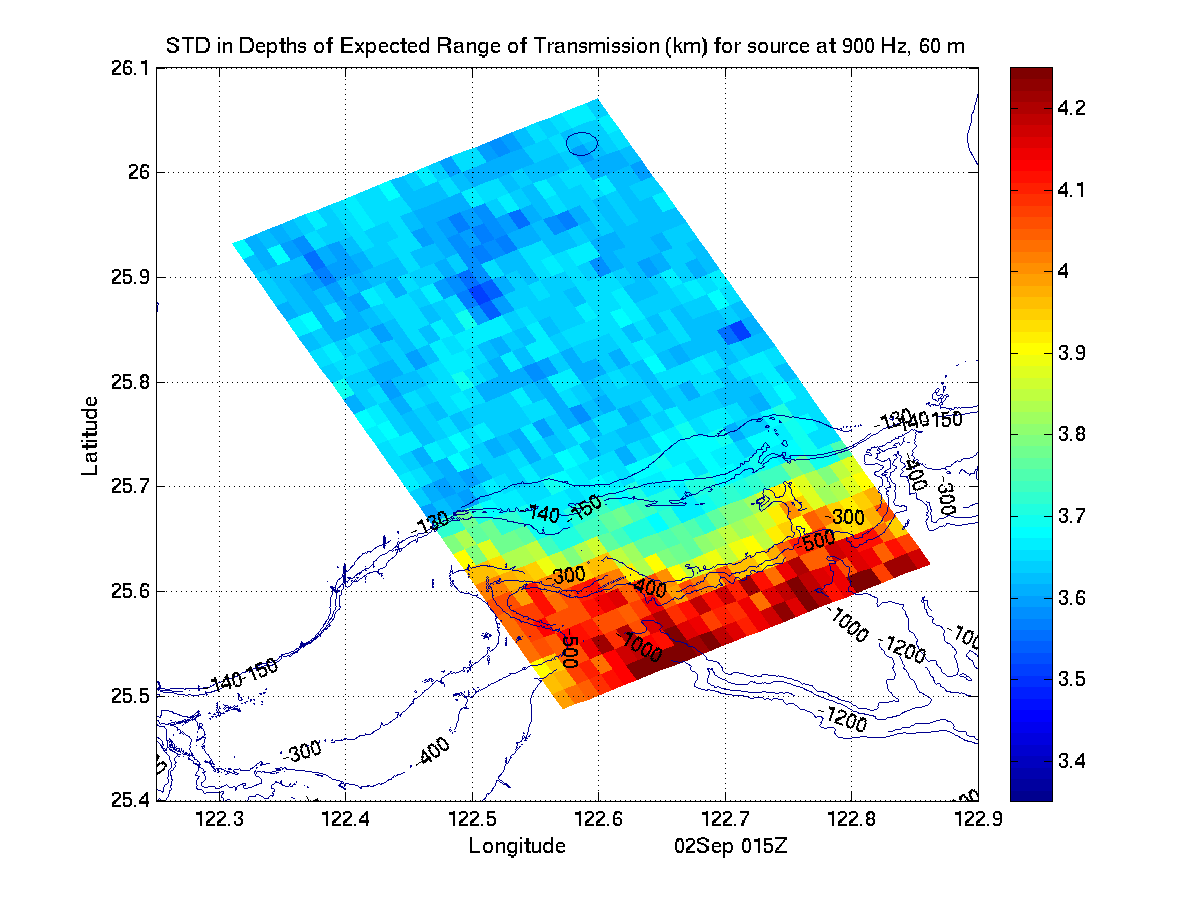
Expected Range (km) in cross-slope direction at fixed time
ts for source at (xs,ys)
(Mean
Range on 02Sep 15Z at which TL in cross-slope direction drops to
60±5 db averaged over 51-71m depths, for source at 900Hz, 60m) |
Expected Range (km) in along-slope direction at fixed time ts
for source at (xs,ys)
(Mean
Range on 02Sep 15Z at which TL in along-slope direction drops to
60±5 db averaged over 51-71m depths, for source at 900Hz, 60m) |
Expected Range (km) at fixed time ts for source at (xs,ys)
and receiver at 27m depth
(Mean
Range on 02Sep 15Z at which TL drops to 60±5 db for receiver at
27m depth, averaged over all bearings, for source at 900Hz, 60m) |
|
|
|
|
|
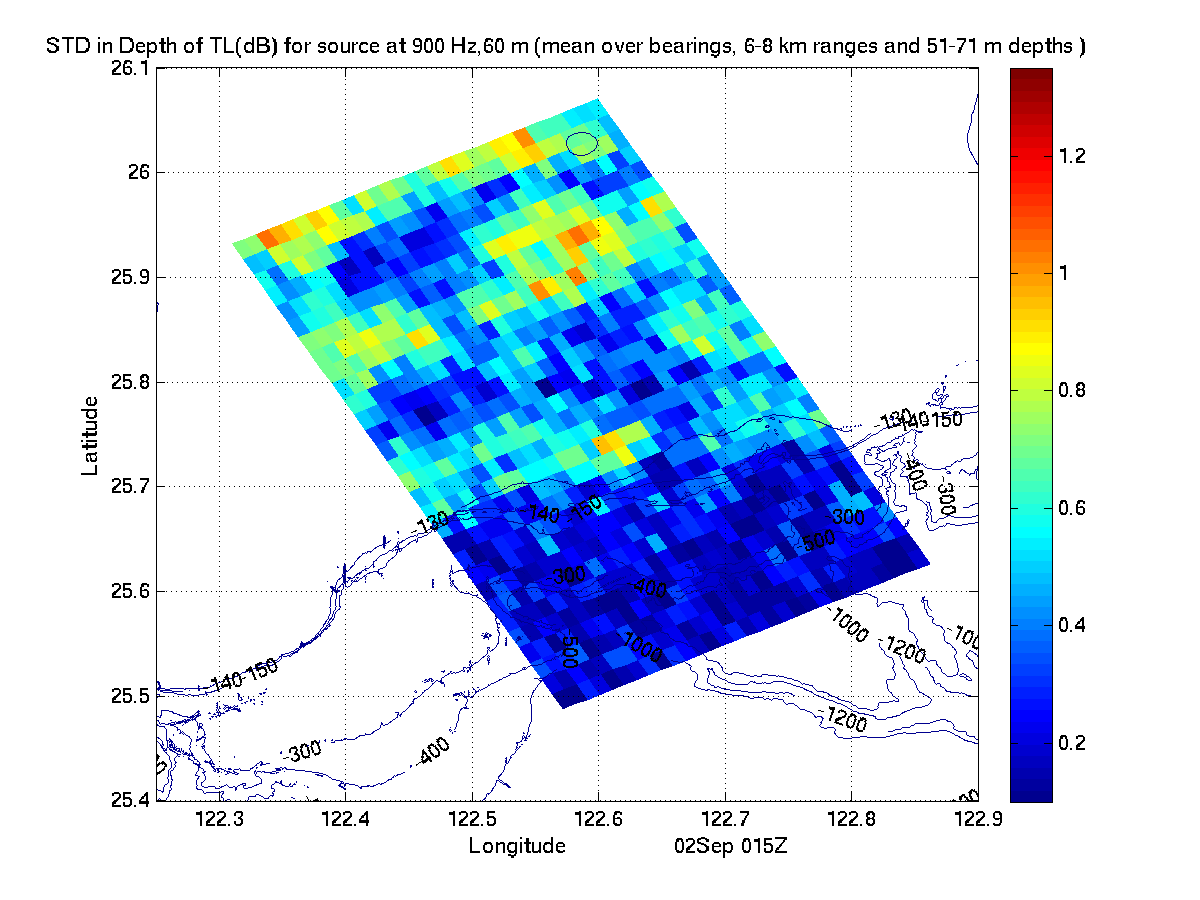
| Std Dev in Depth of TL |
Std Dev in Depth
of Expected Range |
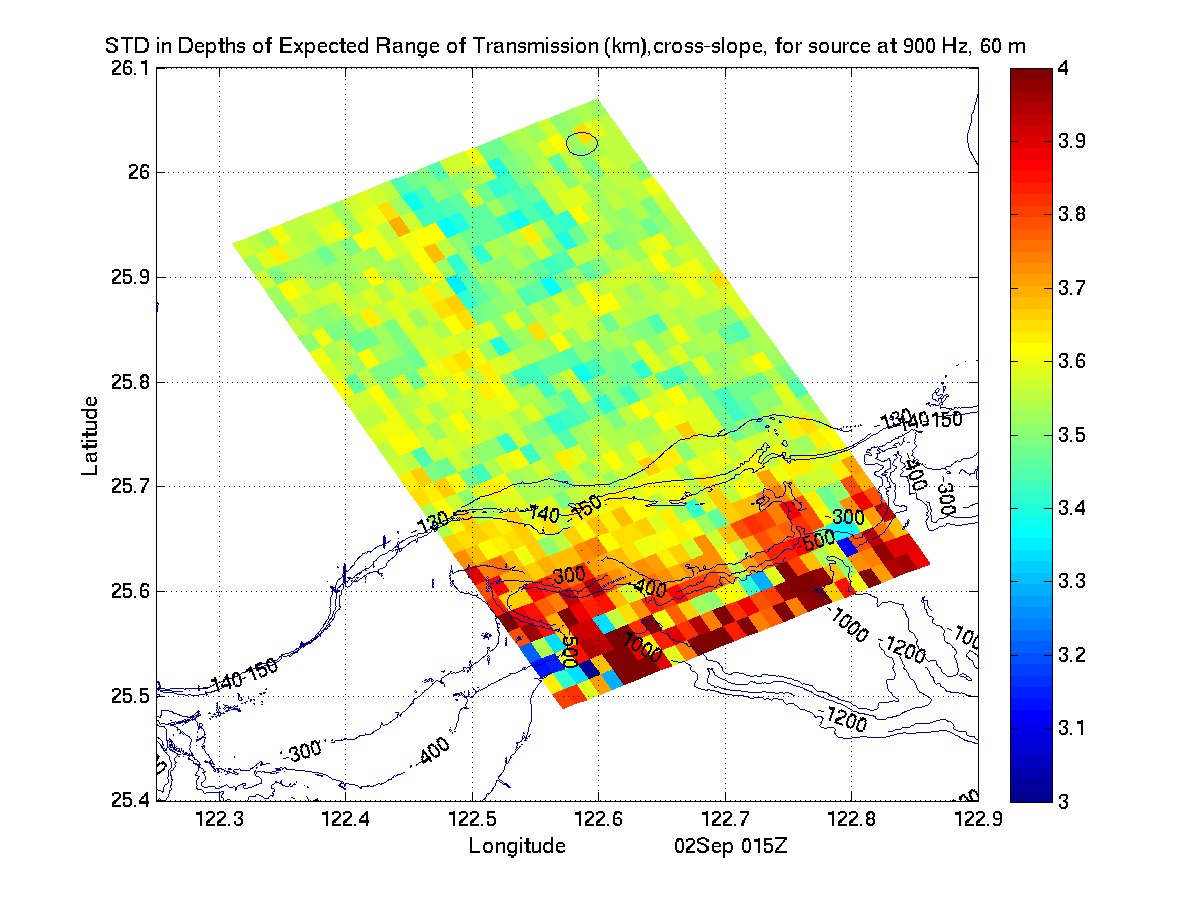
Std Dev in Depth
of Expected X-Slope Range |
Std Dev in Depth
of Expected Along-Slope Range |
Std Dev in Bearing
of Expected Range for 27m Receiver |
|
|
|
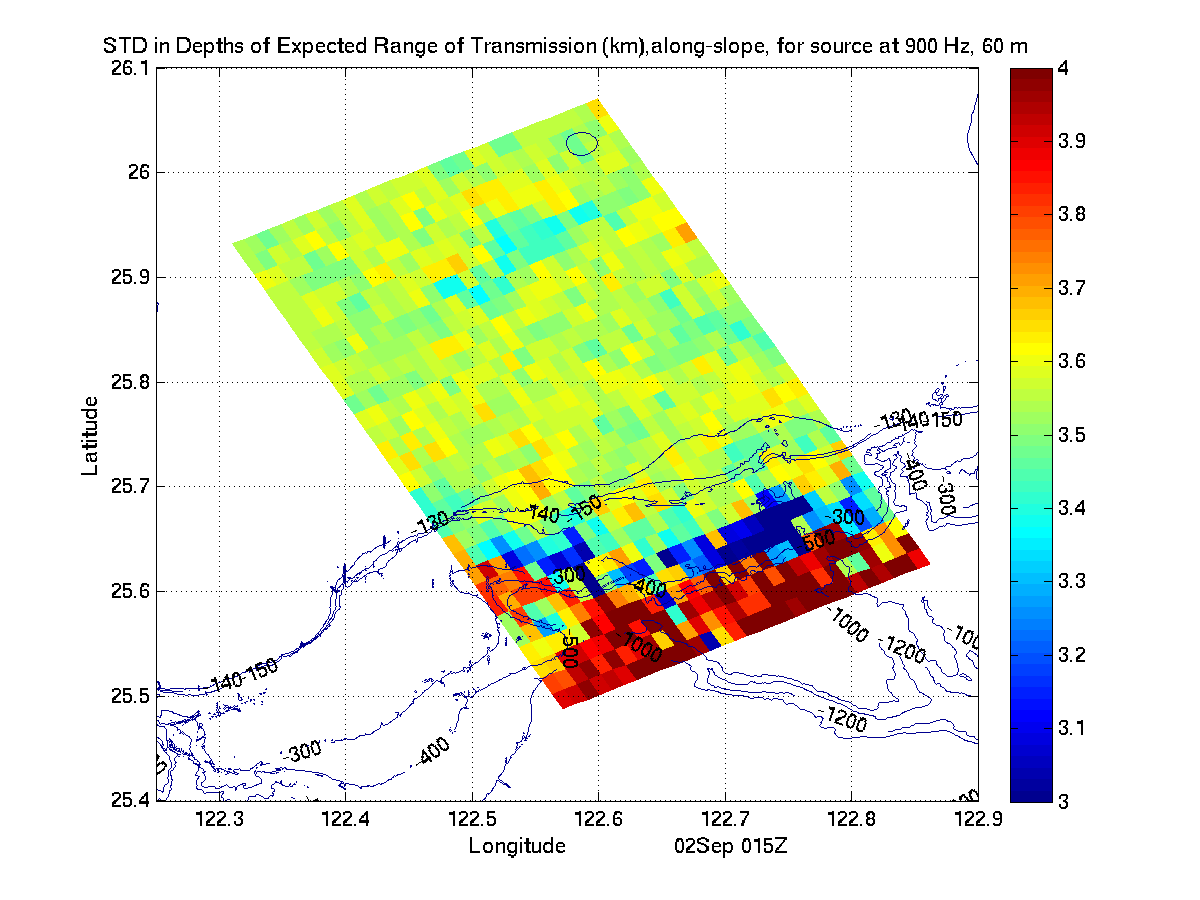
|
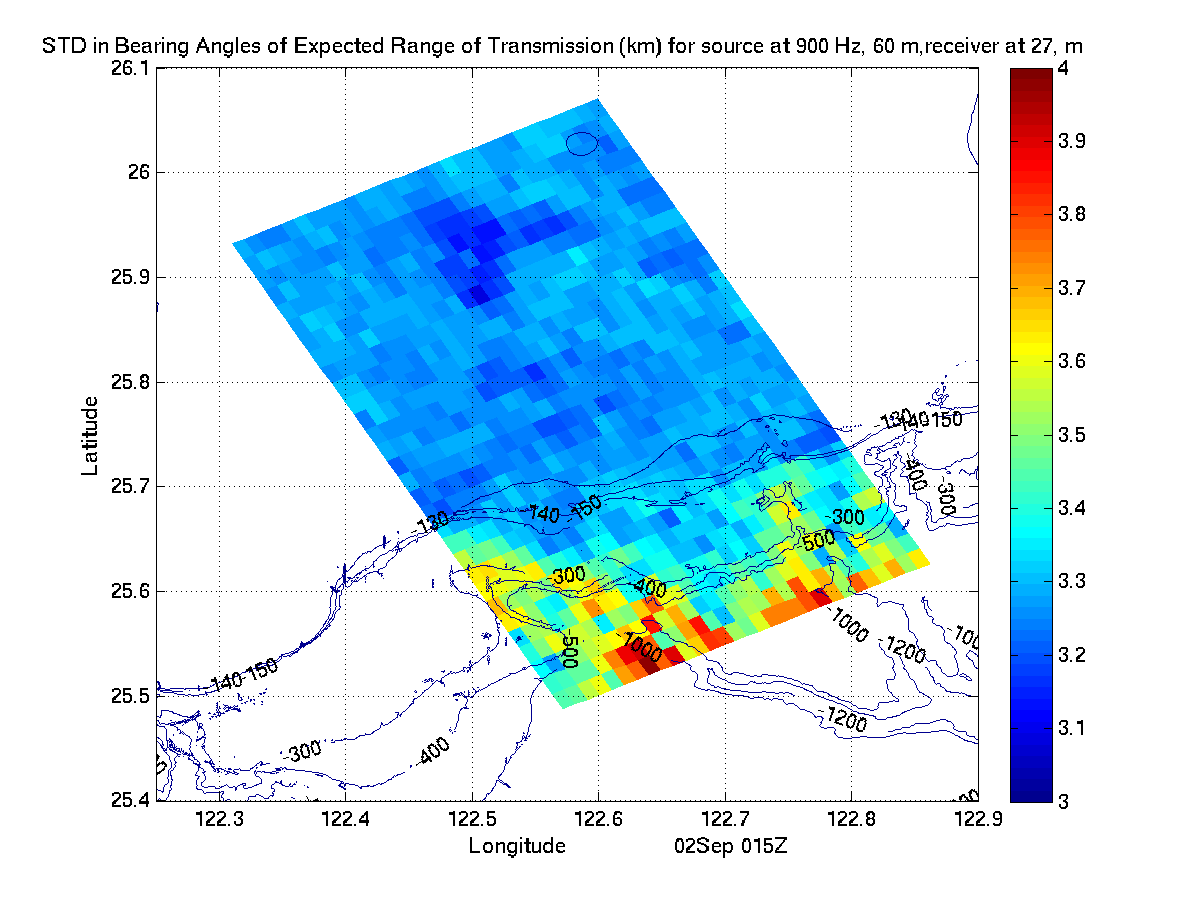
|
| Std Dev in Bearing of TL |
Std Dev in Bearing
of Expected Range |
|
|
|
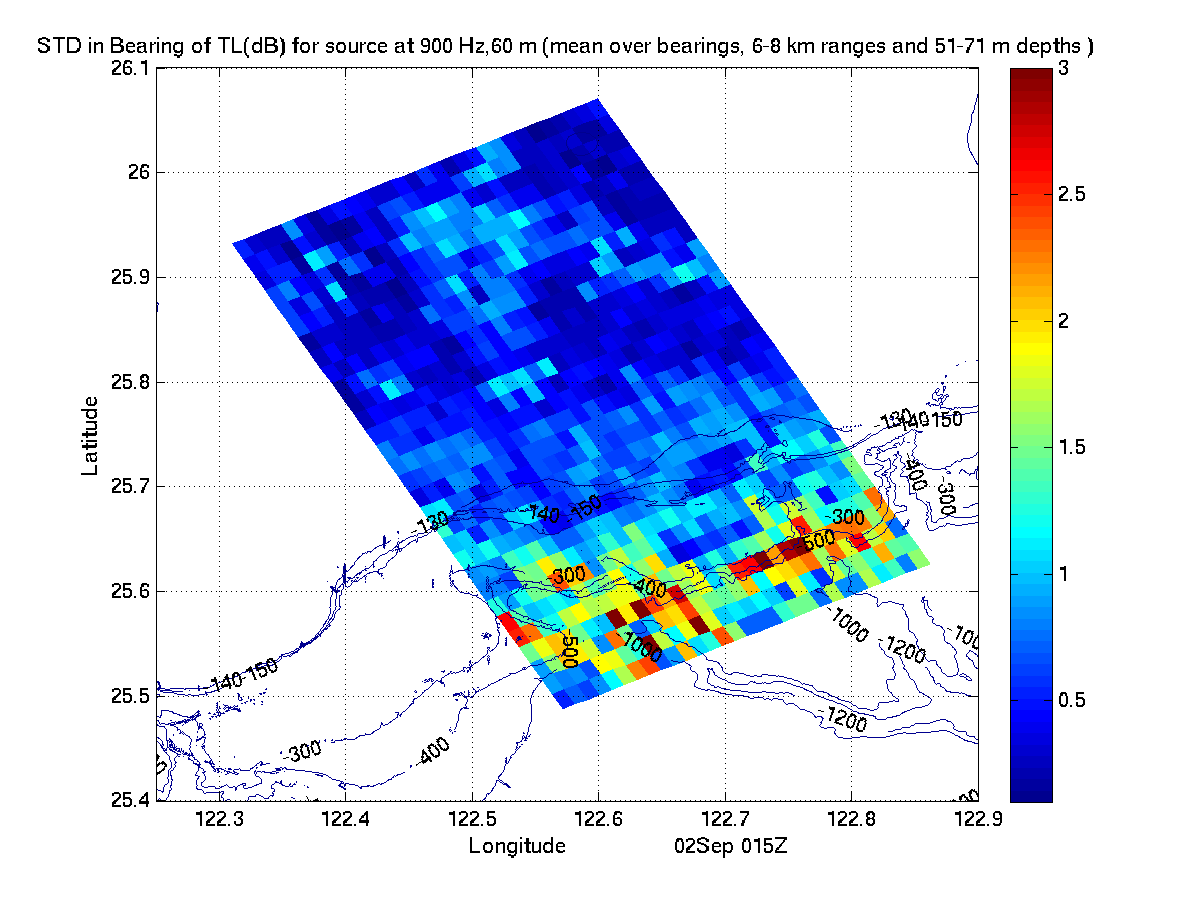
|
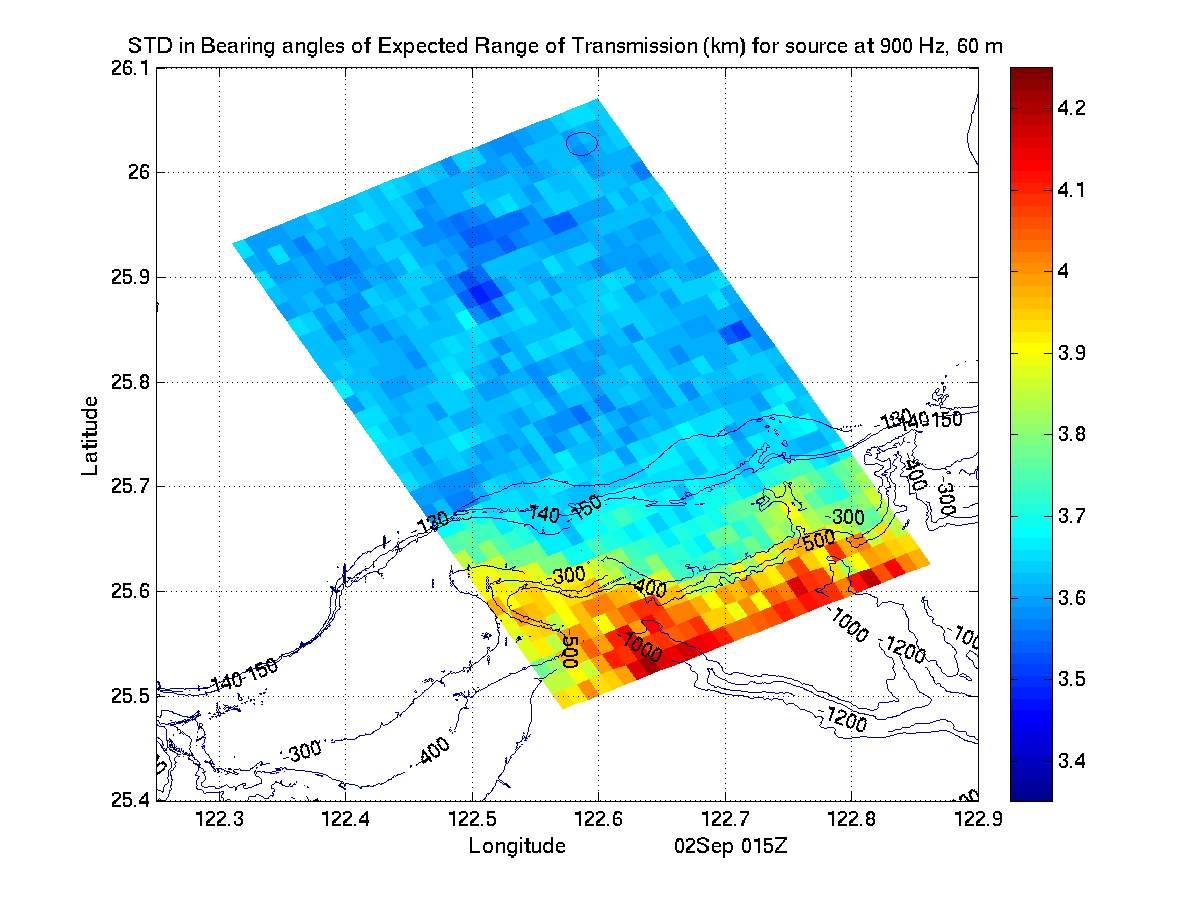
|
|
|
|
| Acoustic Climate Maps for a TL drop to 80±5 db |
|---|
Expected Range (km) at fixed time ts for source at (xs,ys)
(Mean
Range on 02Sep 15Z at which TL drops to 80±5 db averaged over all
bearings and 51-71m depths, for source at 900Hz, 60m) |
Expected Range (km) in cross-slope direction at fixed time
ts for source at (xs,ys)
(Mean
Range on 02Sep 15Z at which TL in cross-slope direction drops to
80±5 db averaged over 51-71m depths, for source at 900Hz, 60m) |
Expected Range (km) in along-slope direction at fixed time ts
for source at (xs,ys)
(Mean
Range on 02Sep 15Z at which TL in along-slope direction drops to
80±5 db averaged over 51-71m depths, for source at 900Hz, 60m) |
Expected Range (km) at fixed time ts for source at (xs,ys)
and receiver at 27m depth
(Mean
Range on 02Sep 15Z at which TL drops to 80±5 db for receiver at
27m depth, averaged over all bearings, for source at 900Hz, 60m) |
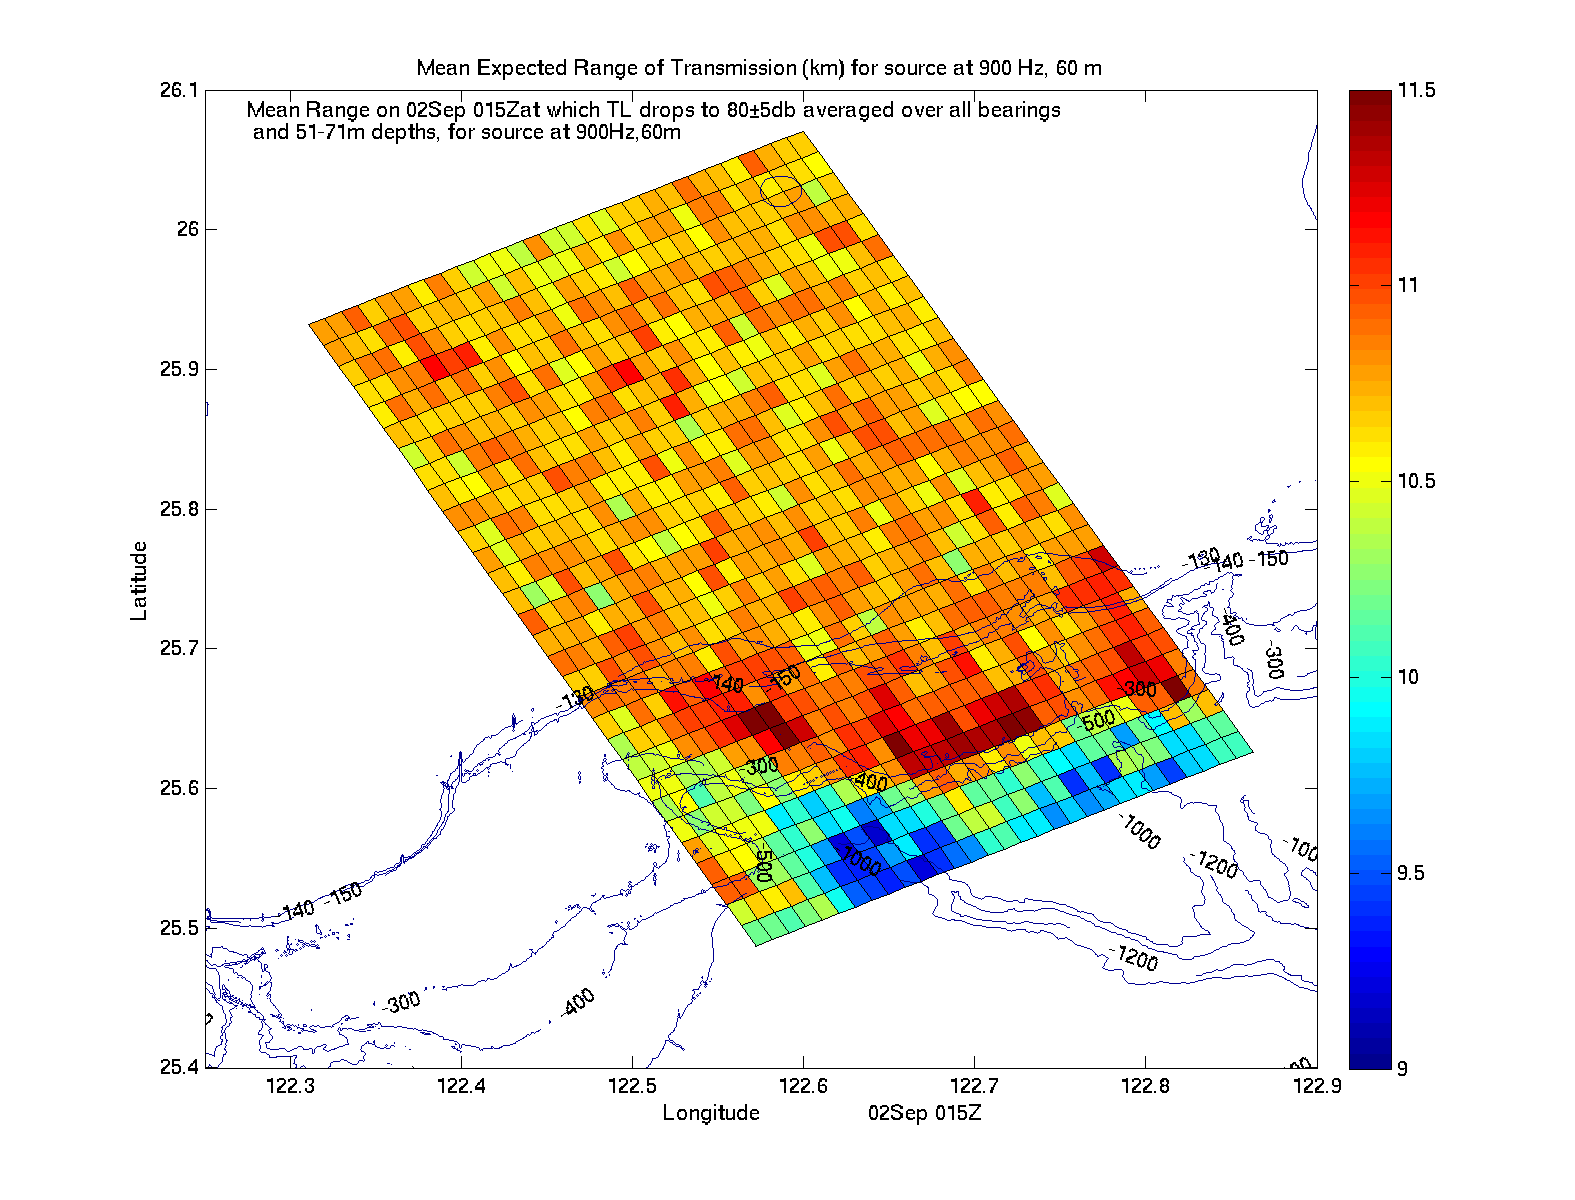
|
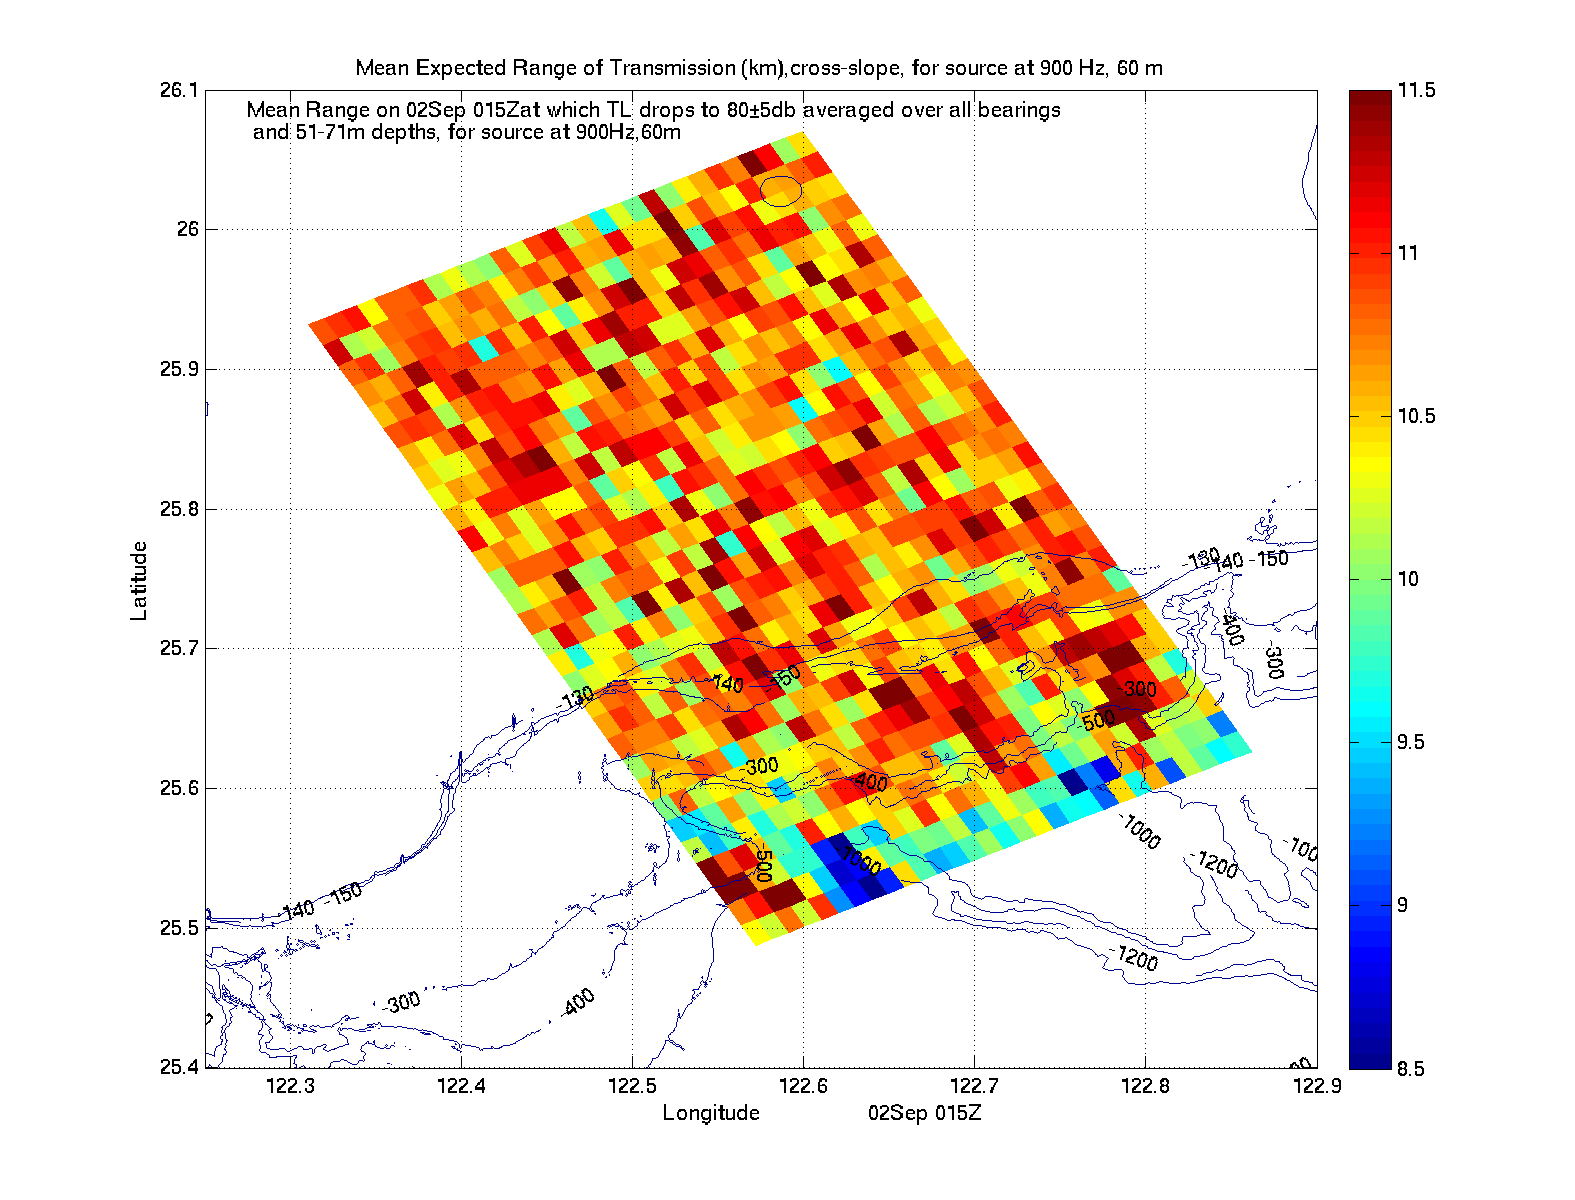
|
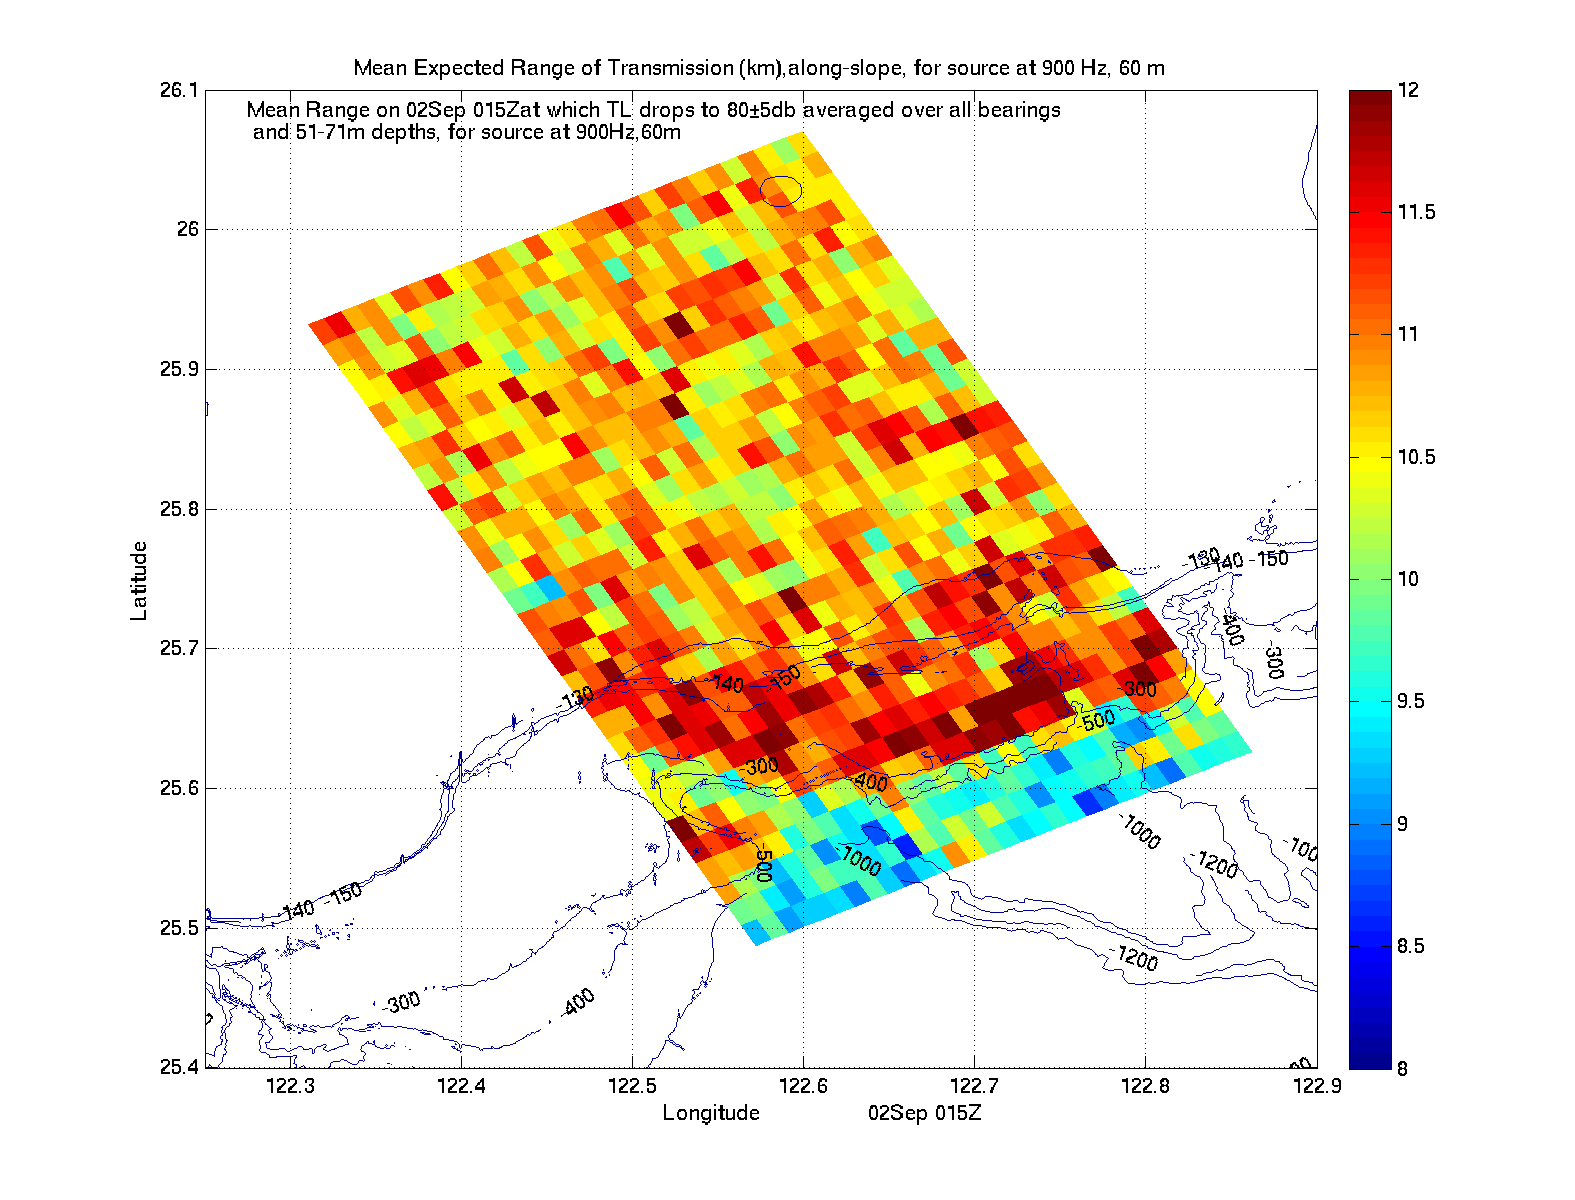
|
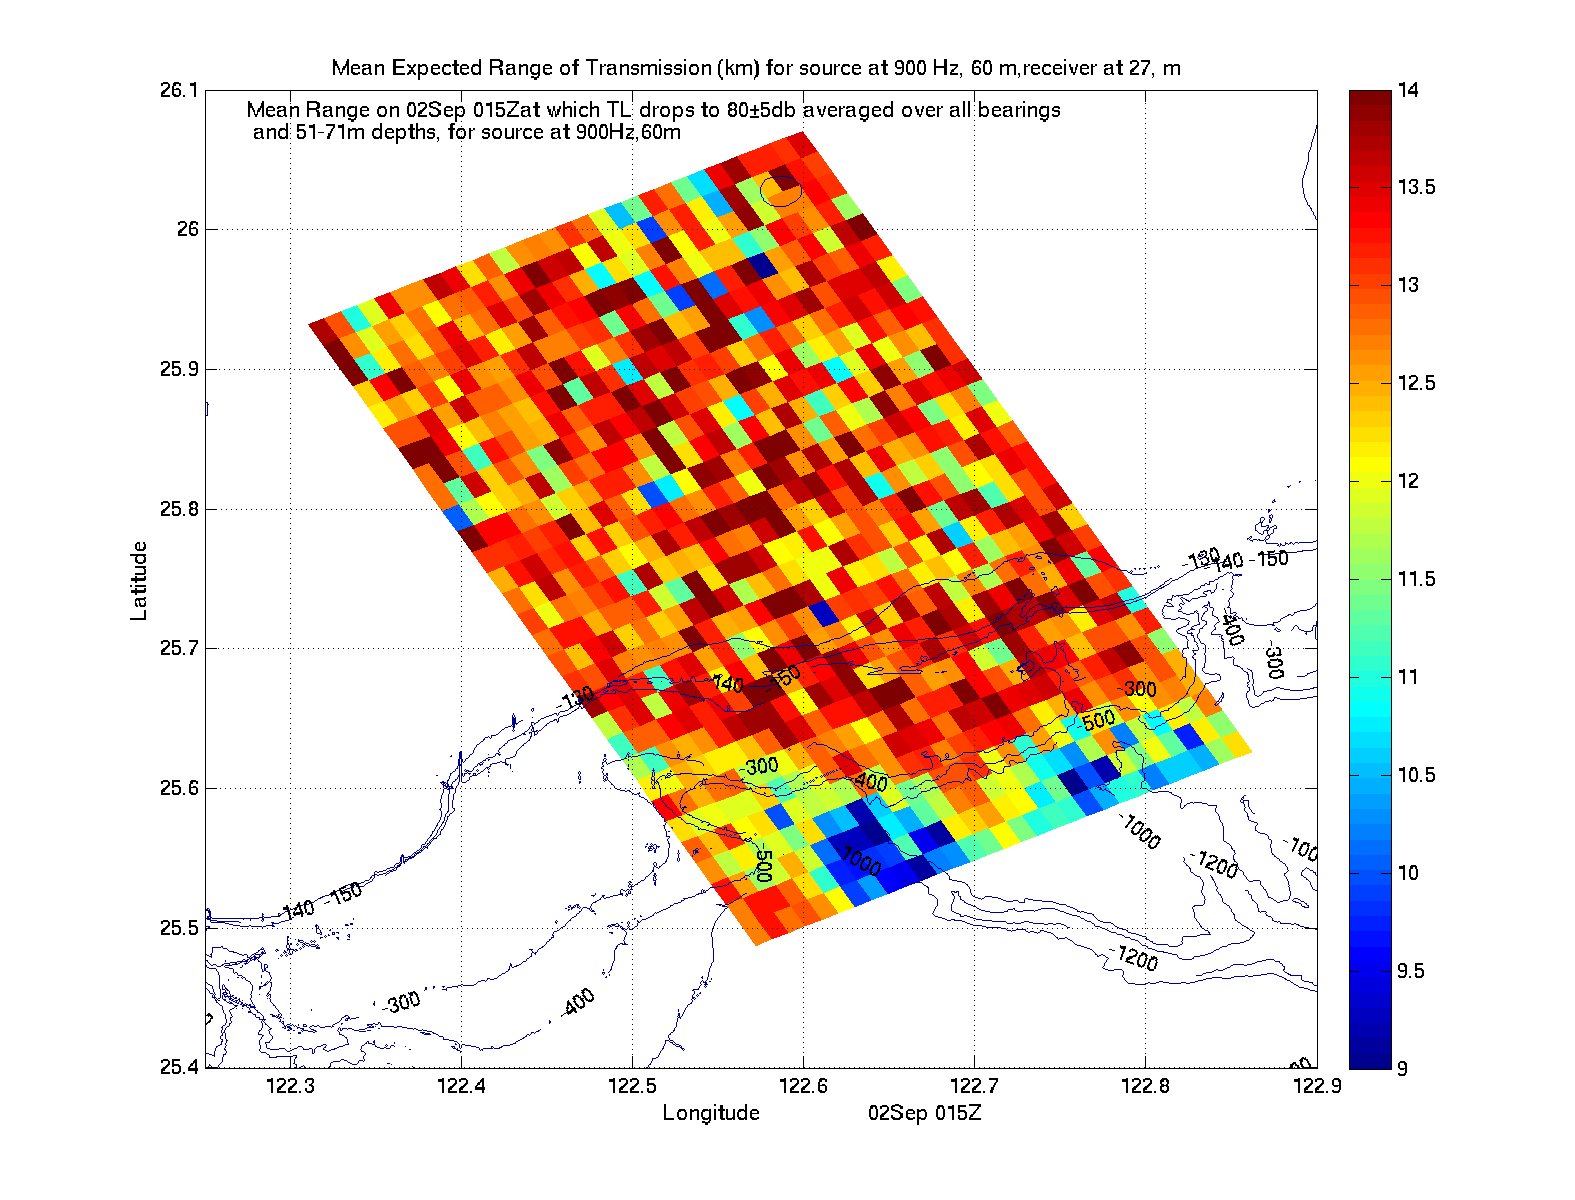
|
Std Dev in Depth
of Expected Range |
Std Dev in Depth
of Expected X-Slope Range |
Std Dev in Depth
of Expected Along-Slope Range |
Std Dev in Bearing
of Expected Range for 27m Receiver |
|

|
|
|
Std Dev in Bearing
of Expected Range |
|
|
|
|
|
|
|
| Fcst. for 2 Sep. 21Z |
|---|
| Acoustic Climate Maps for a TL drop to 60±5 db |
|---|
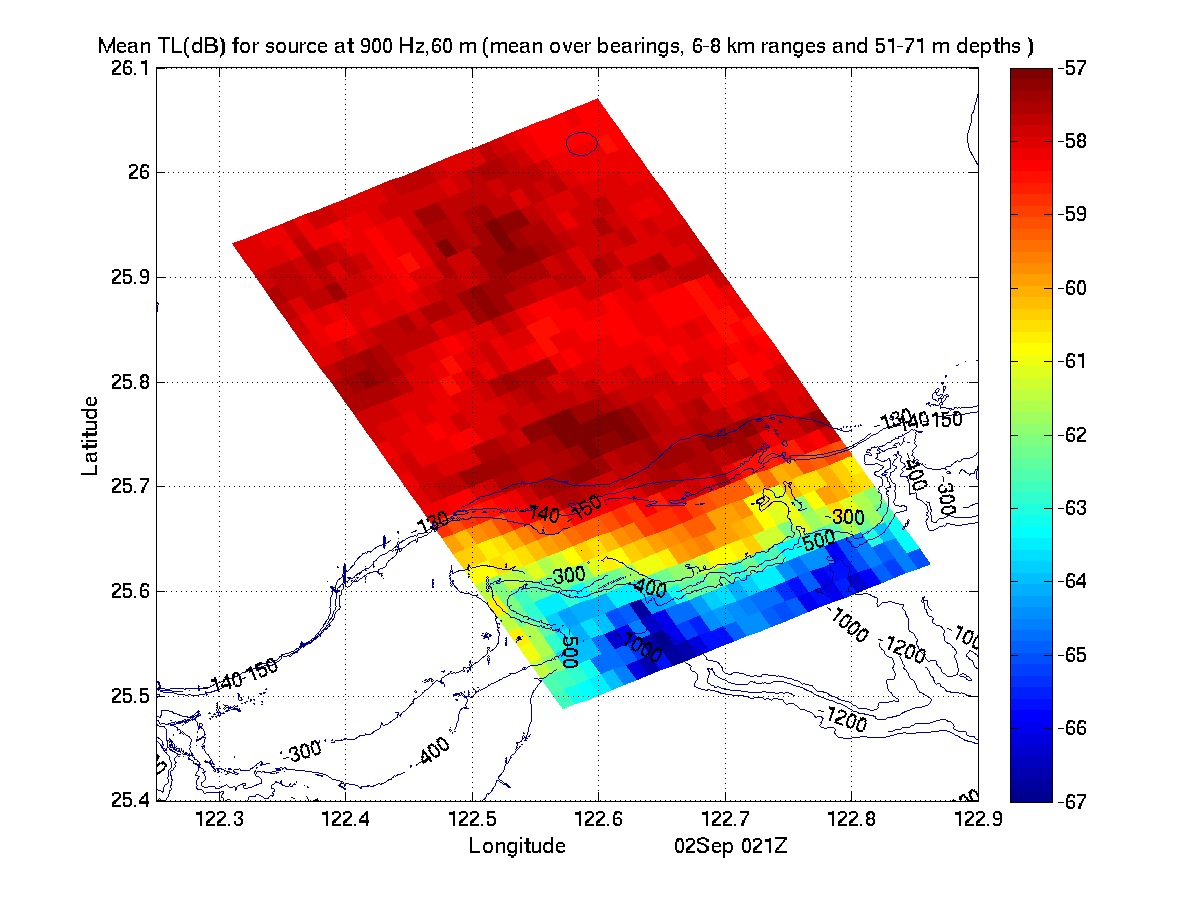
TL(xs,ys,ts)
(TL (db) for source at 900Hz, 60m
averaged over all bearings, 6-8km ranges and 51-71m depths) |
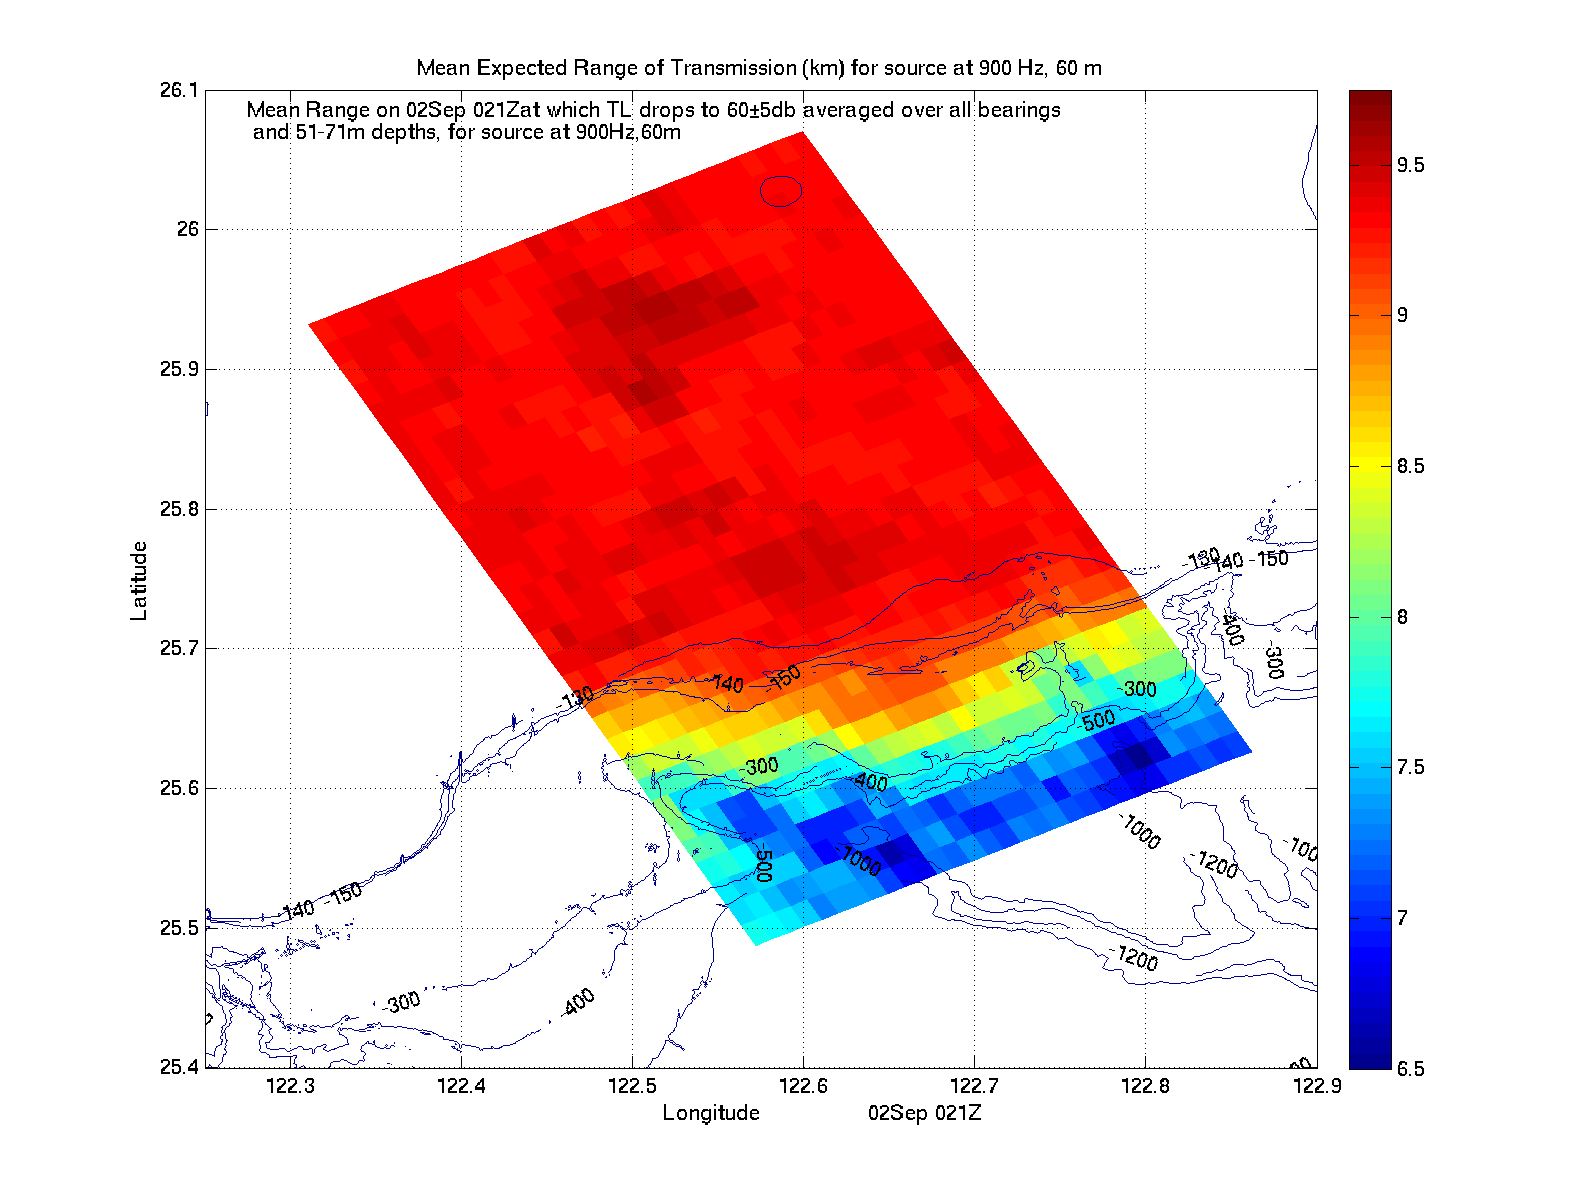
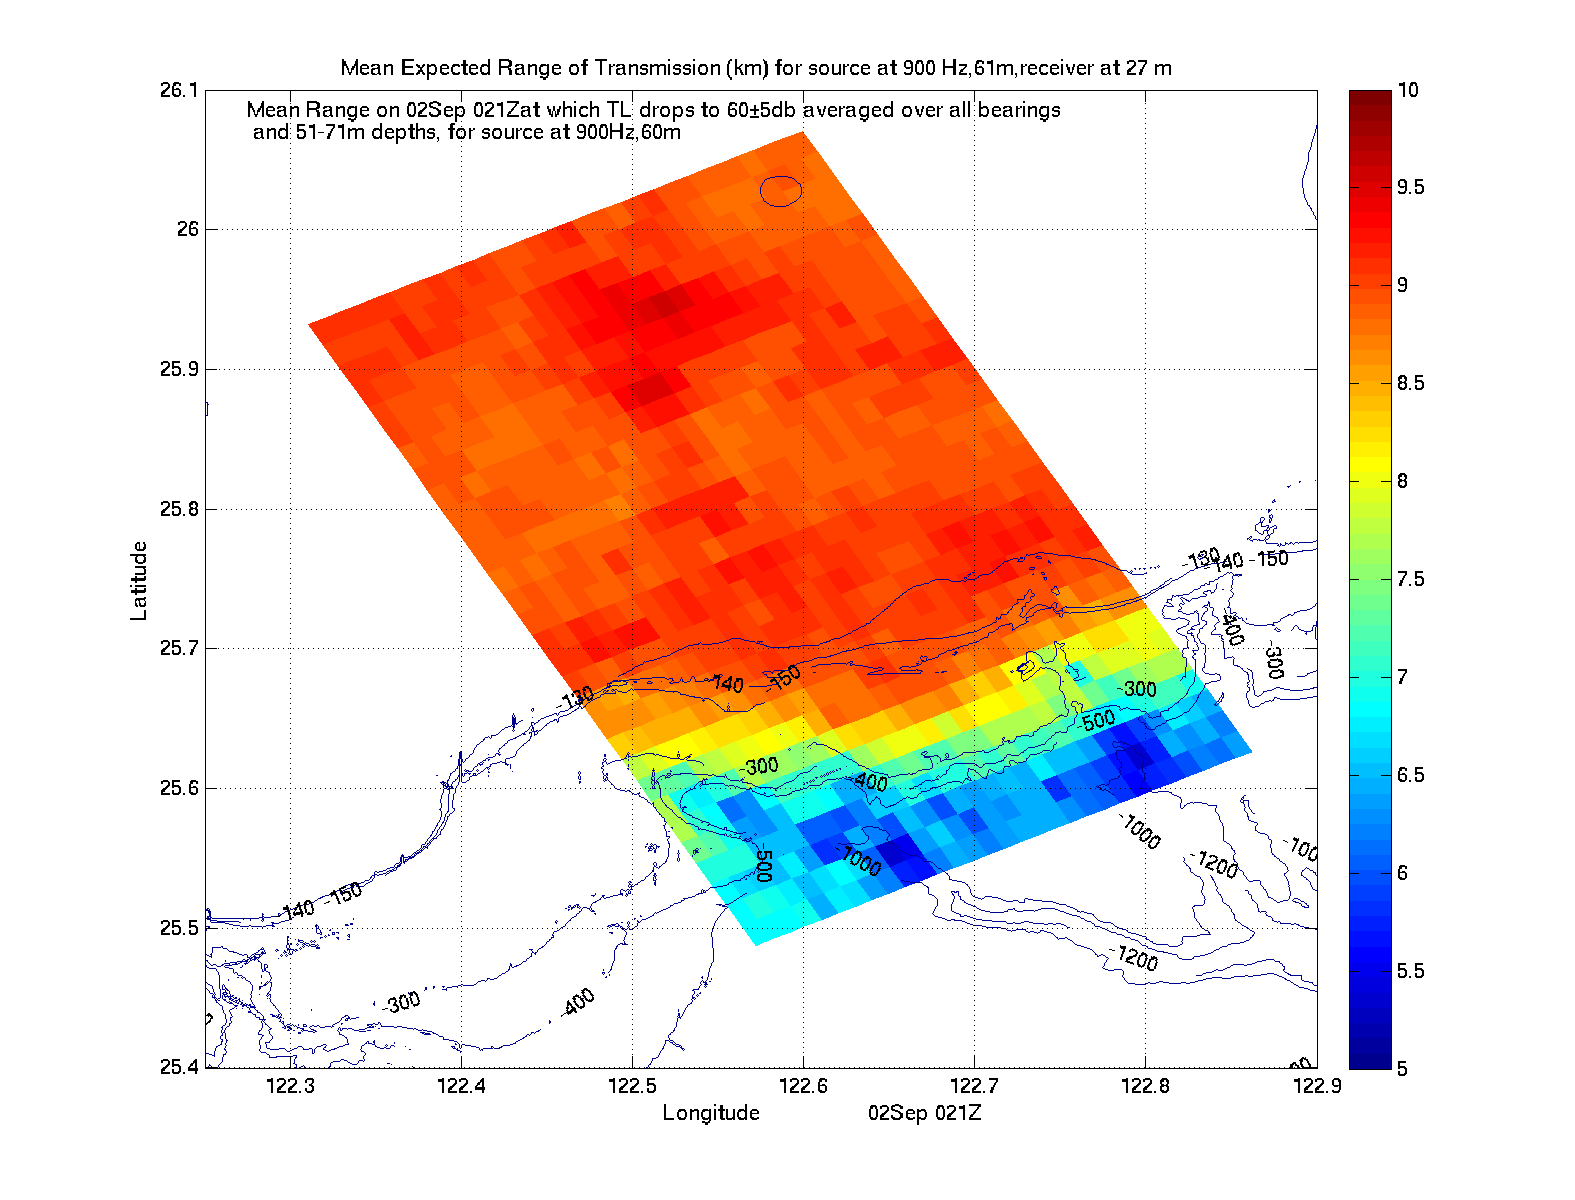
Expected Range (km) at fixed time ts for source at (xs,ys)
(Mean
Range on 02Sep 21Z at which TL drops to 60±5 db averaged over all
bearings and 51-71m depths, for source at 900Hz, 60m) |
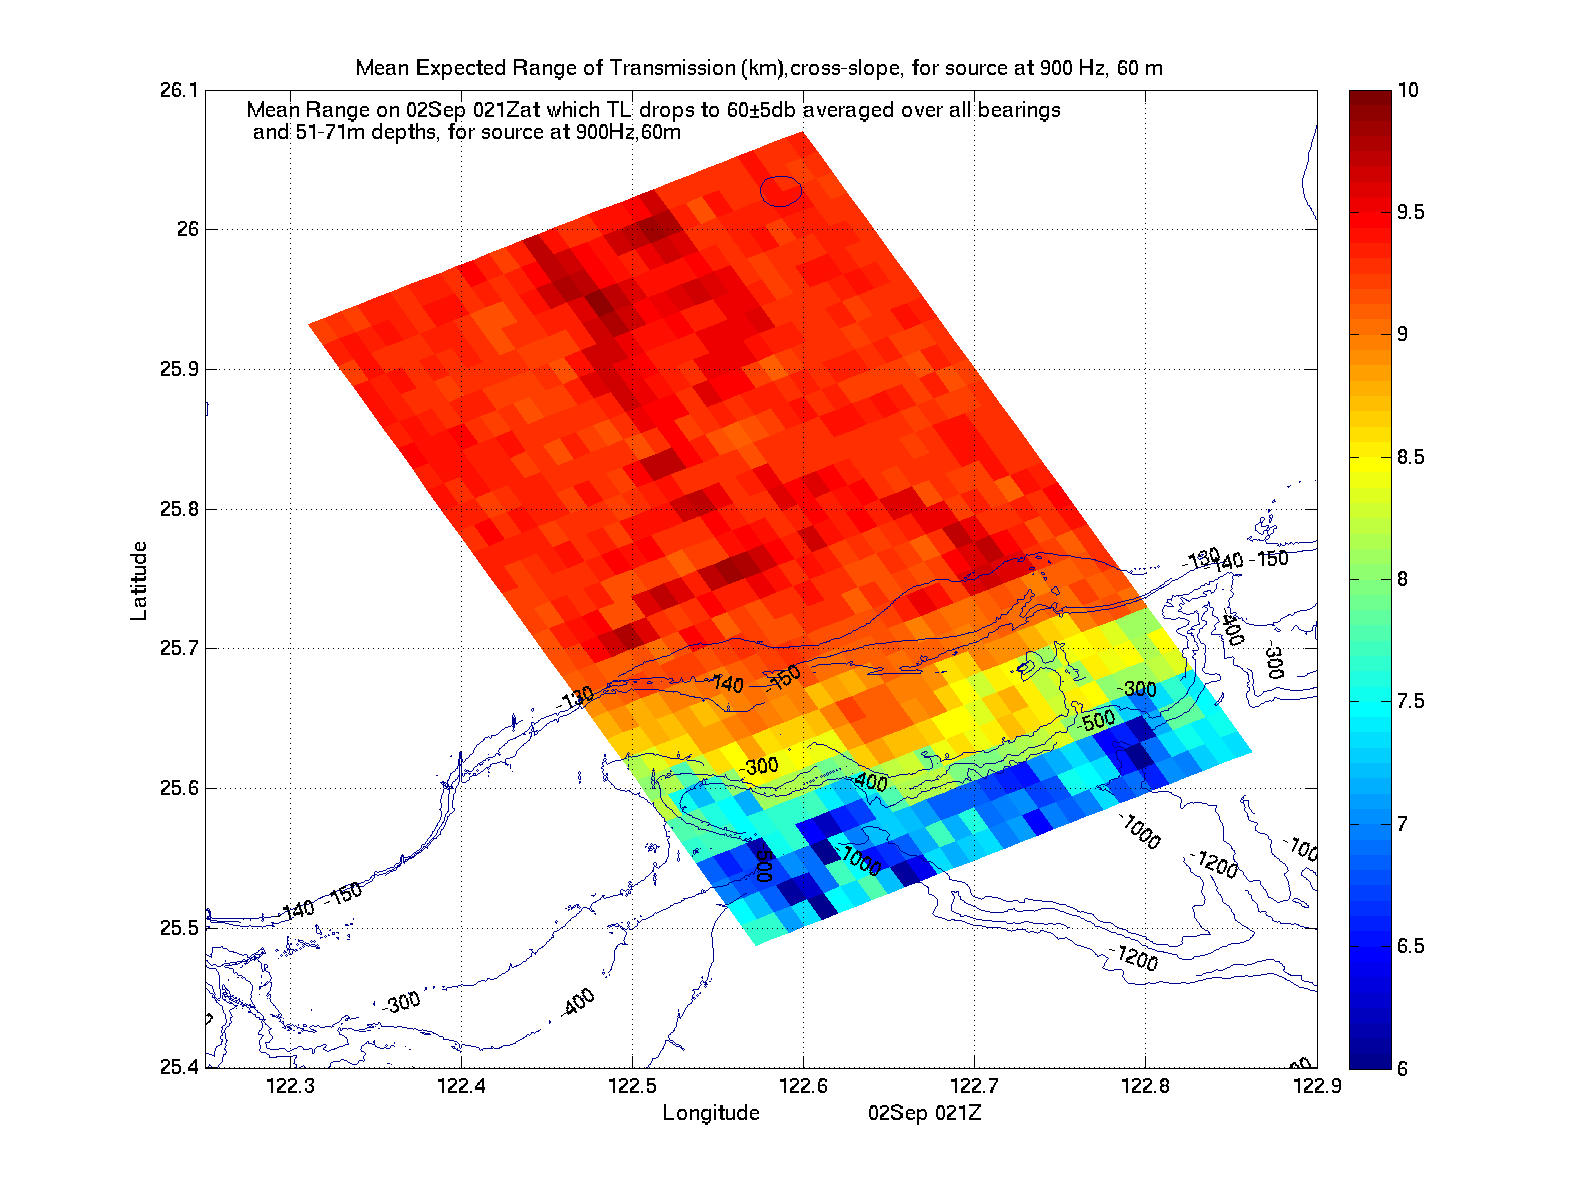
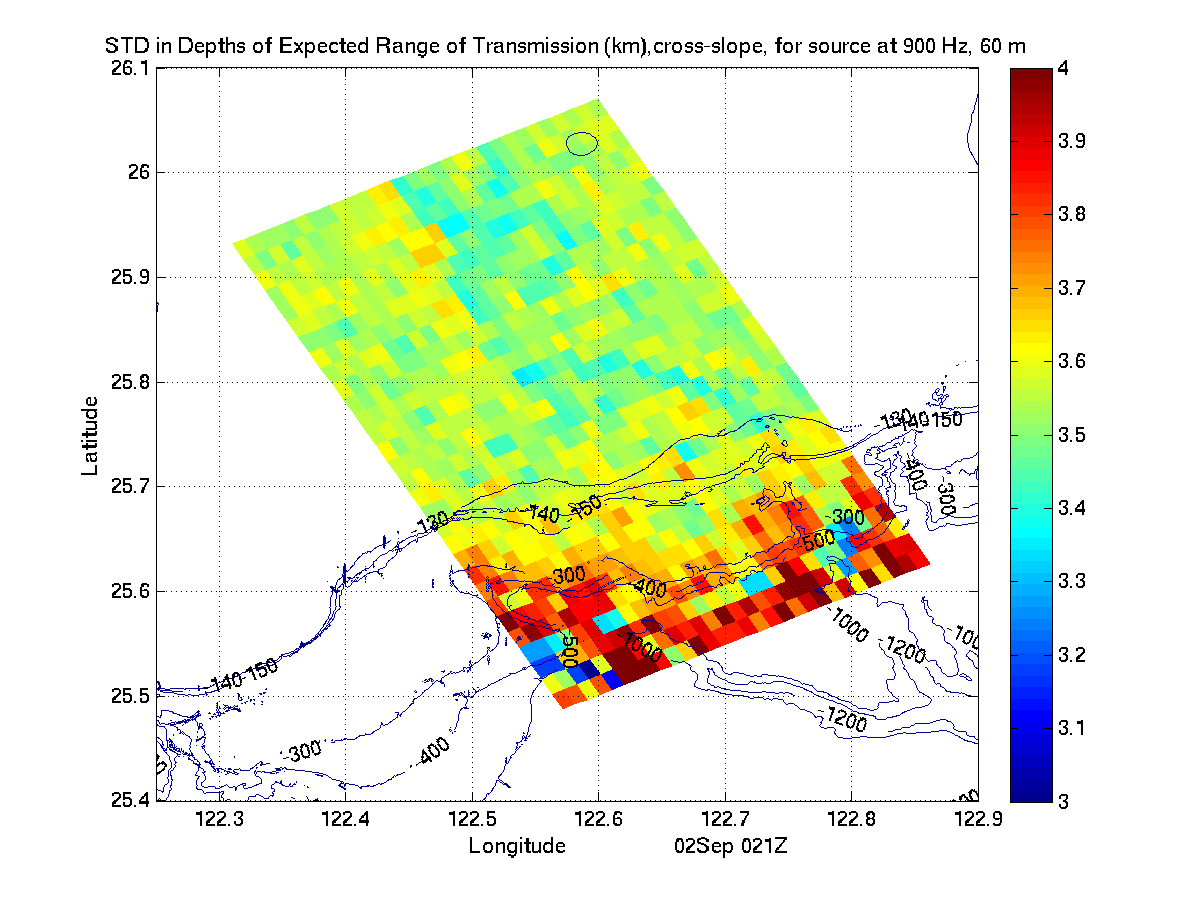
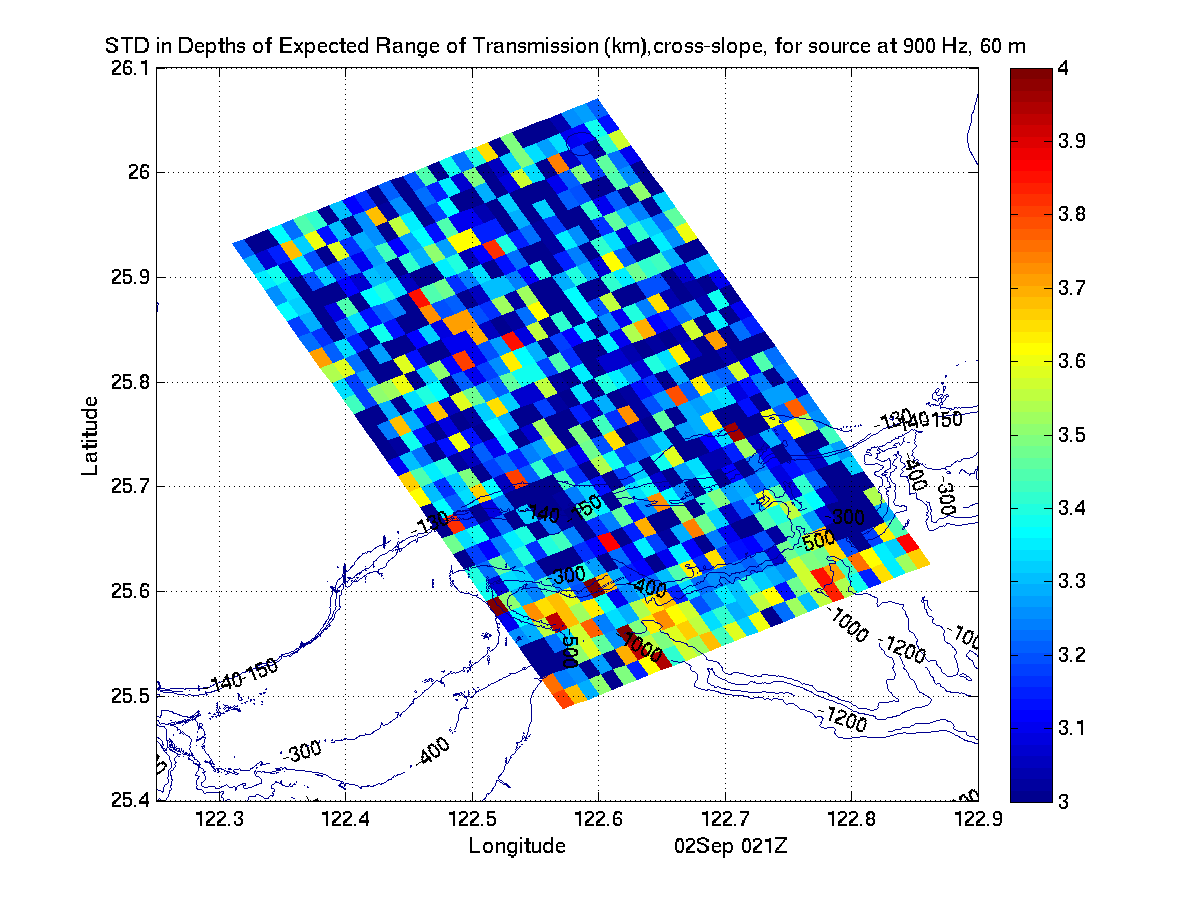
Expected Range (km) in cross-slope direction at fixed time
ts for source at (xs,ys)
(Mean
Range on 02Sep 21Z at which TL in cross-slope direction drops to
60±5 db averaged over 51-71m depths, for source at 900Hz, 60m) |
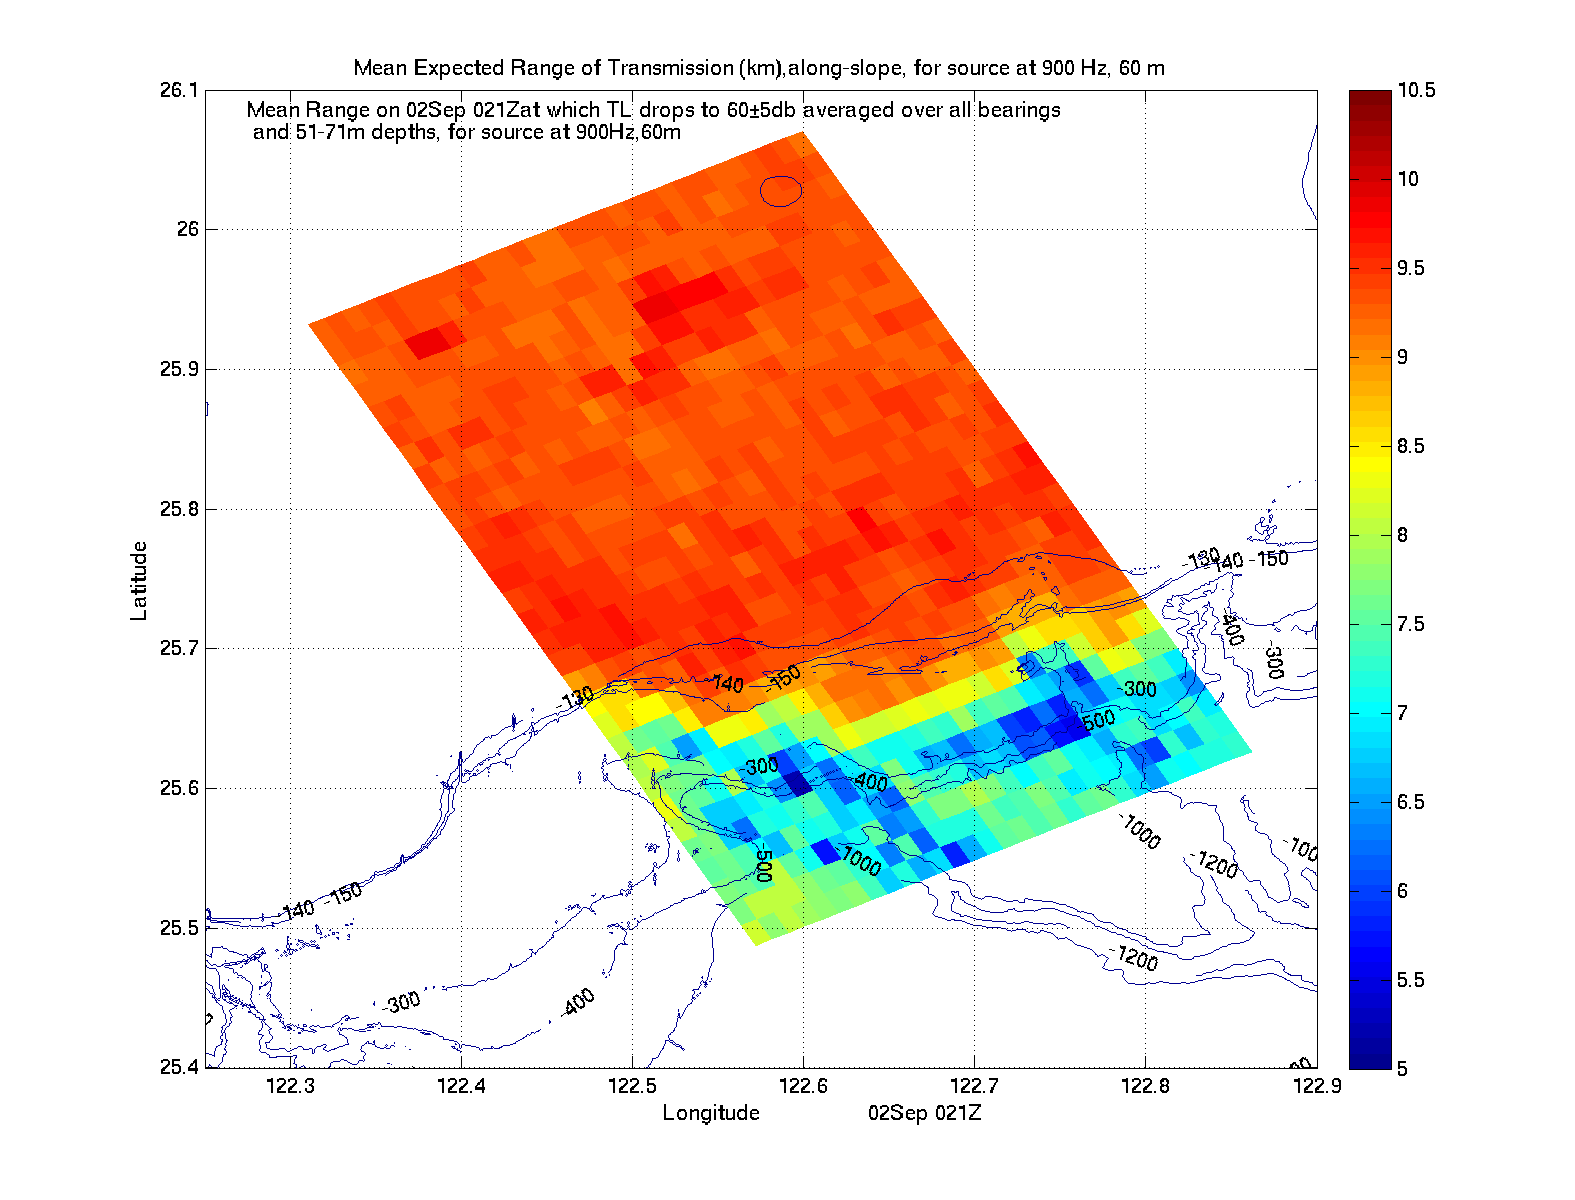
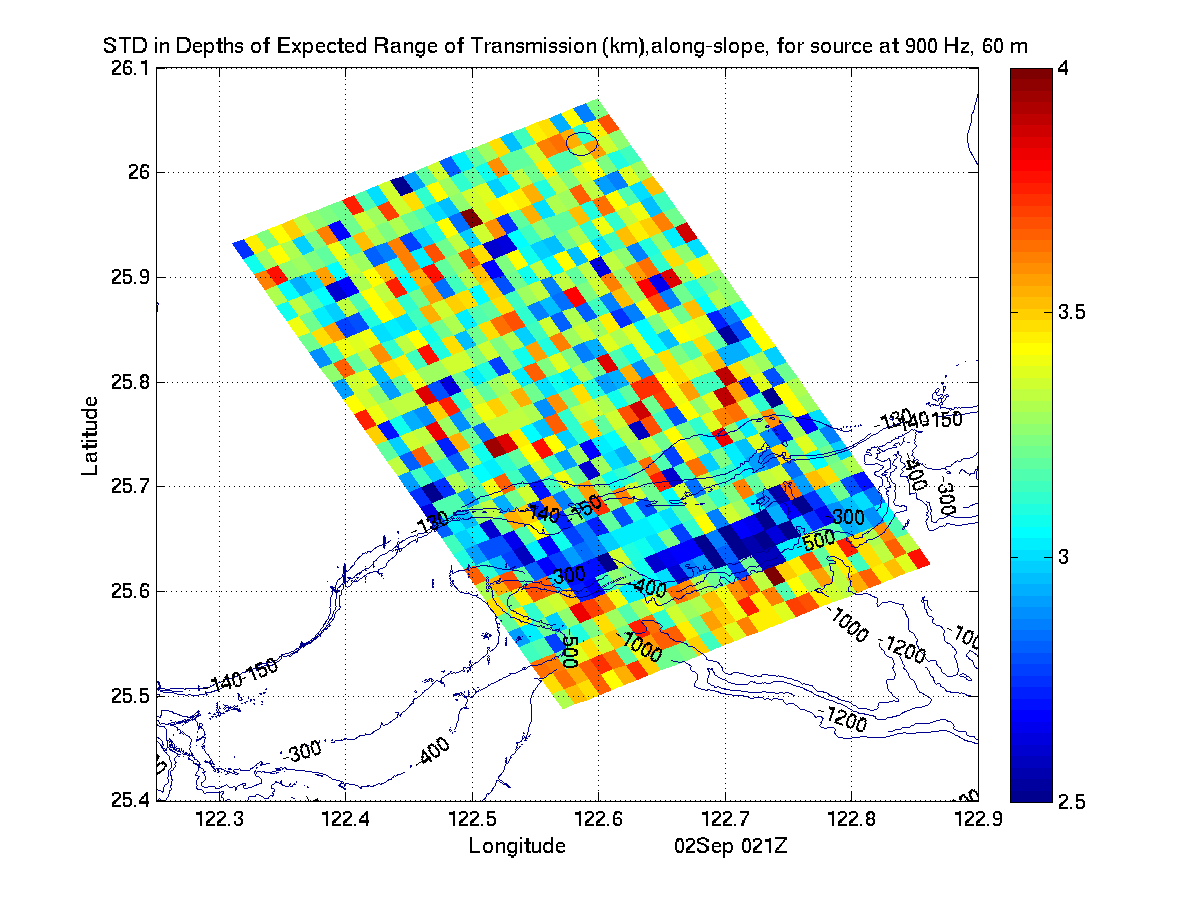
Expected Range (km) in along-slope direction at fixed time ts
for source at (xs,ys)
(Mean
Range on 02Sep 21Z at which TL in along-slope direction drops to
60±5 db averaged over 51-71m depths, for source at 900Hz, 60m) |
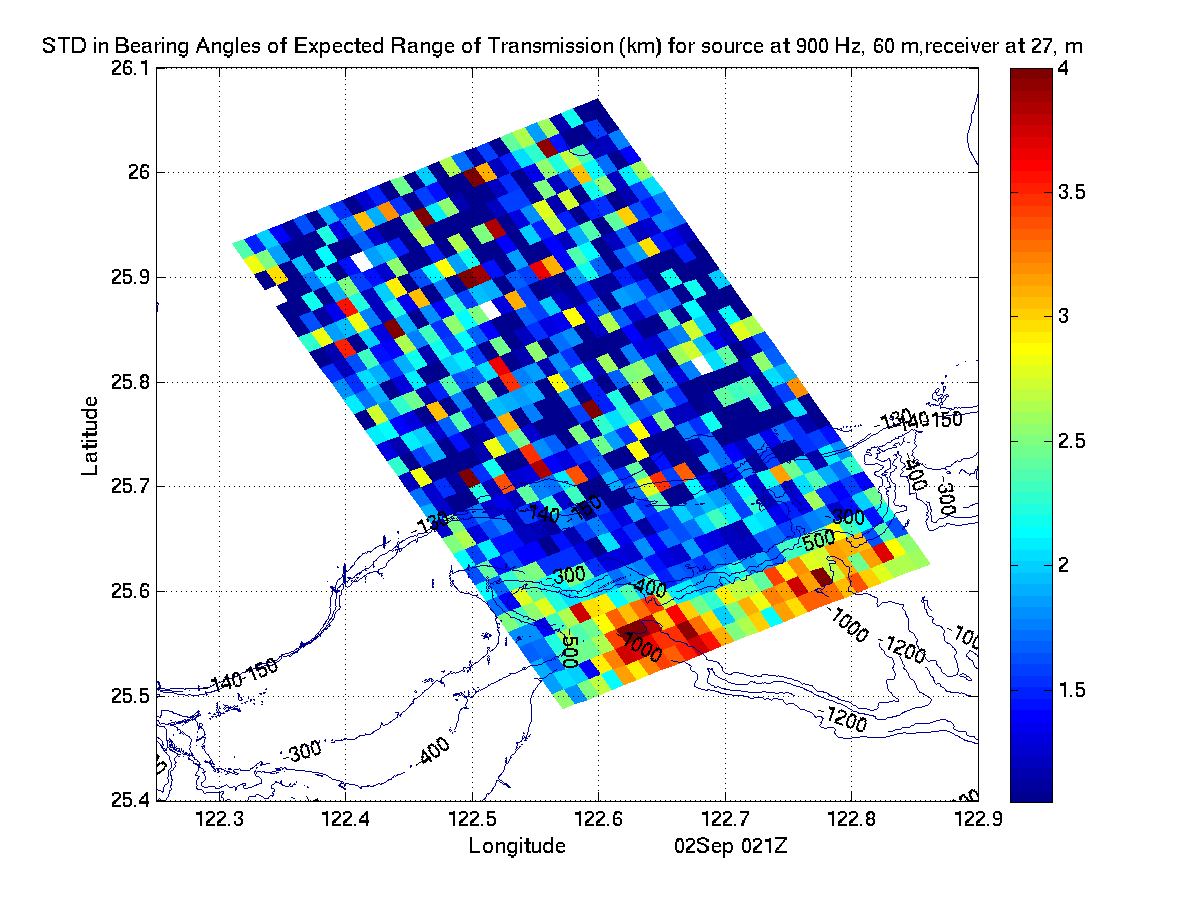
Expected Range (km) at fixed time ts for source at (xs,ys)
and receiver at 27m depth
(Mean
Range on 02Sep 21Z at which TL drops to 60±5 db for receiver at
27m depth, averaged over all bearings, for source at 900Hz, 60m) |
|
|
|
|
|
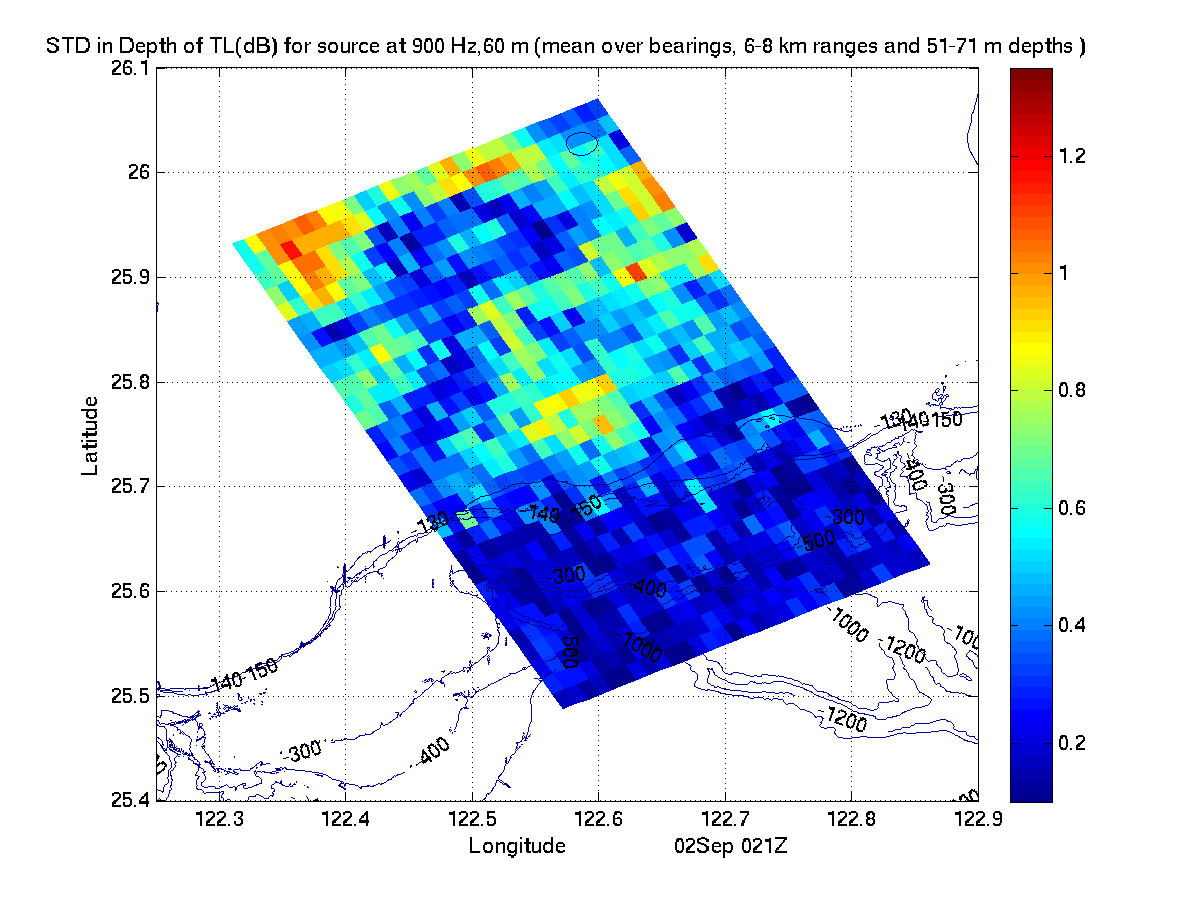
| Std Dev in Depth of TL |
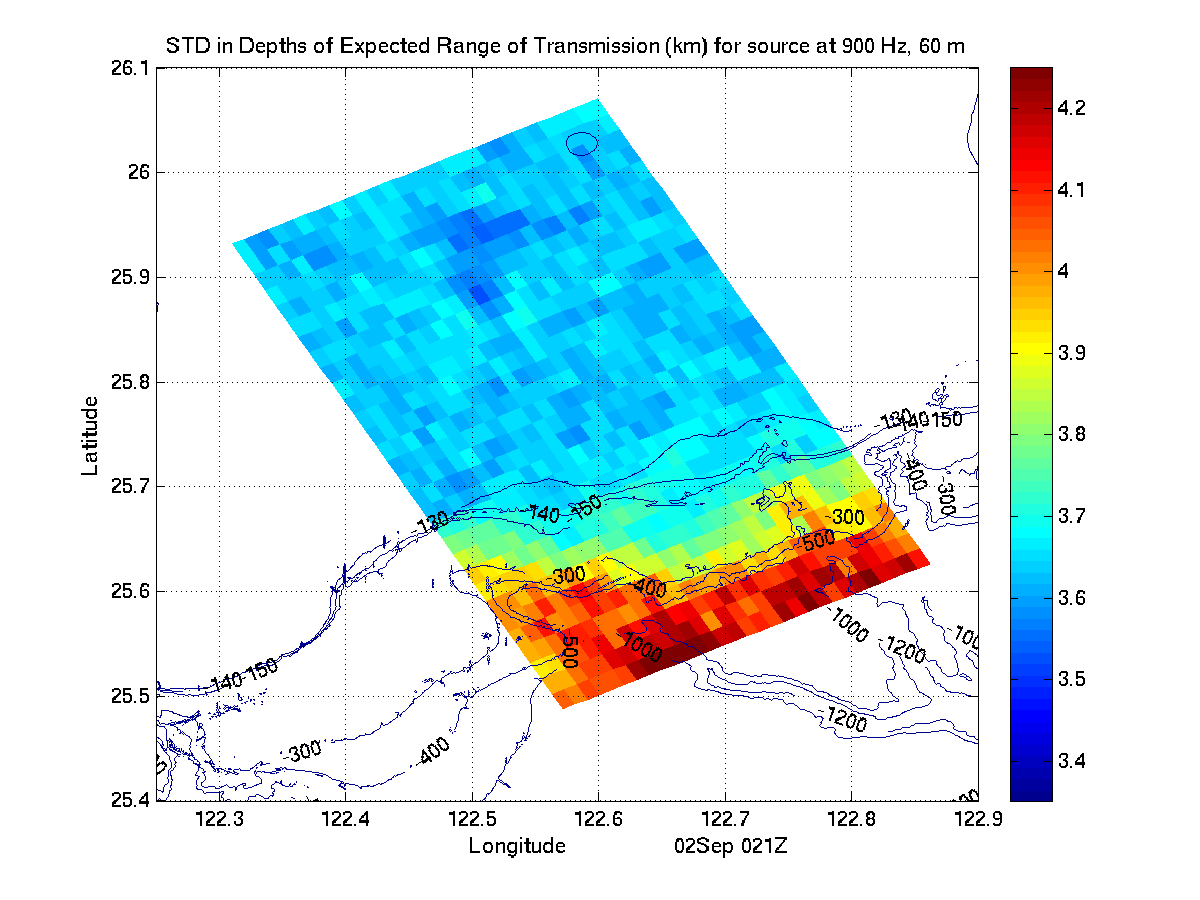
Std Dev in Depth
of Expected Range |
Std Dev in Depth
of Expected X-Slope Range |
Std Dev in Depth
of Expected Along-Slope Range |
Std Dev in Bearing
of Expected Range for 27m Receiver |
|
|
|
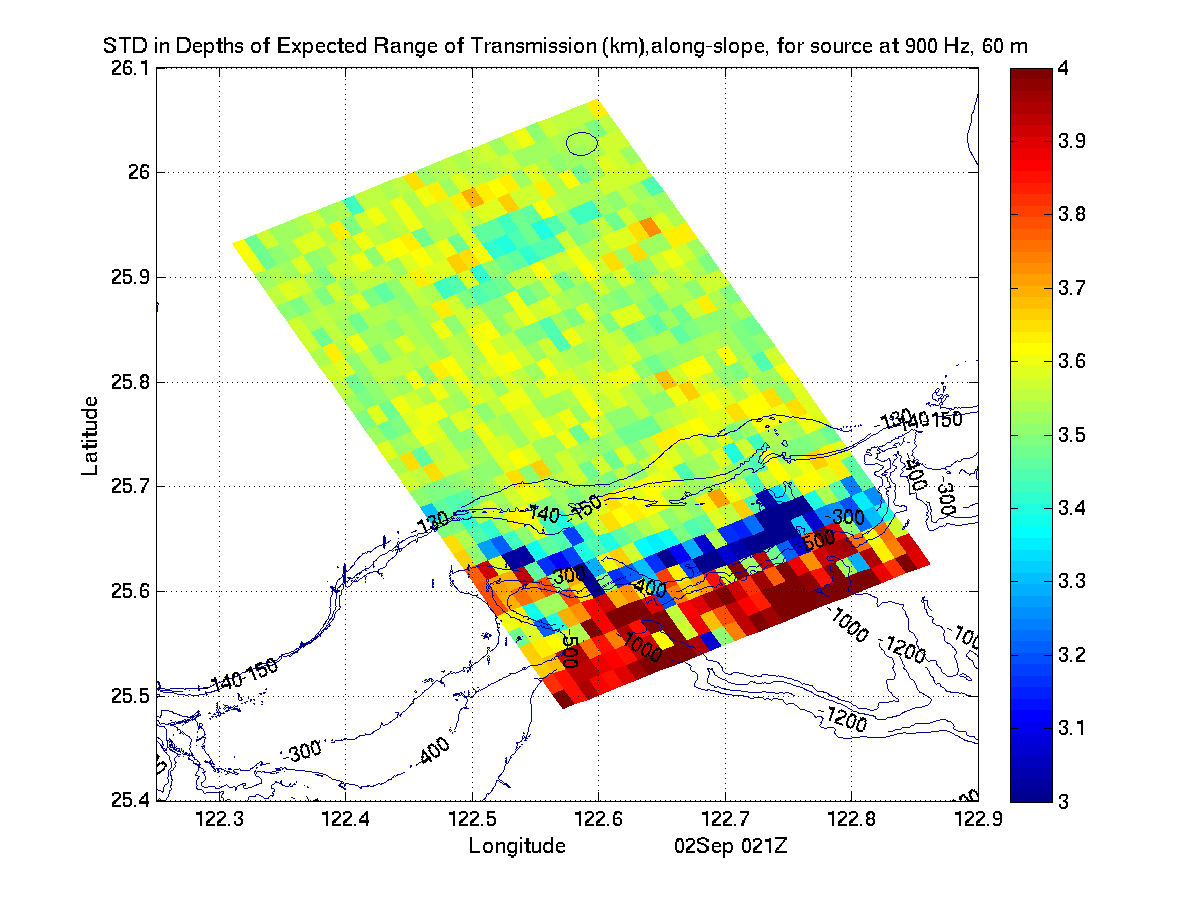
|
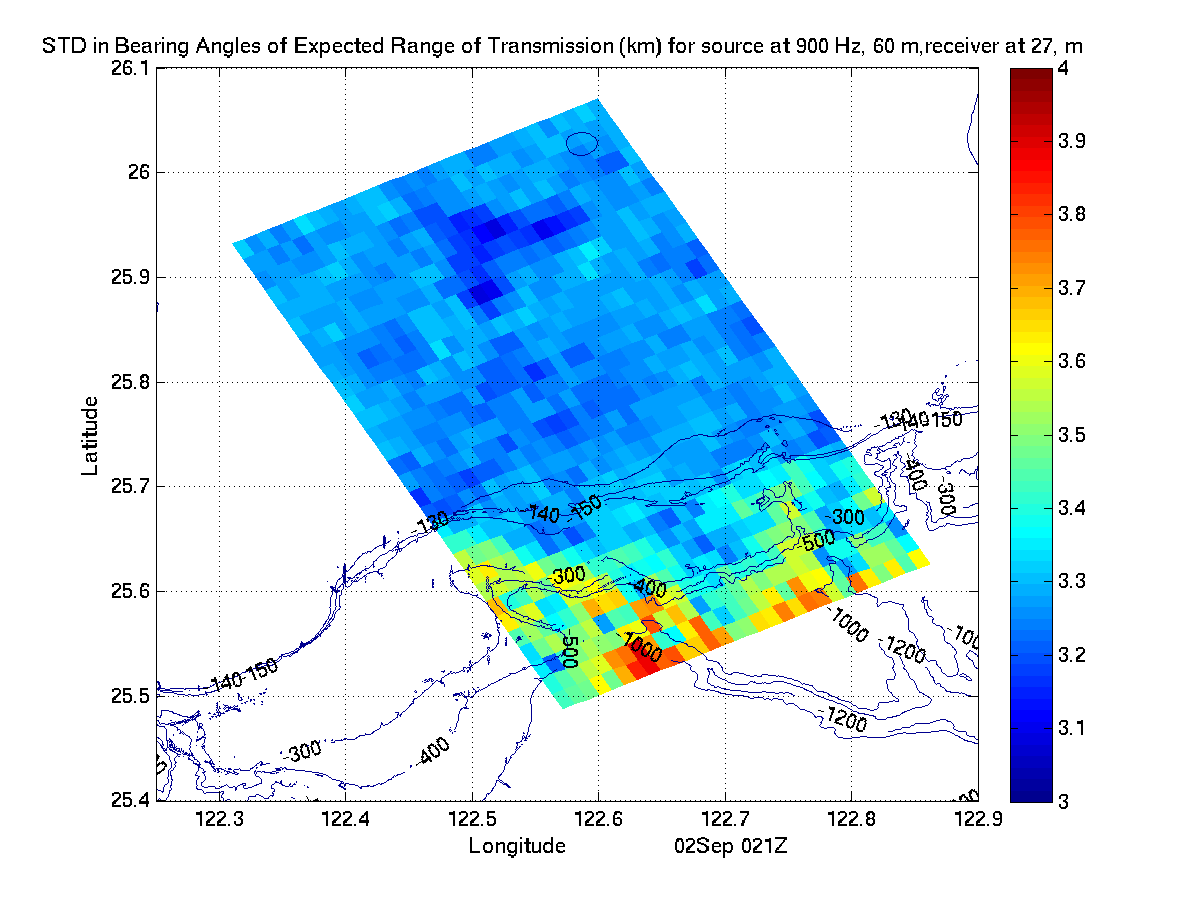
|
| Std Dev in Bearing of TL |
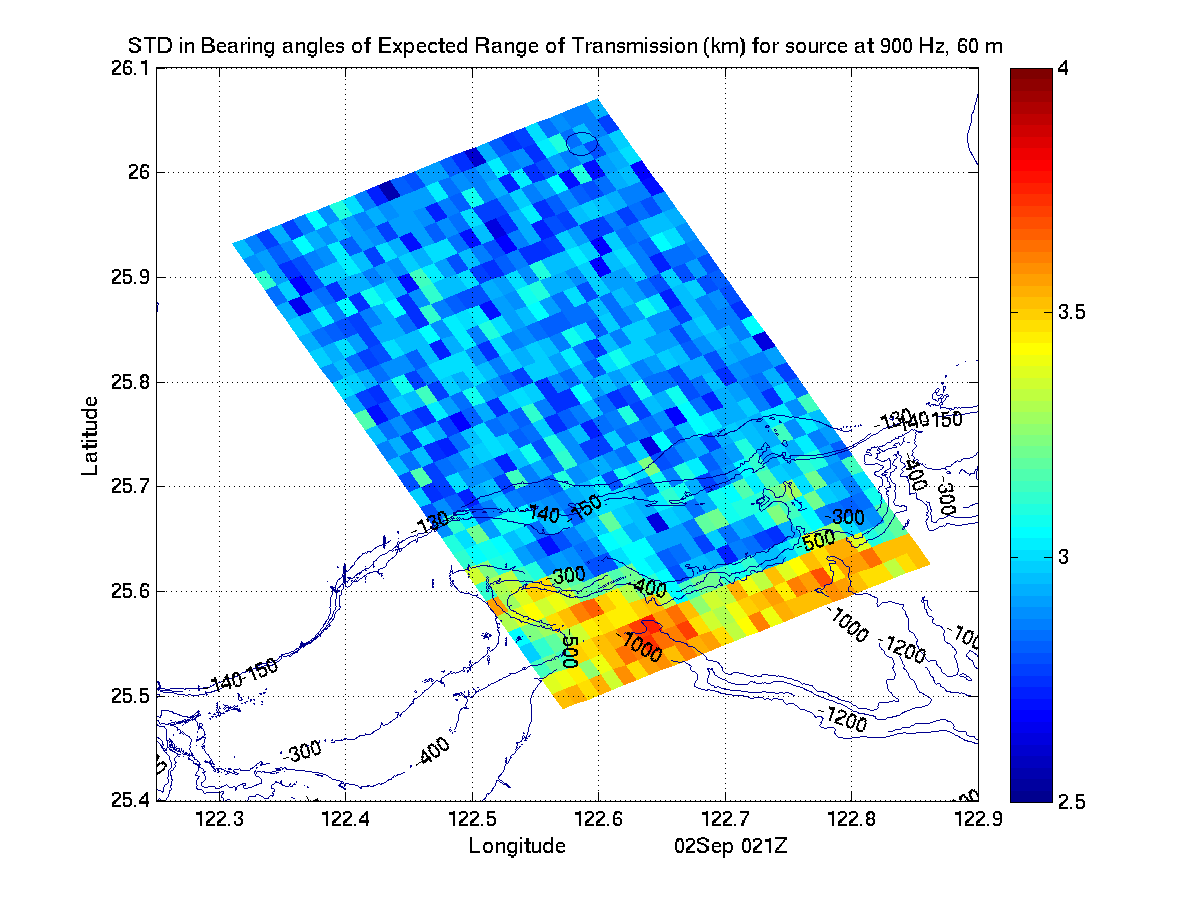
Std Dev in Bearing
of Expected Range |
|
|
|
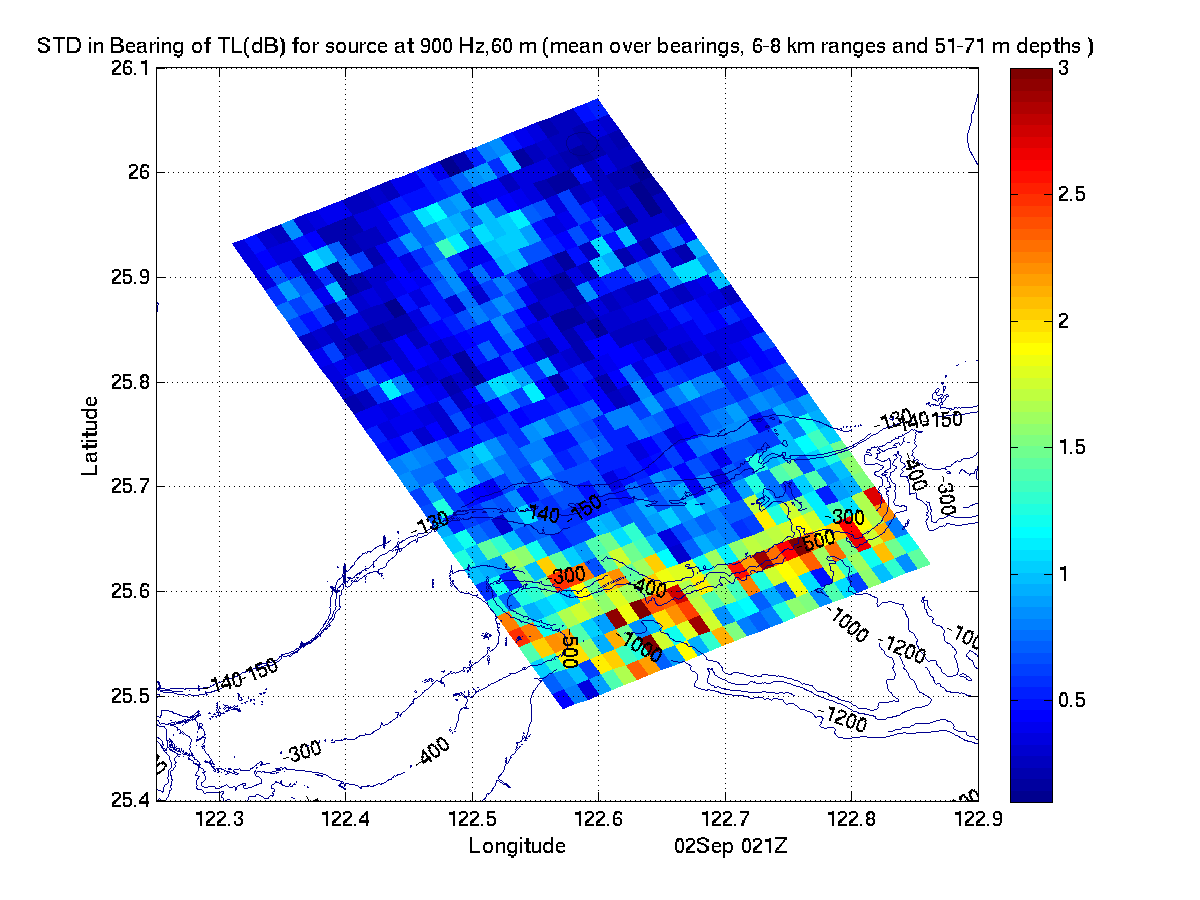
|

|
|
|
|
| Acoustic Climate Maps for a TL drop to 80±5 db |
|---|
Expected Range (km) at fixed time ts for source at (xs,ys)
(Mean
Range on 02Sep 21Z at which TL drops to 80±5 db averaged over all
bearings and 51-71m depths, for source at 900Hz, 60m) |
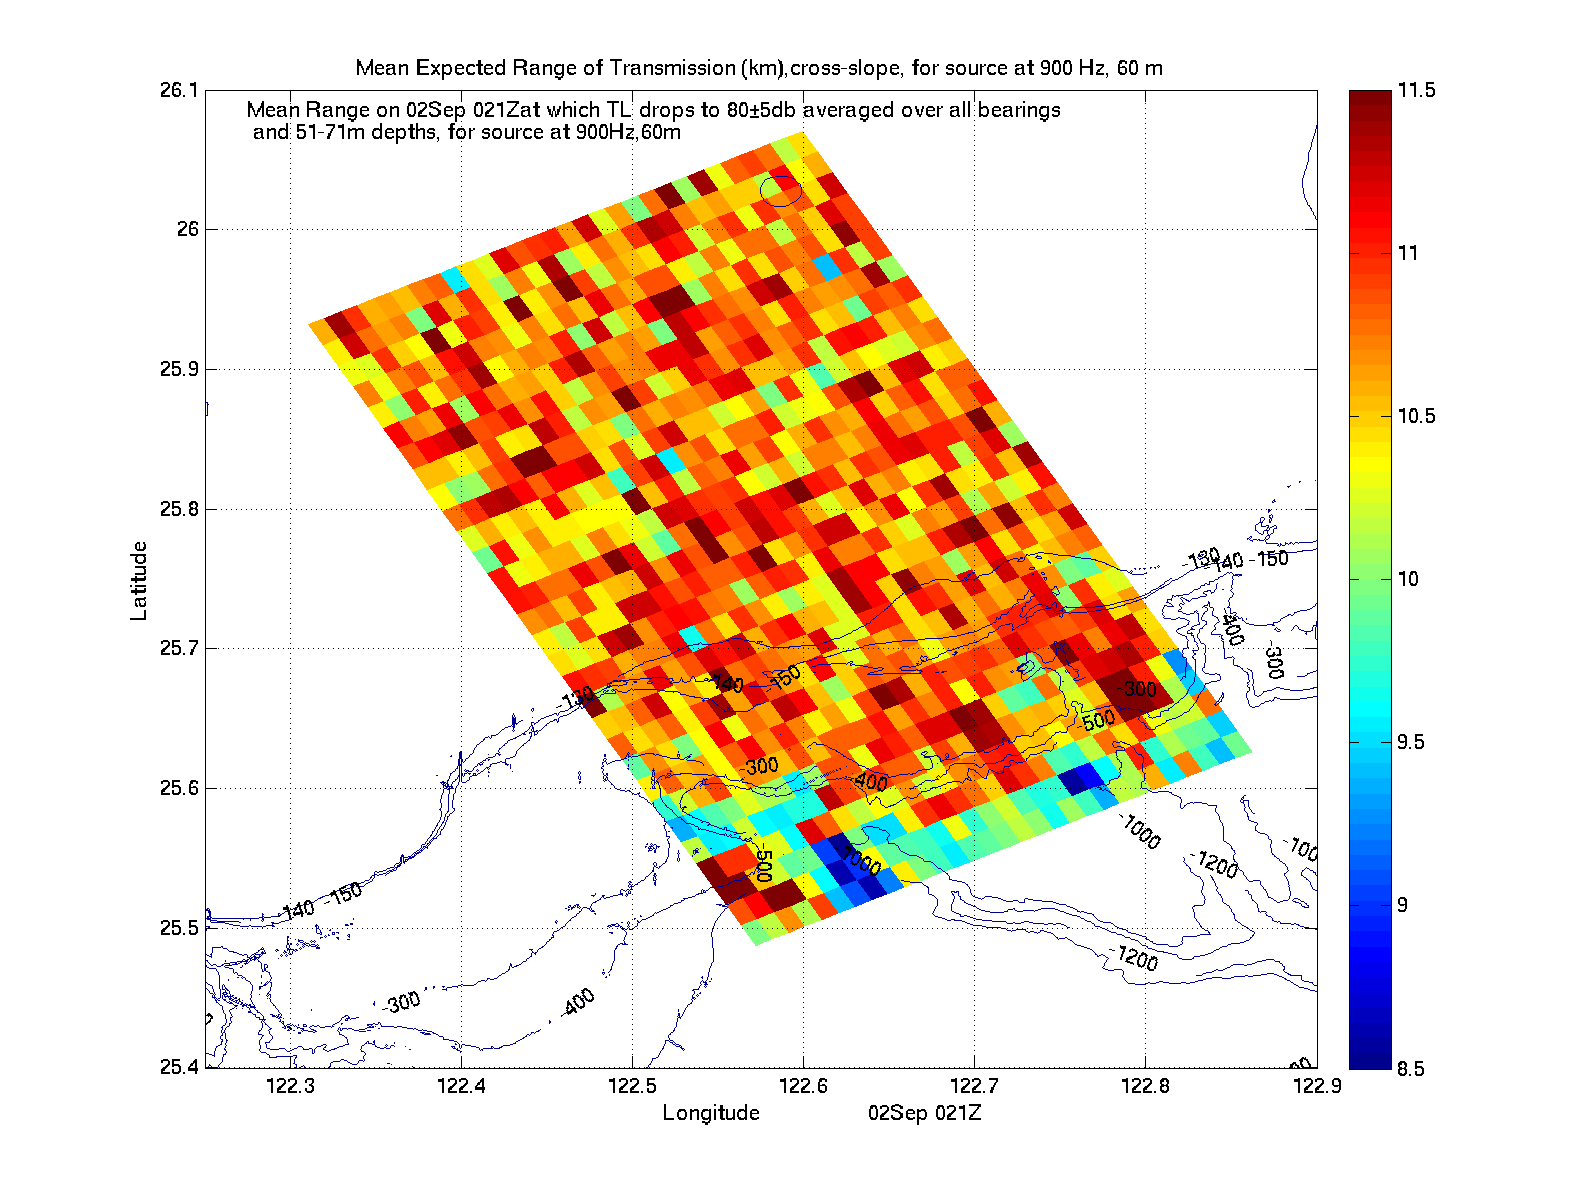
Expected Range (km) in cross-slope direction at fixed time
ts for source at (xs,ys)
(Mean
Range on 02Sep 21Z at which TL in cross-slope direction drops to
80±5 db averaged over 51-71m depths, for source at 900Hz, 60m) |
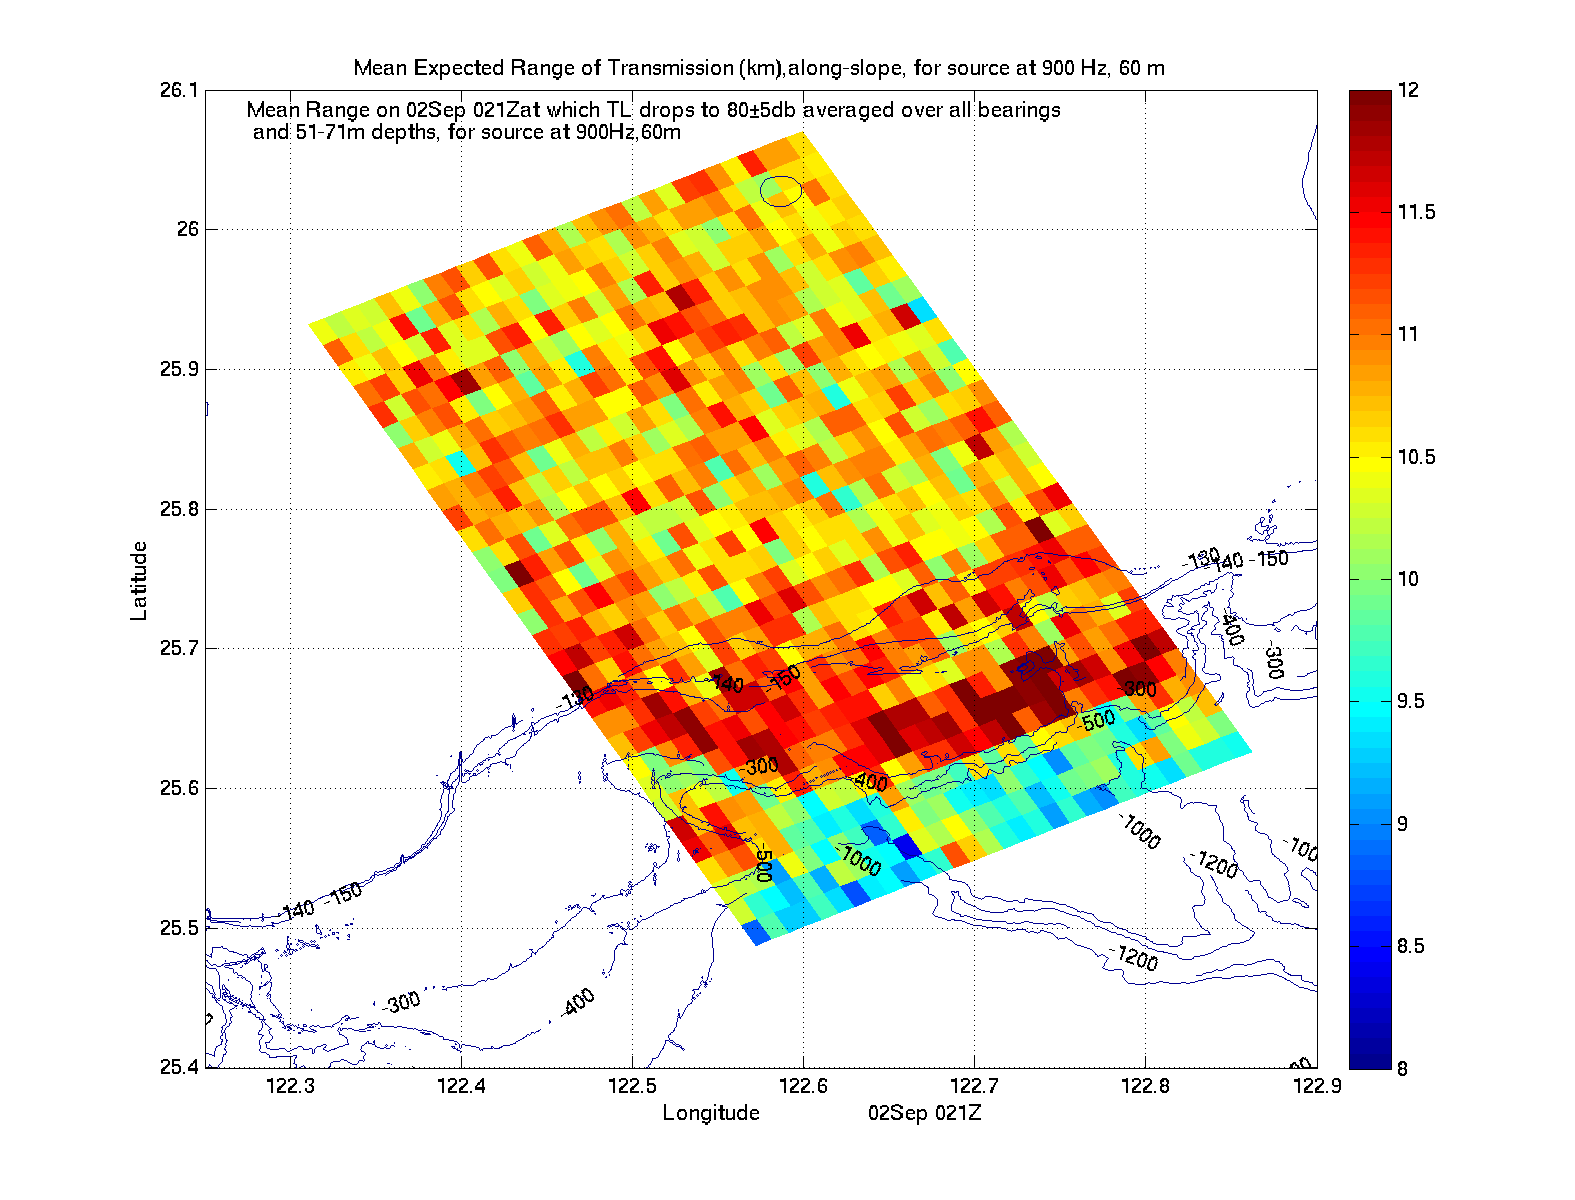
Expected Range (km) in along-slope direction at fixed time ts
for source at (xs,ys)
(Mean
Range on 02Sep 21Z at which TL in along-slope direction drops to
80±5 db averaged over 51-71m depths, for source at 900Hz, 60m) |
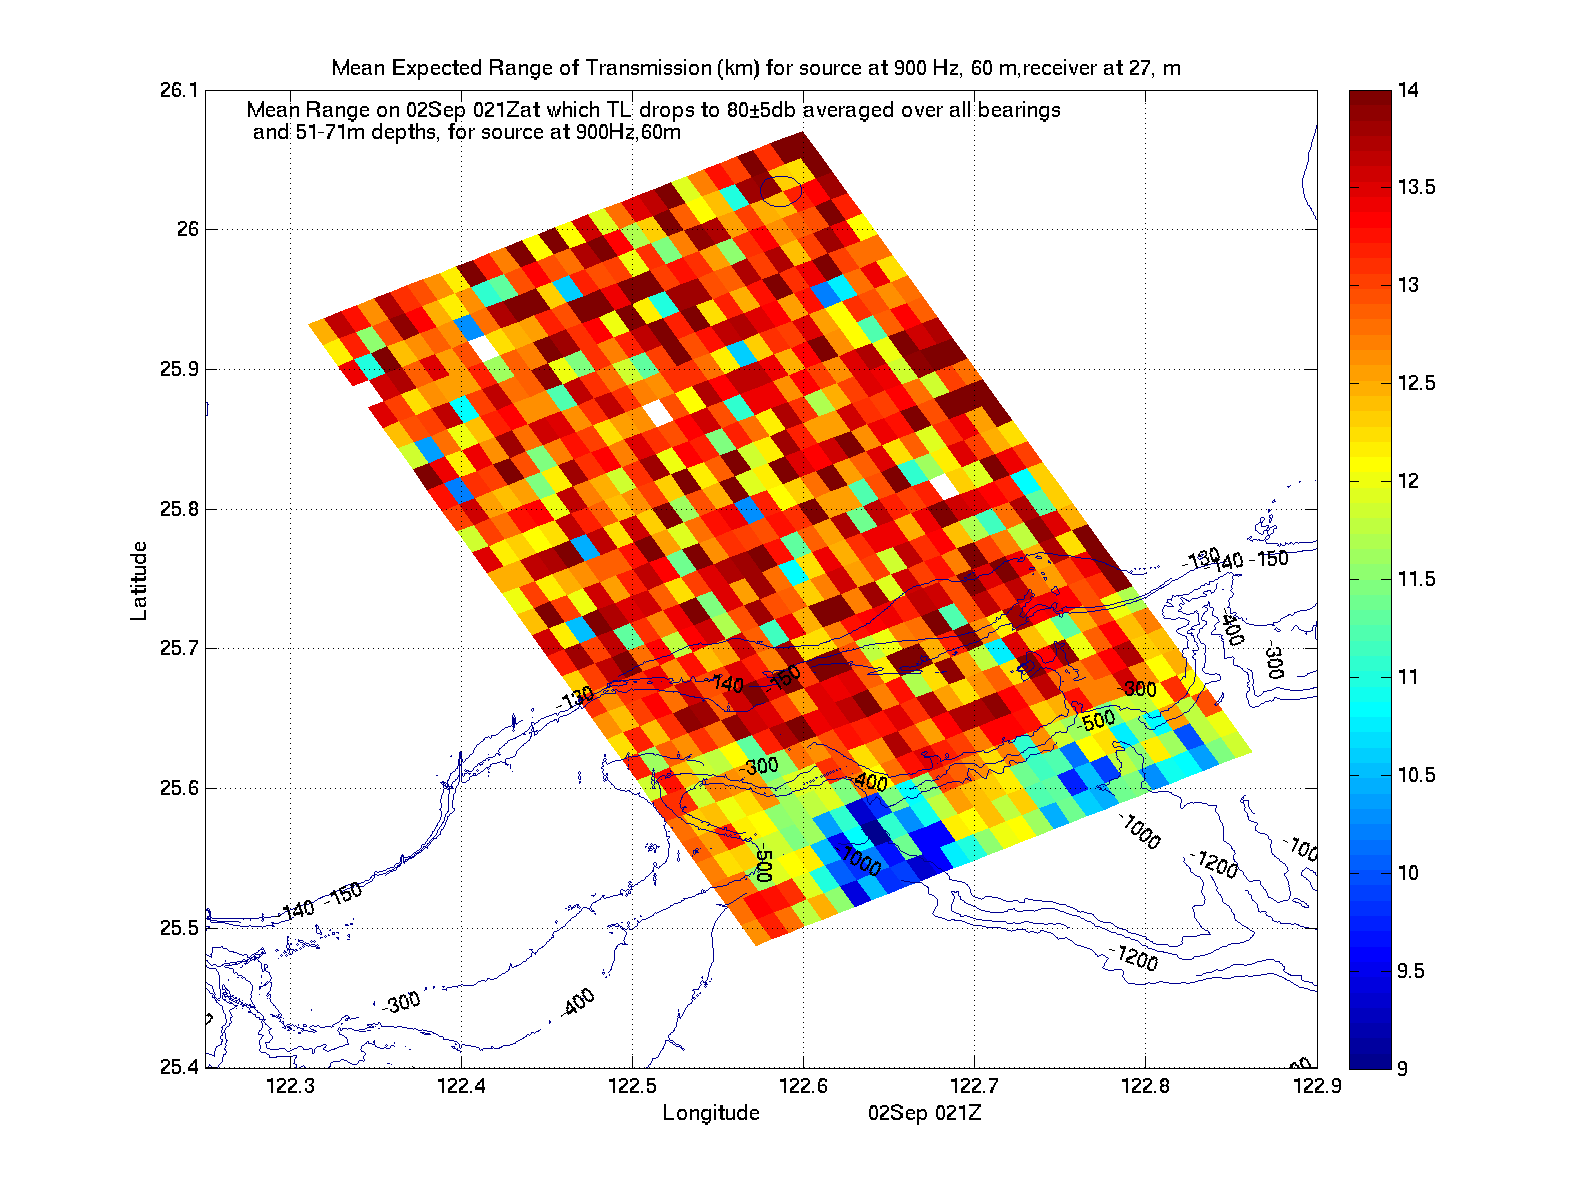
Expected Range (km) at fixed time ts for source at (xs,ys)
and receiver at 27m depth
(Mean
Range on 02Sep 21Z at which TL drops to 80±5 db for receiver at
27m depth, averaged over all bearings, for source at 900Hz, 60m) |
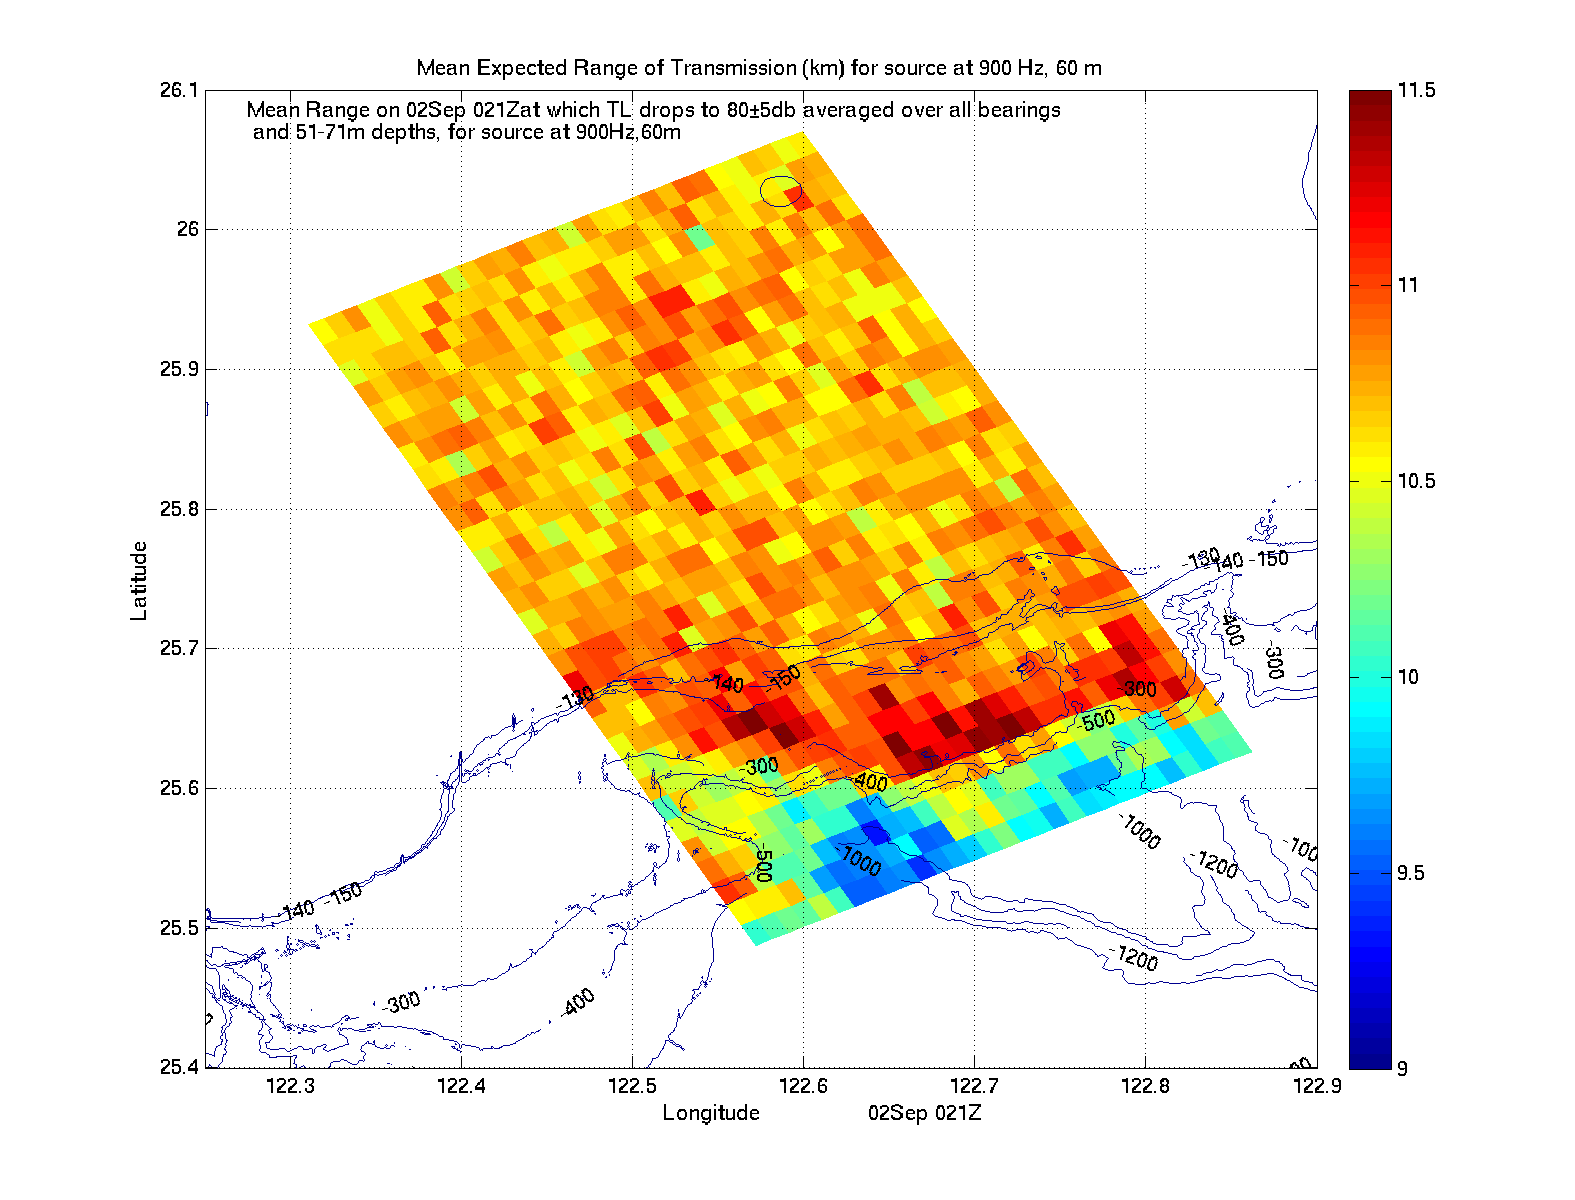
|
|
|
|
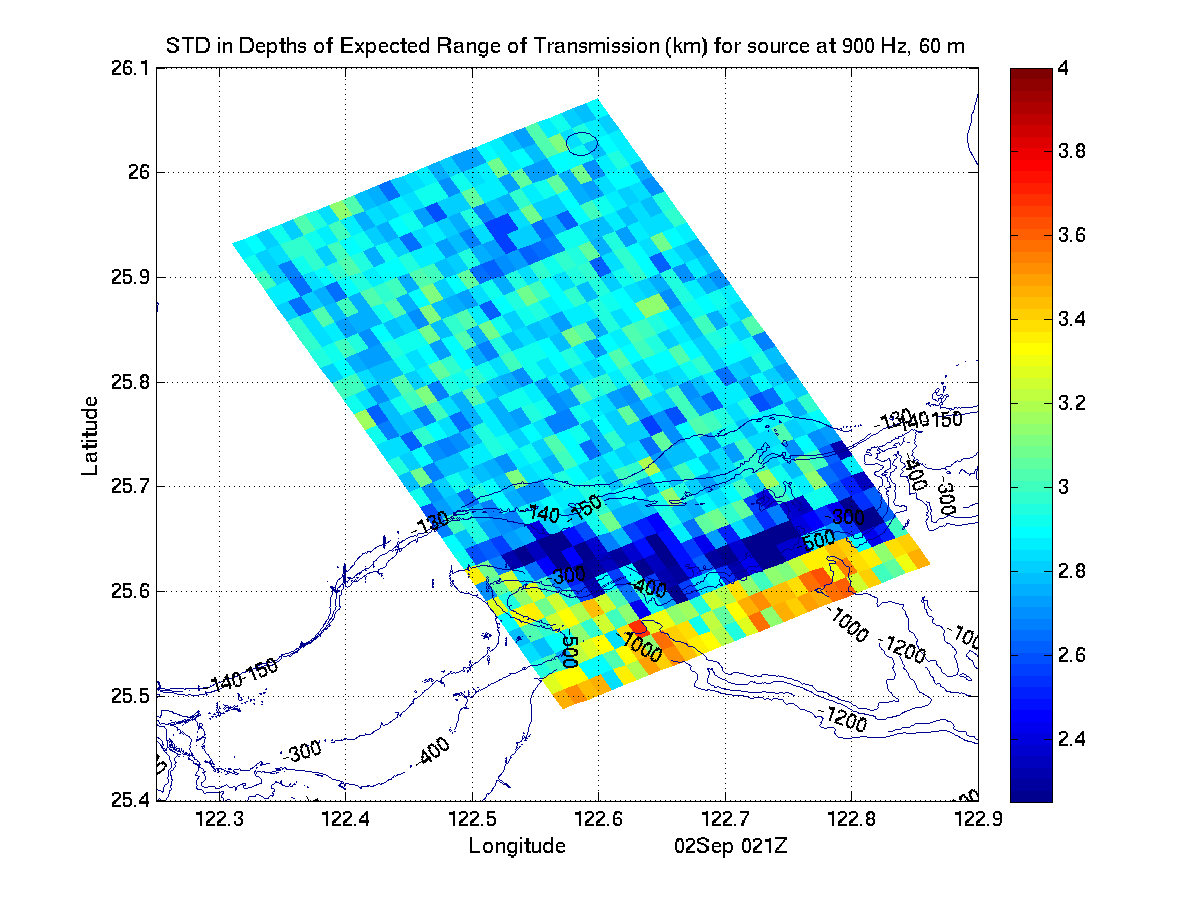
Std Dev in Depth
of Expected Range |
Std Dev in Depth
of Expected X-Slope Range |
Std Dev in Depth
of Expected Along-Slope Range |
Std Dev in Bearing
of Expected Range for 27m Receiver |
|
|
|
|
Std Dev in Bearing
of Expected Range |
|
|
|
|
|
|
|
| UTC and Taiwan time conversion |
|---|
| UTC |
0000 |
0300 |
0600 |
0900 |
1200 |
1500 |
1800 |
2100 |
| CST |
0800 |
1100 |
1400 |
1700 |
2000 |
2300 |
0200 (+1) |
0500 (+1) |
The file names can be interpreted as follows (all times are in UTC):
       time of last
      analysis field           time of last
      in simulation            fields in file
         yyyymmddHH            yyyymmddHH
MIT_phys_2009072512_2009072812_2009073000_03h.nc.gz
                    yyyymmddHH            HH
                   time of first        frequency with which
                   fields in file       fields are stored in file
|


