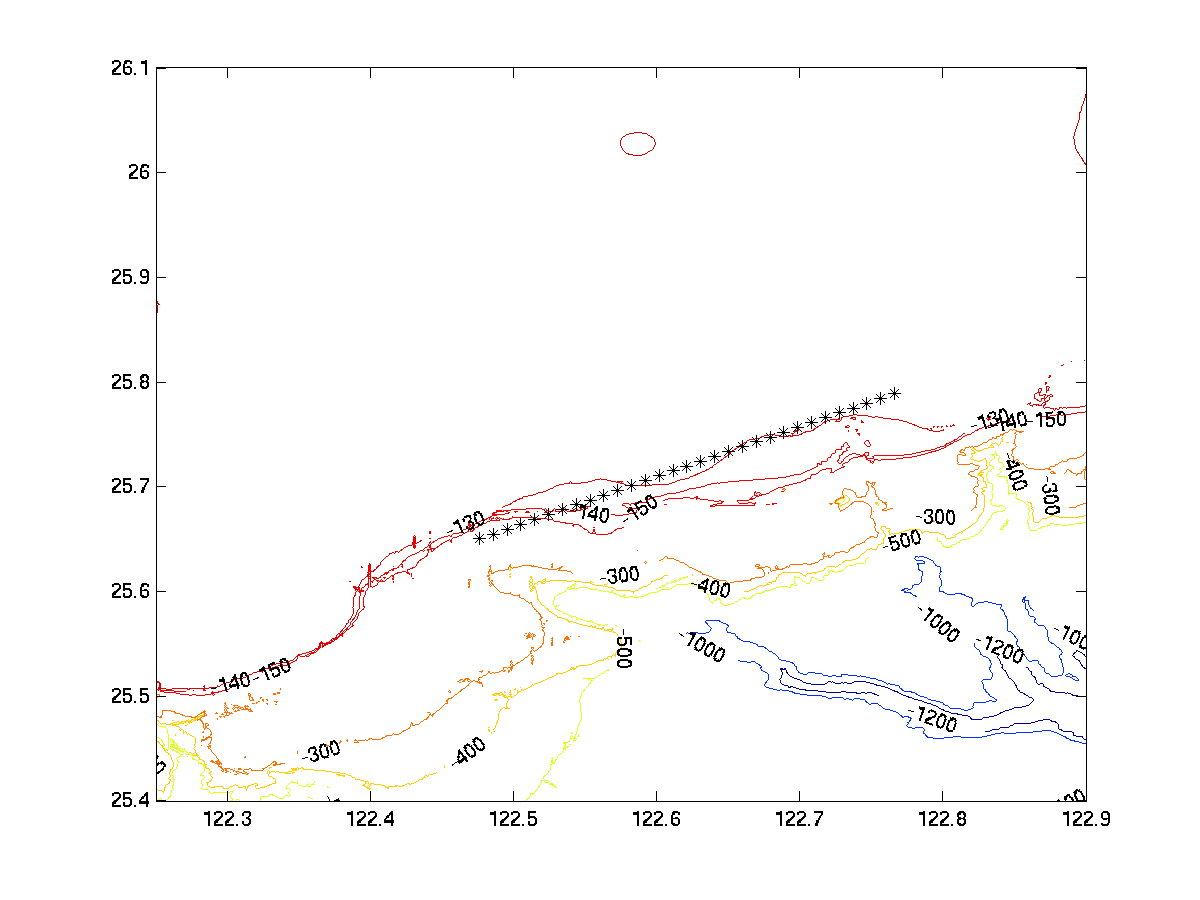
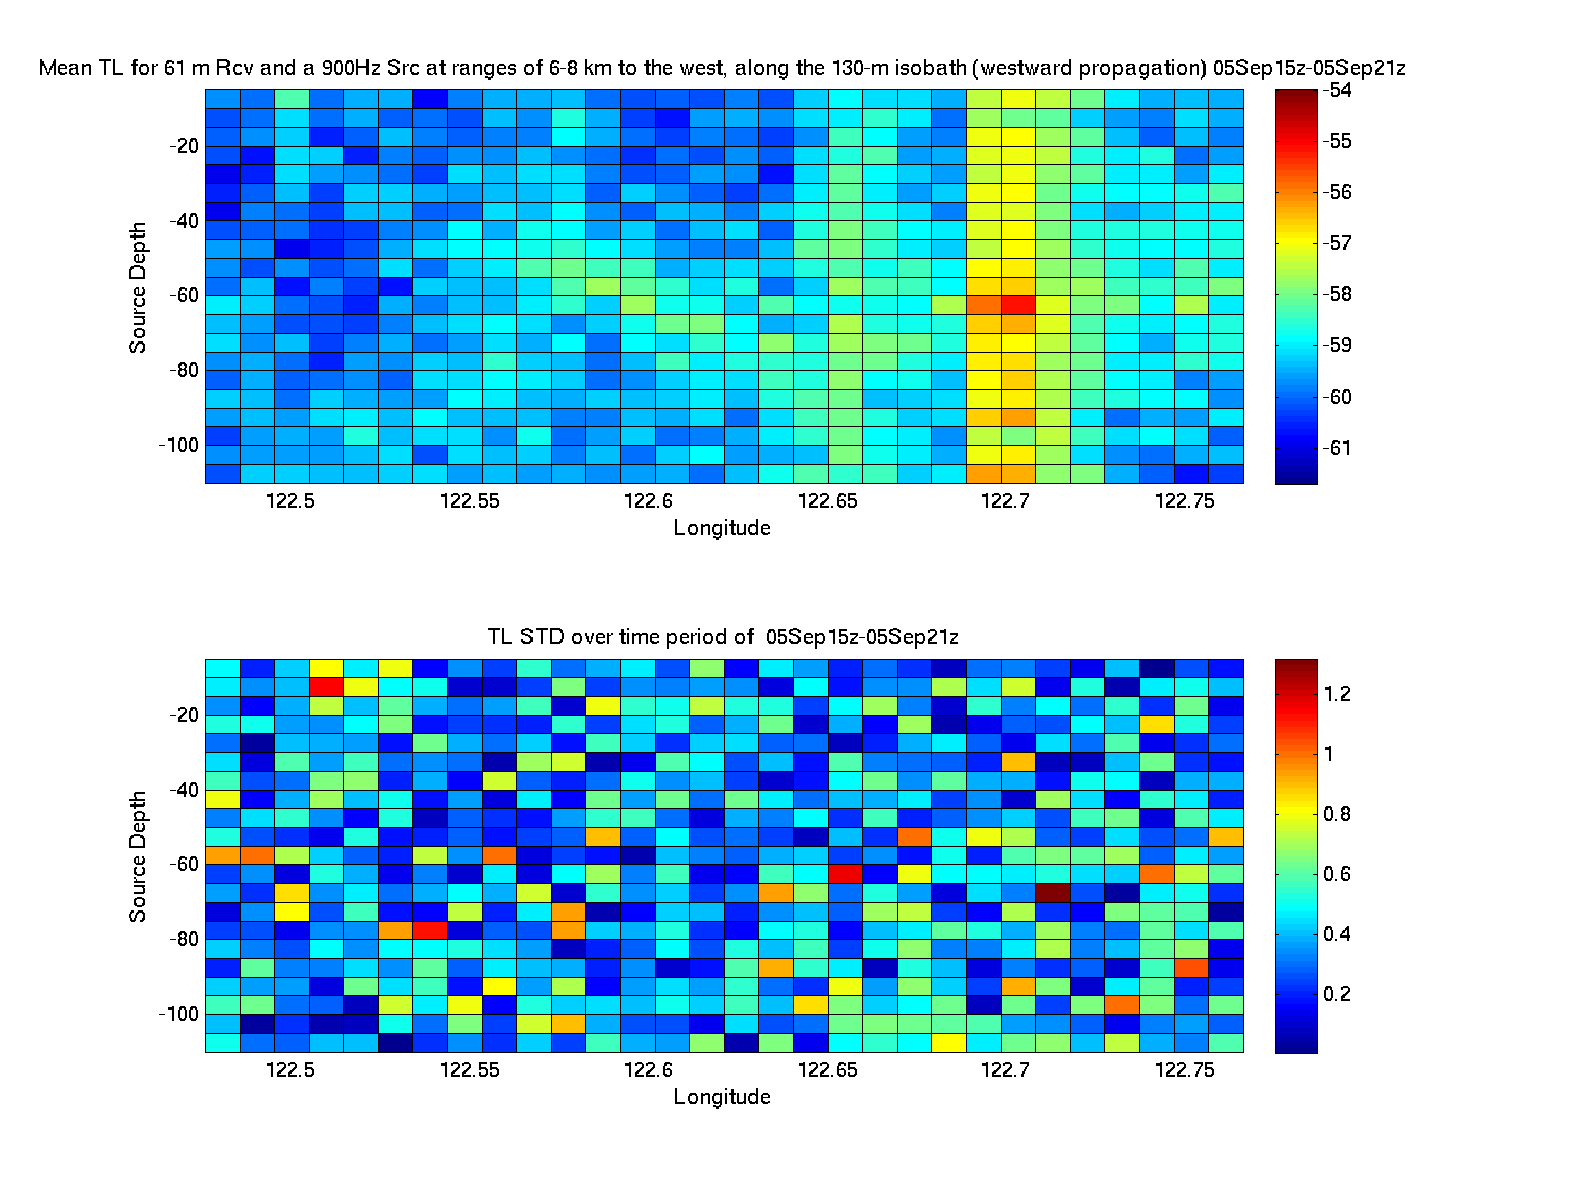
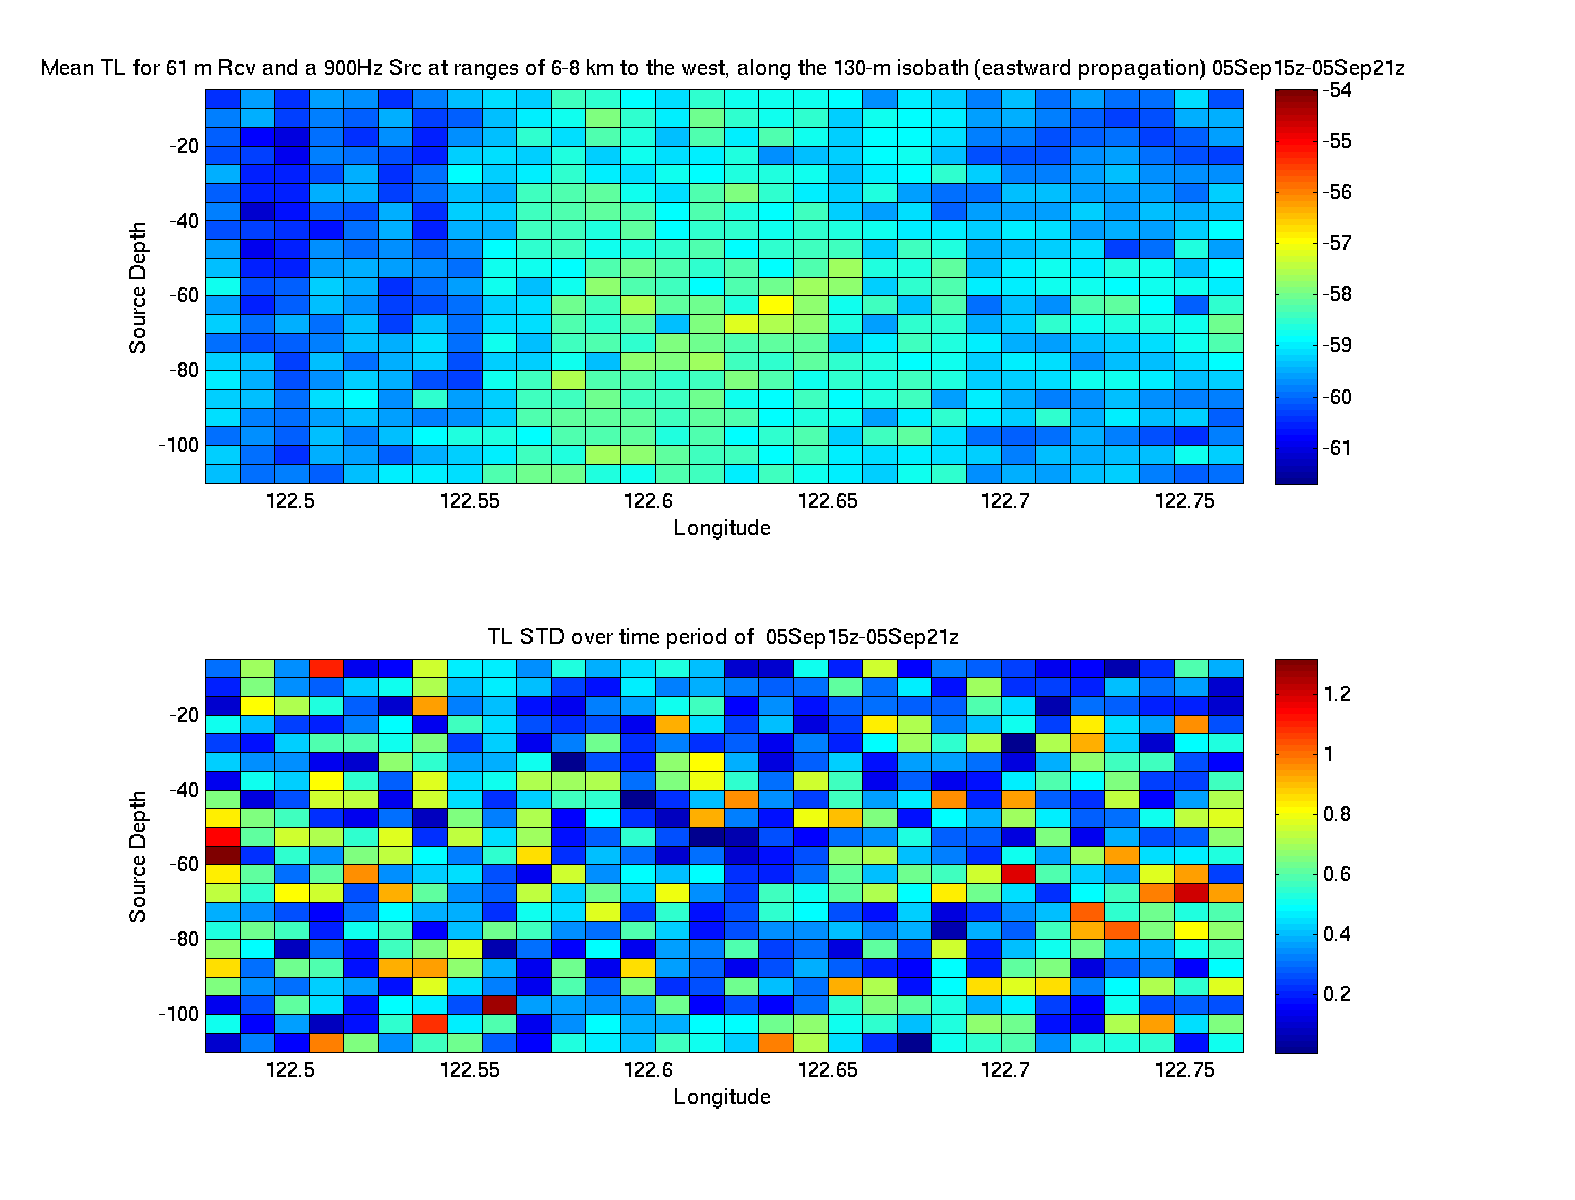
| 130m Location | Mean TL Over Time - Eastward Propagation | Mean TL Over Time - Westward Propagation |
 |
 |
 |
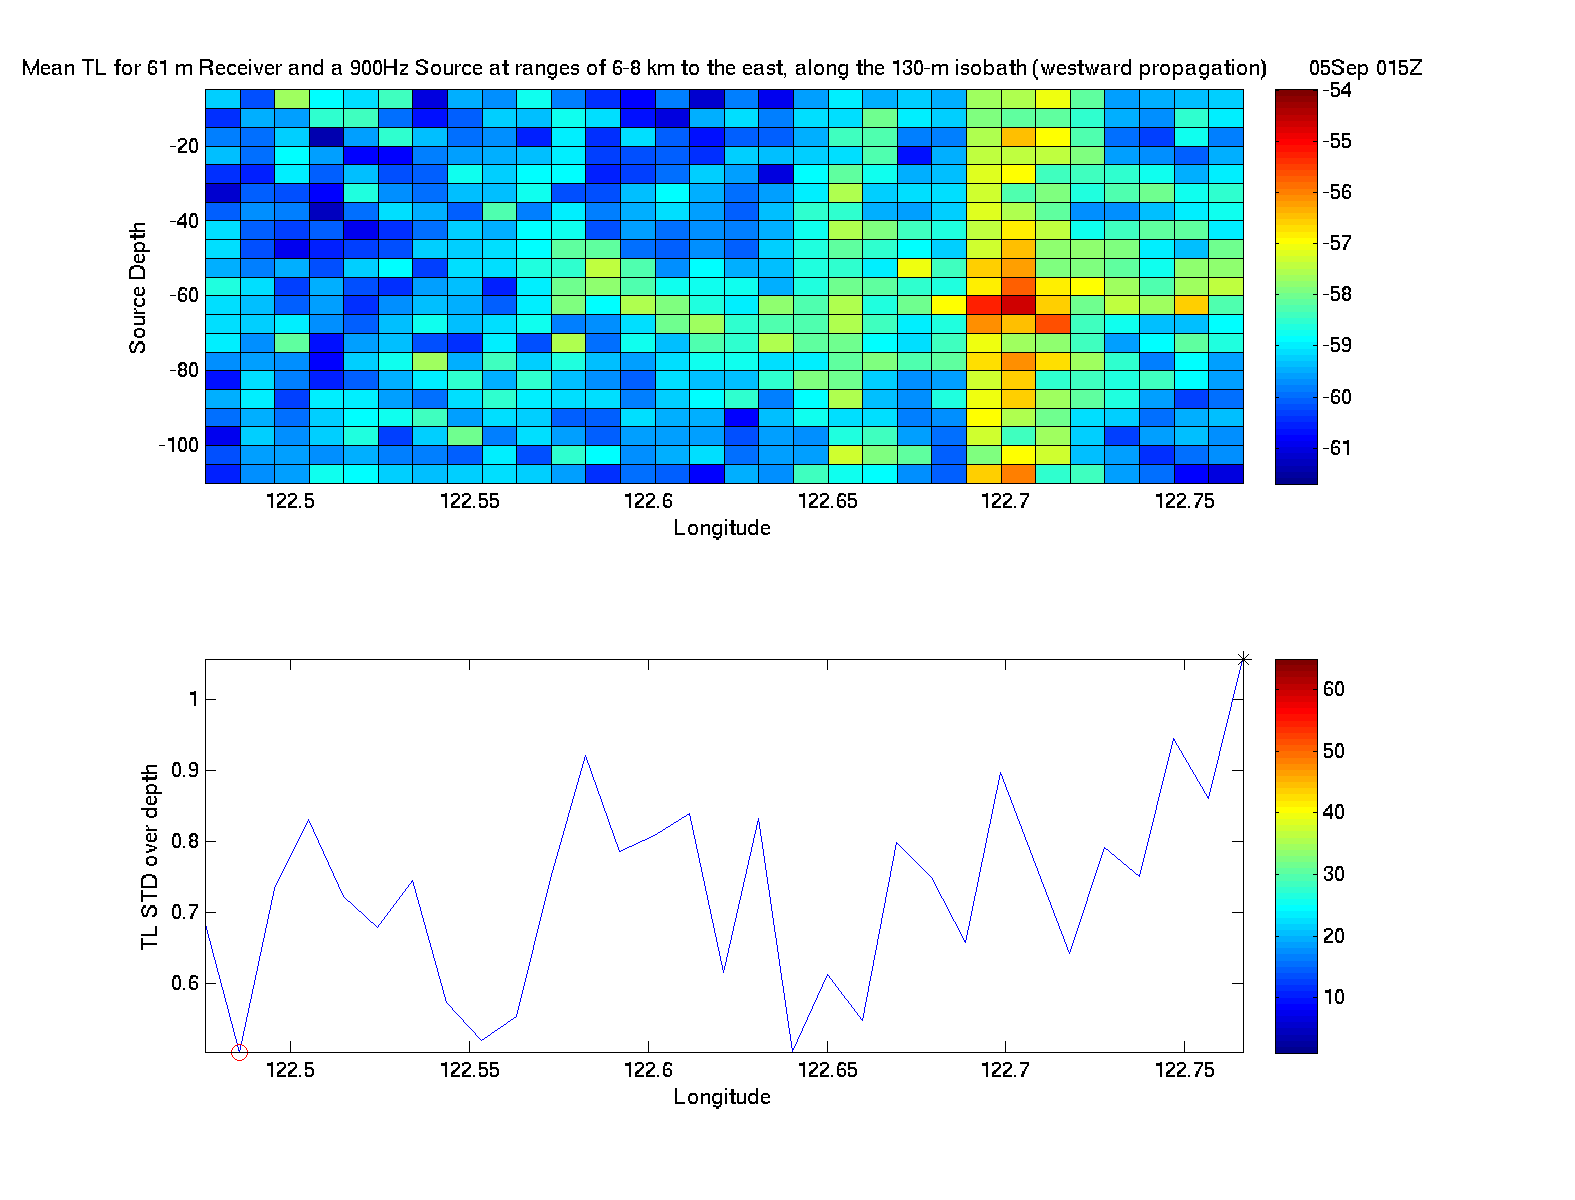
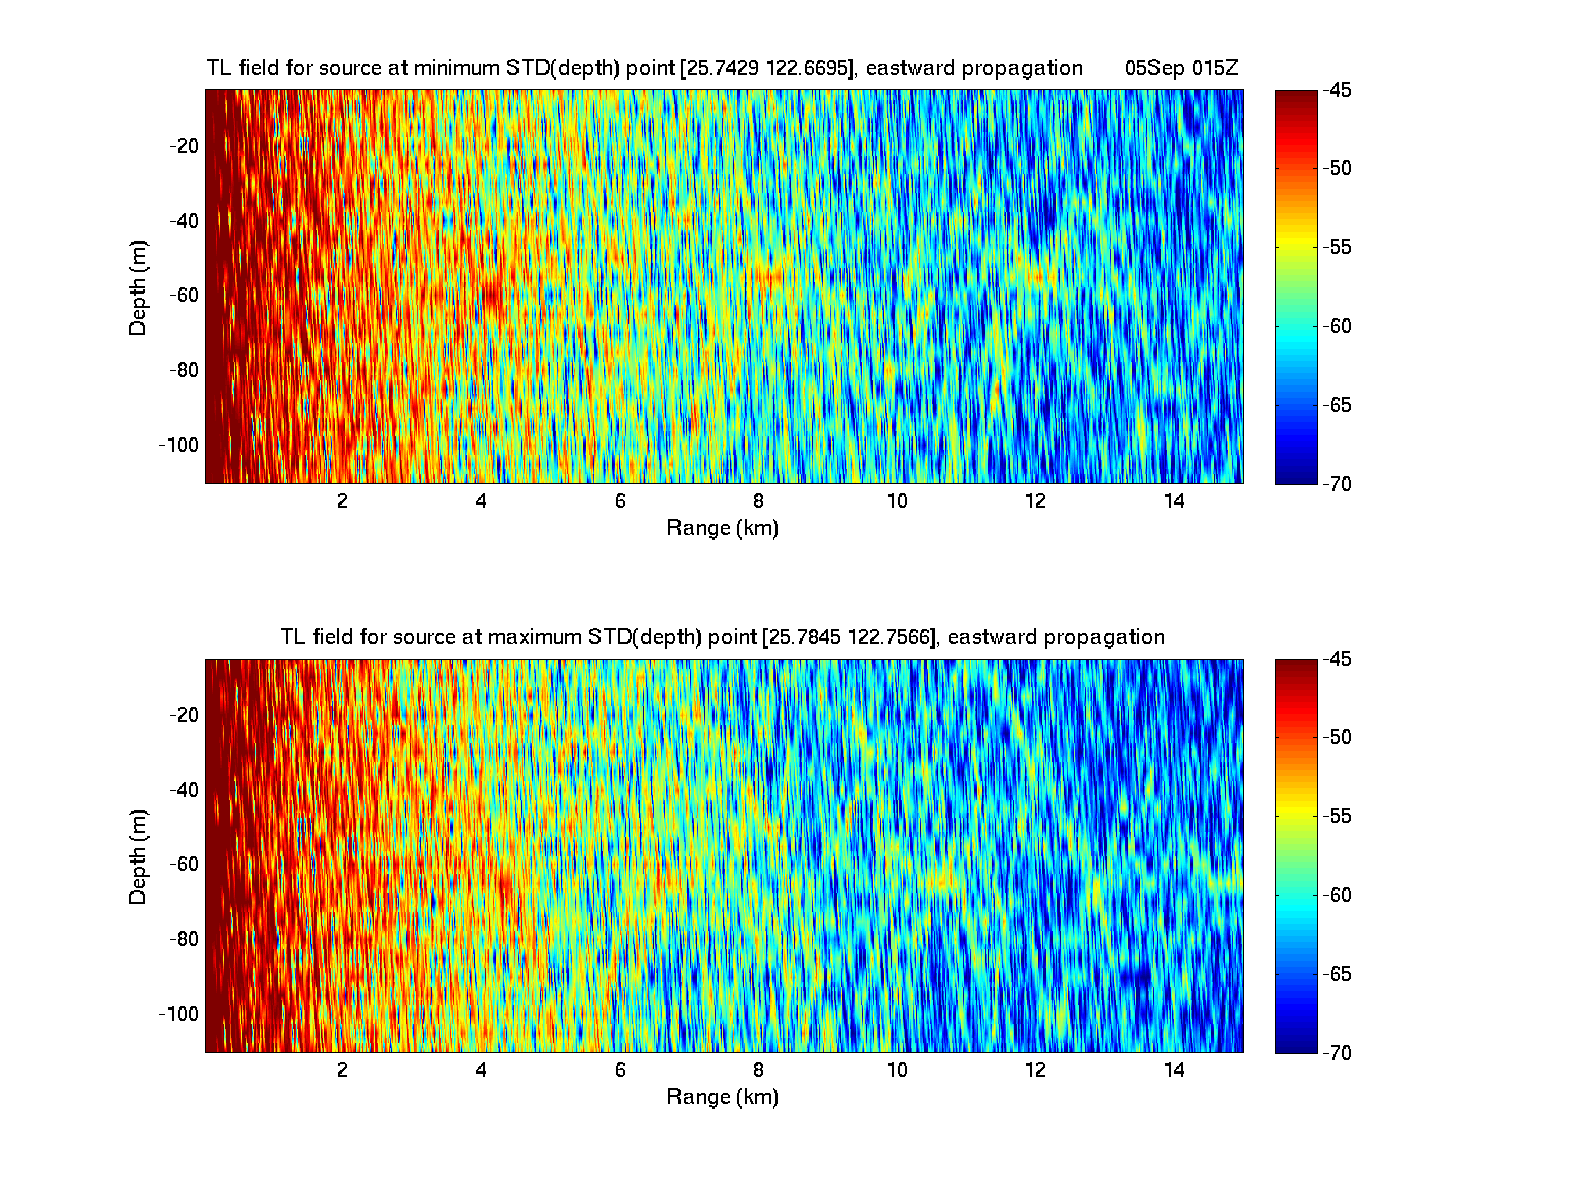
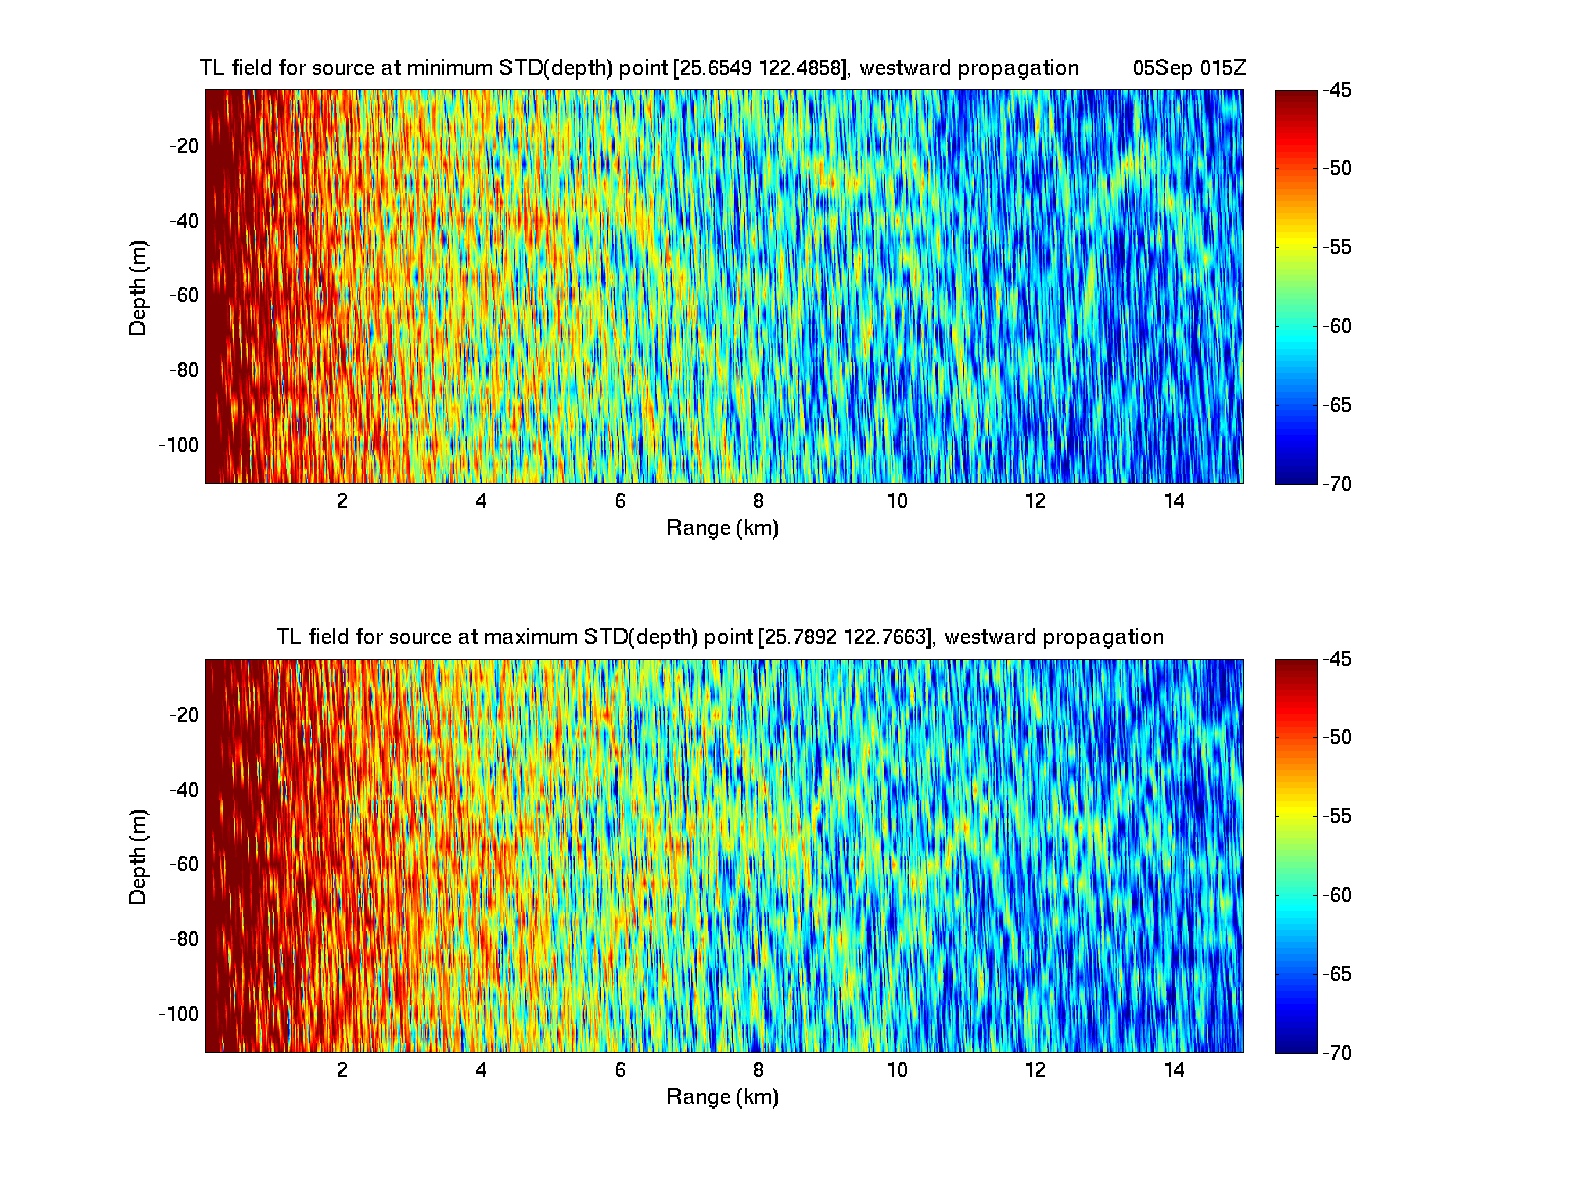
| TL Vertical Sections - 5 September - 1500Z | |||
|---|---|---|---|
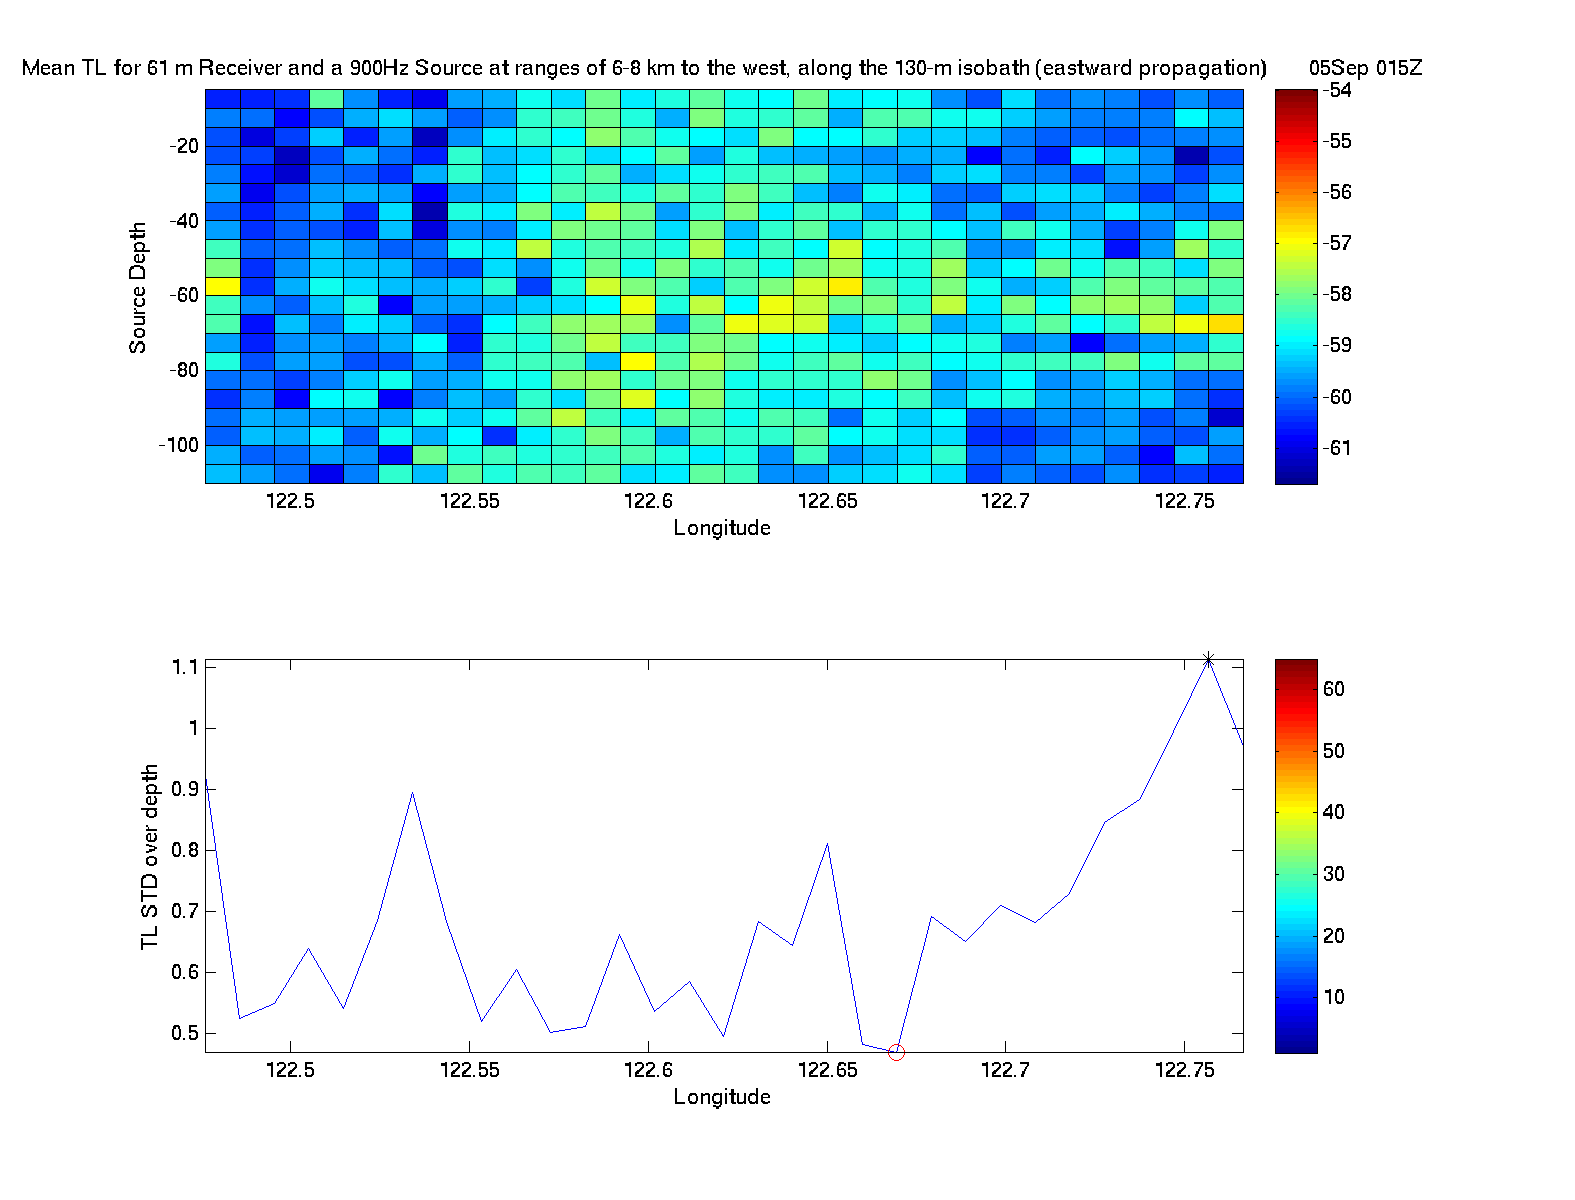
| Mean Eastward Propagation | Mean Westward Propagation | TL Field Eastward Propagation | TL Field Westward Propagation |
 |
 |
 |
 |
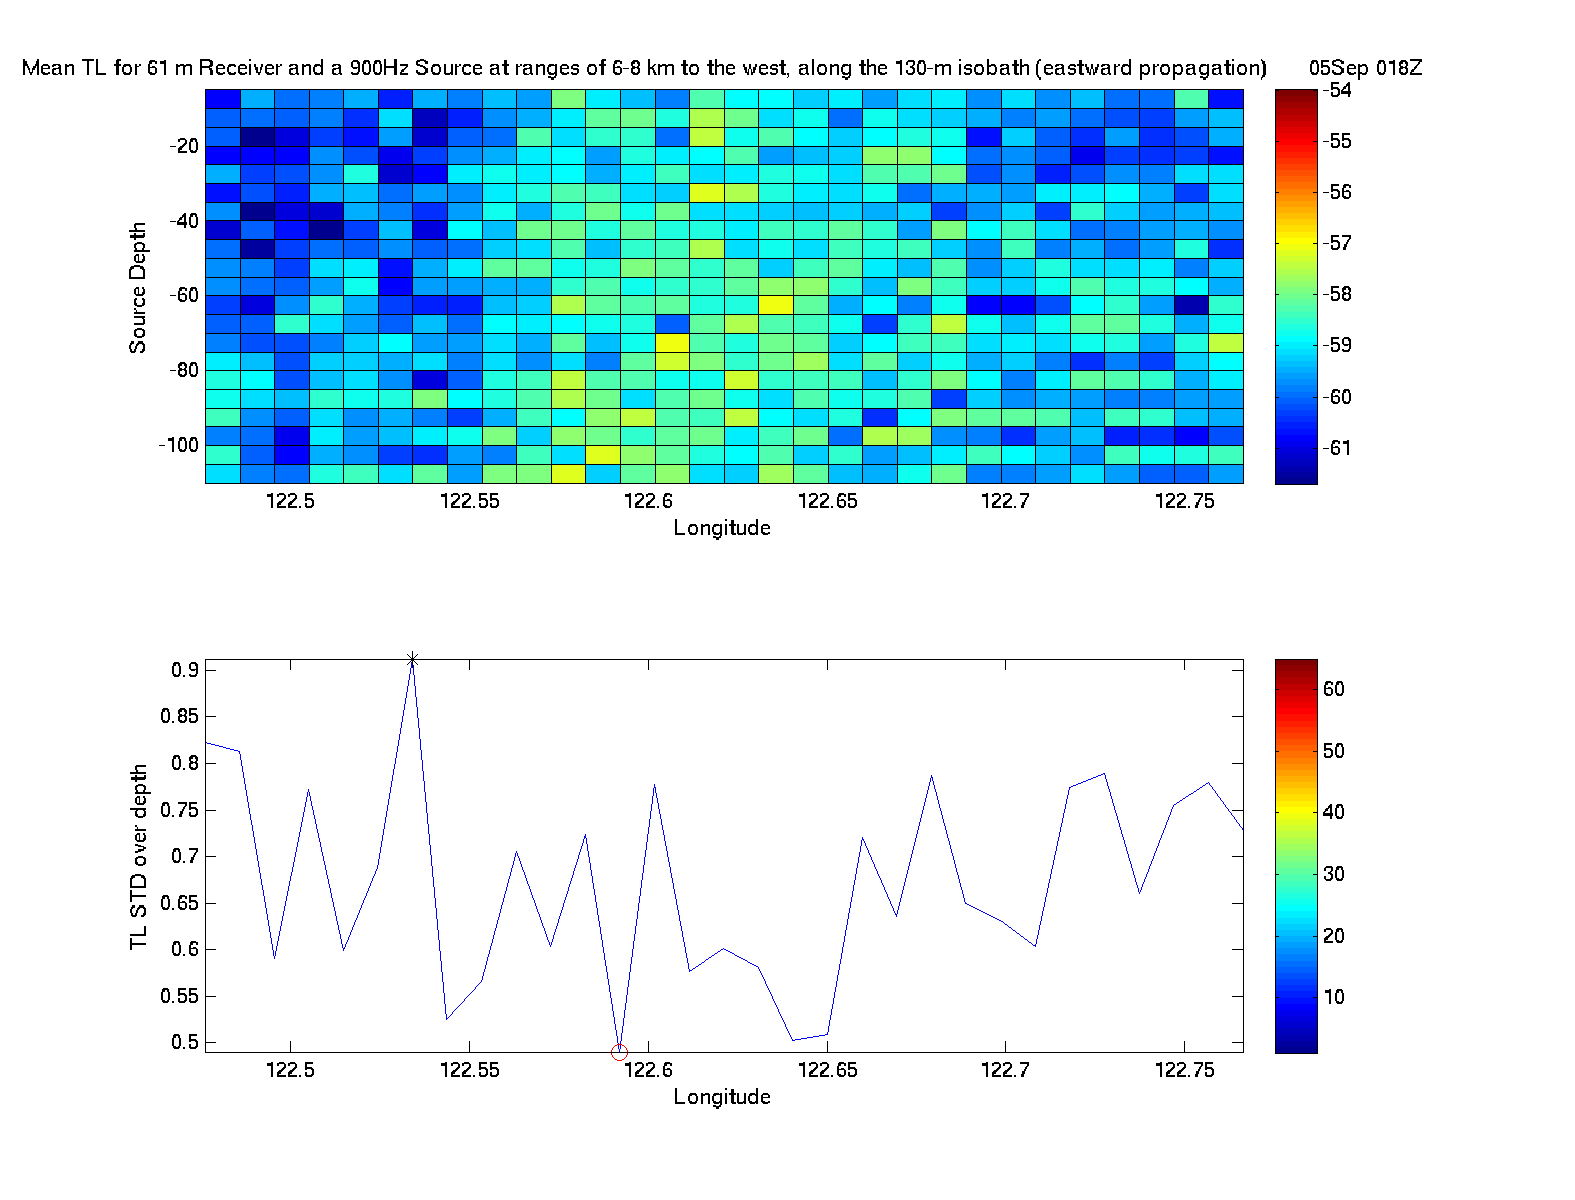
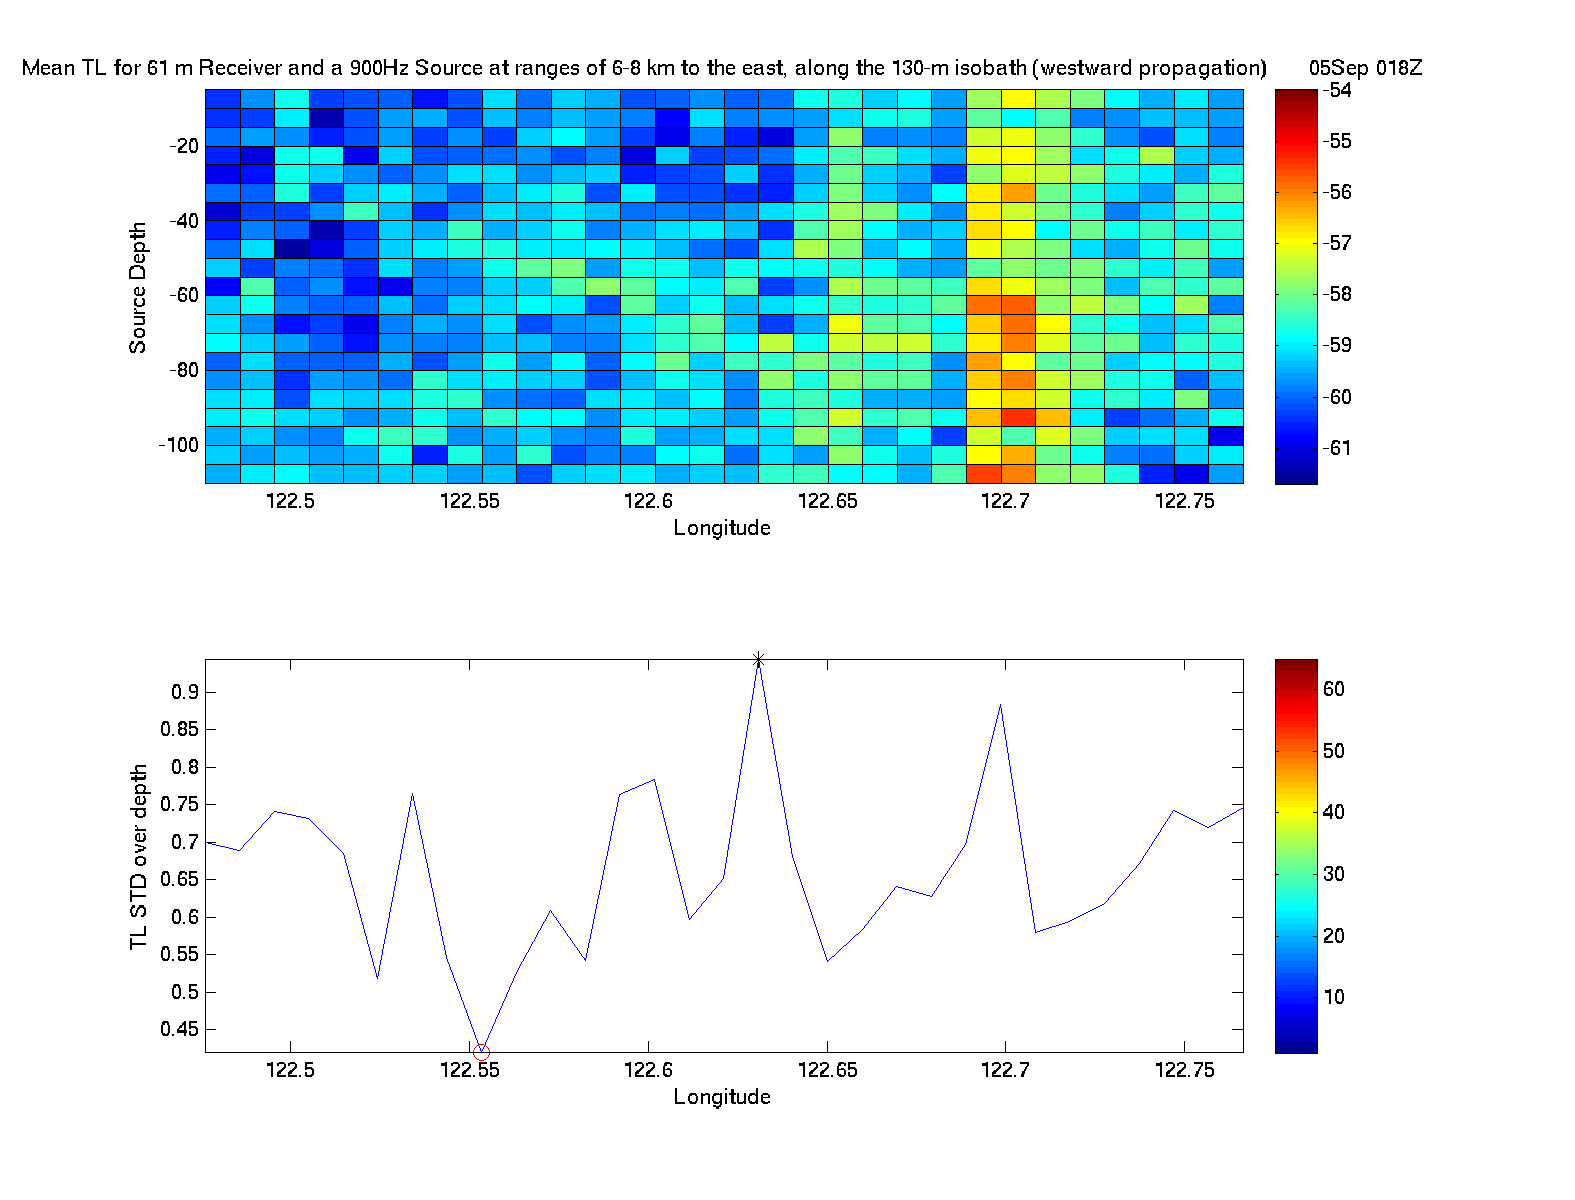
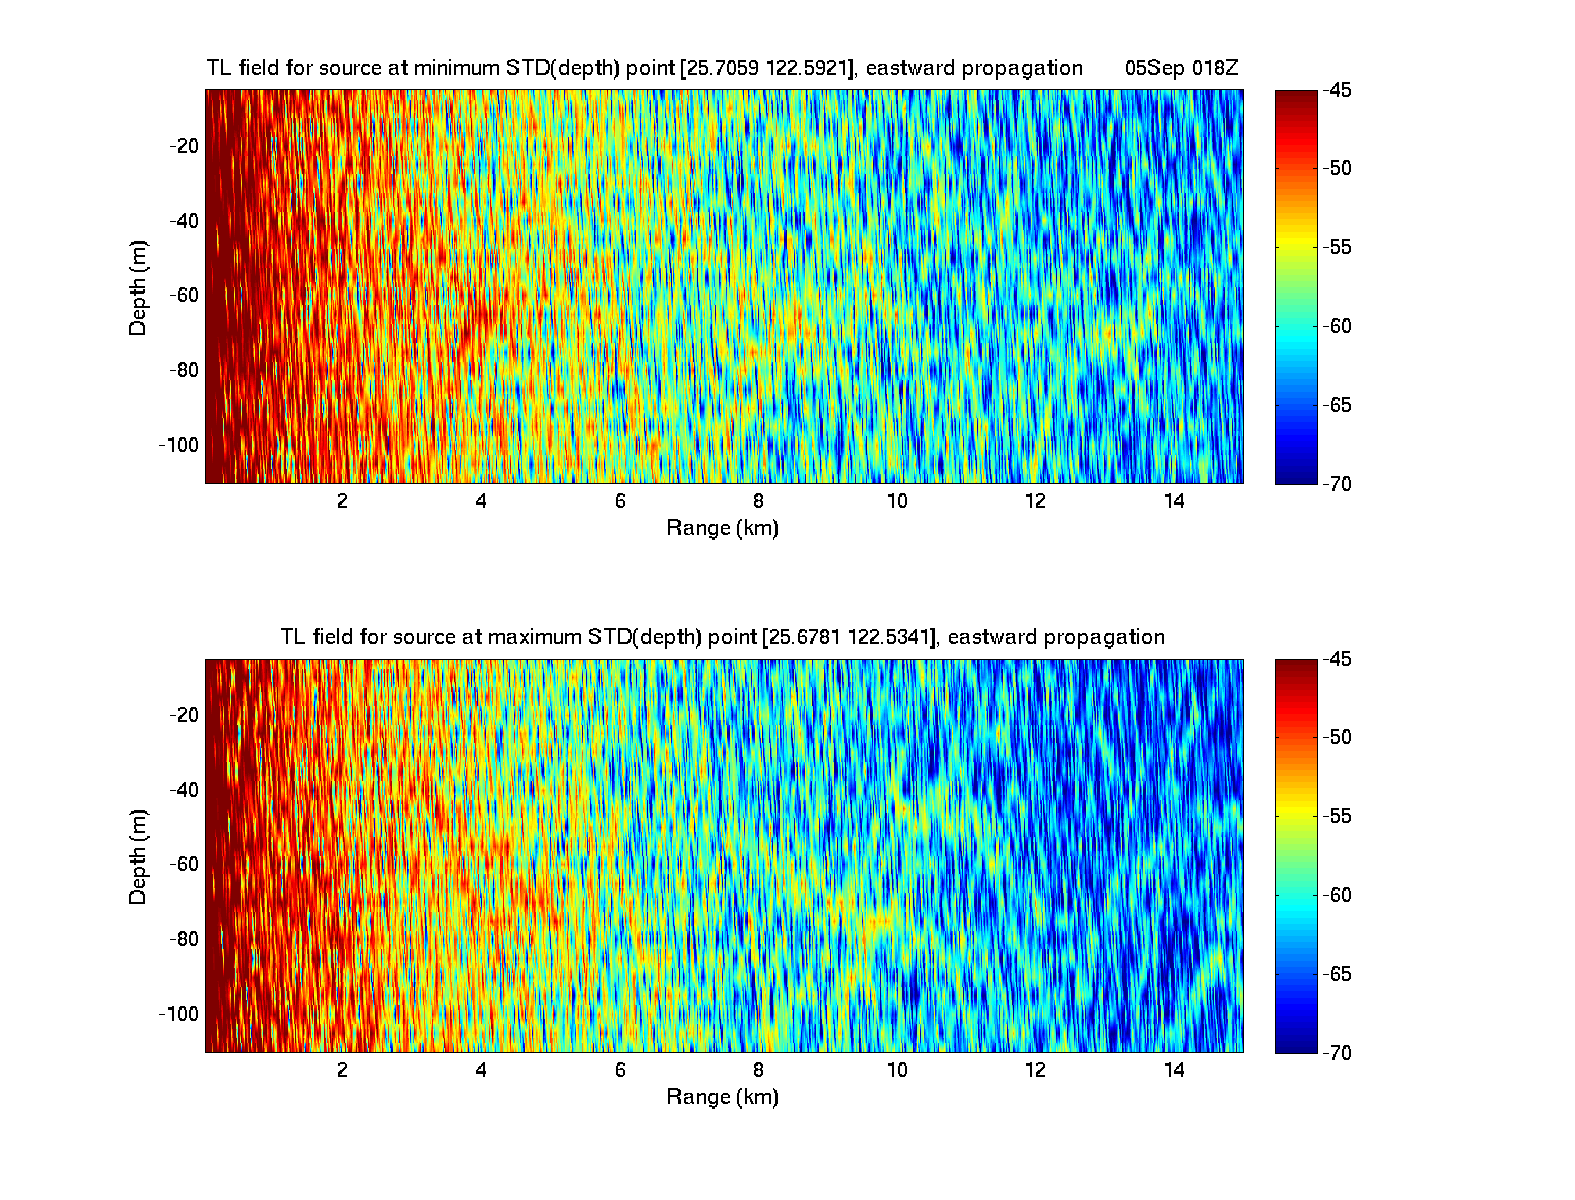
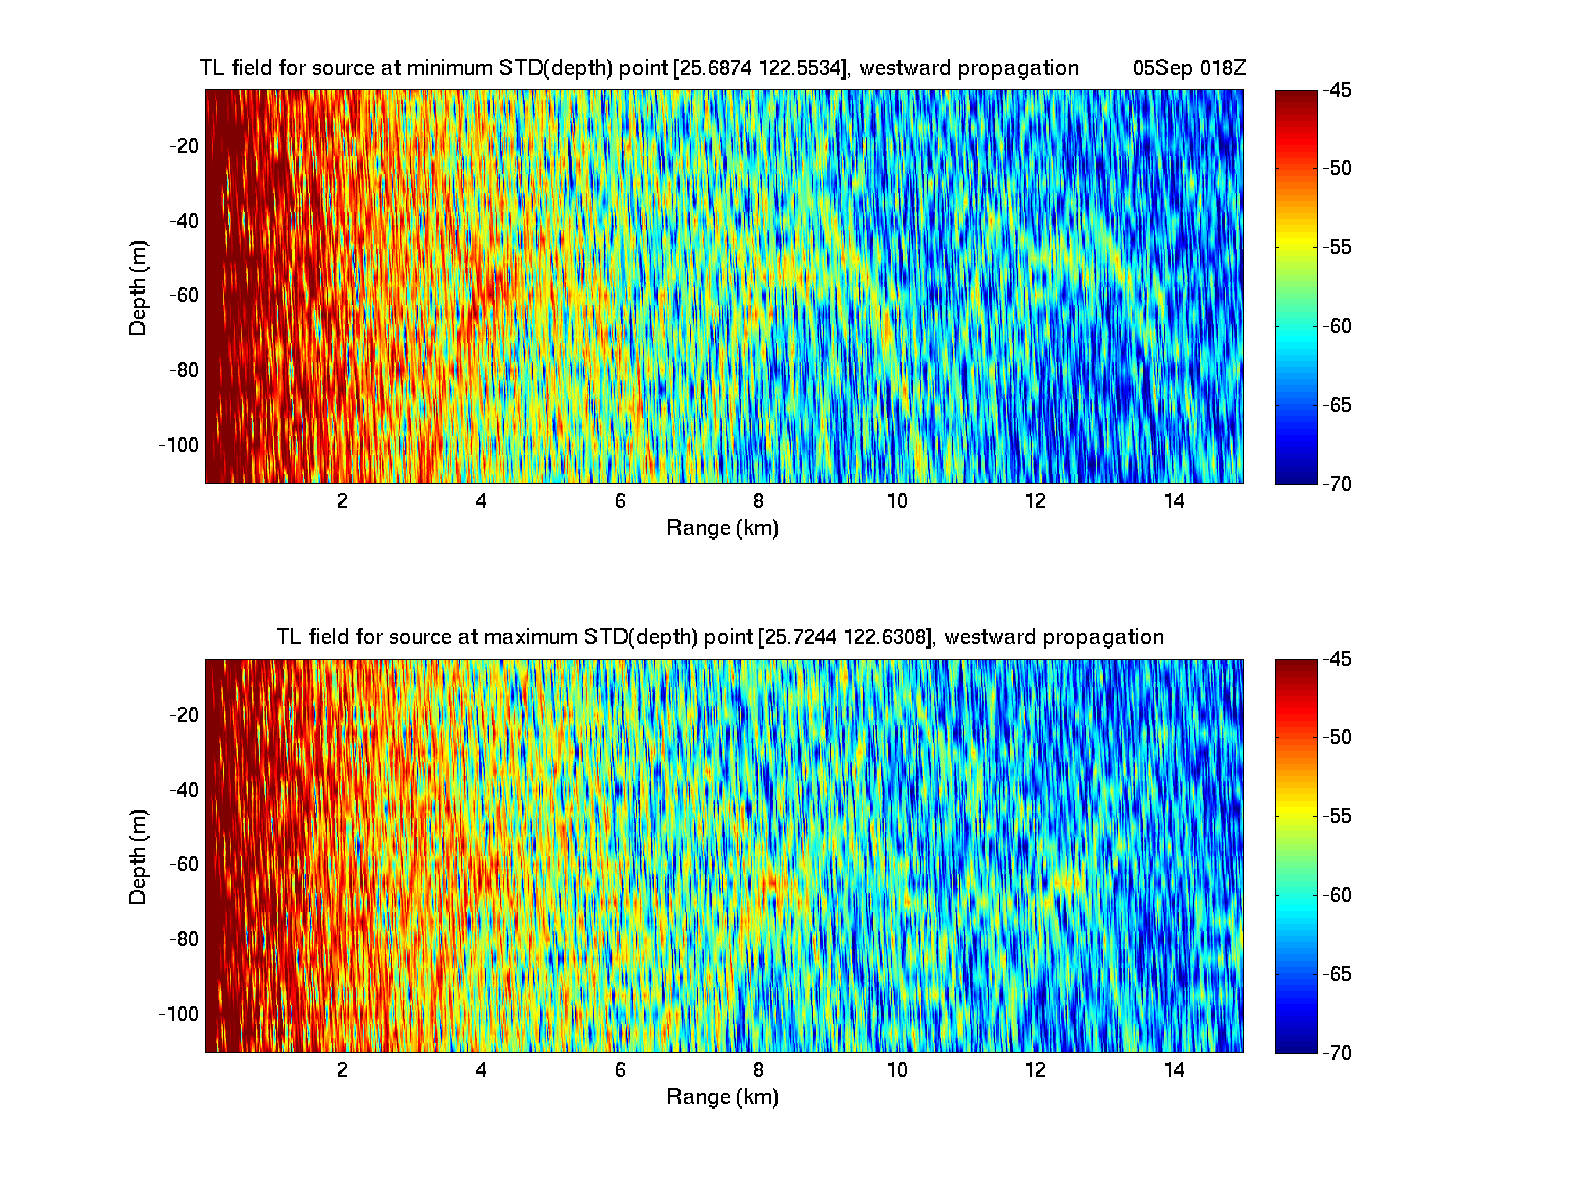
| TL Vertical Sections - 5 September - 1800Z | |||
|---|---|---|---|
| Mean Eastward Propagation | Mean Westward Propagation | TL Field Eastward Propagation | TL Field Westward Propagation |
 |
 |
 |
 |
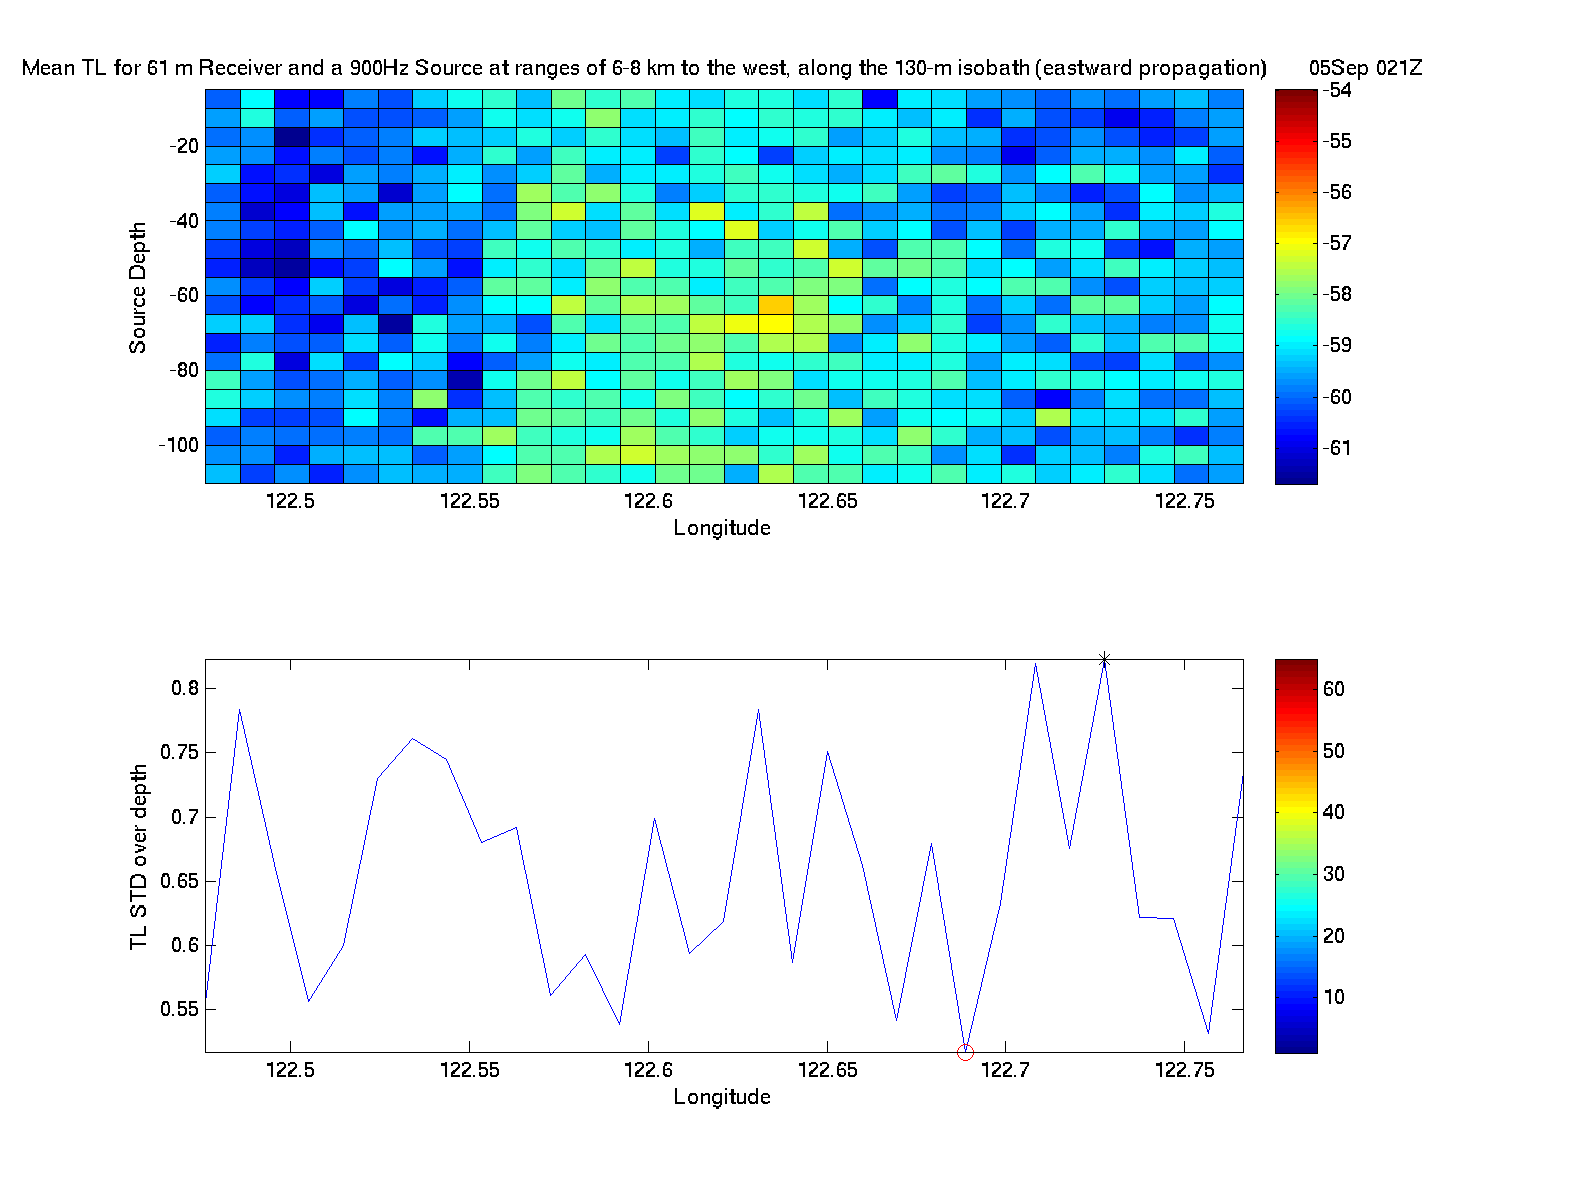
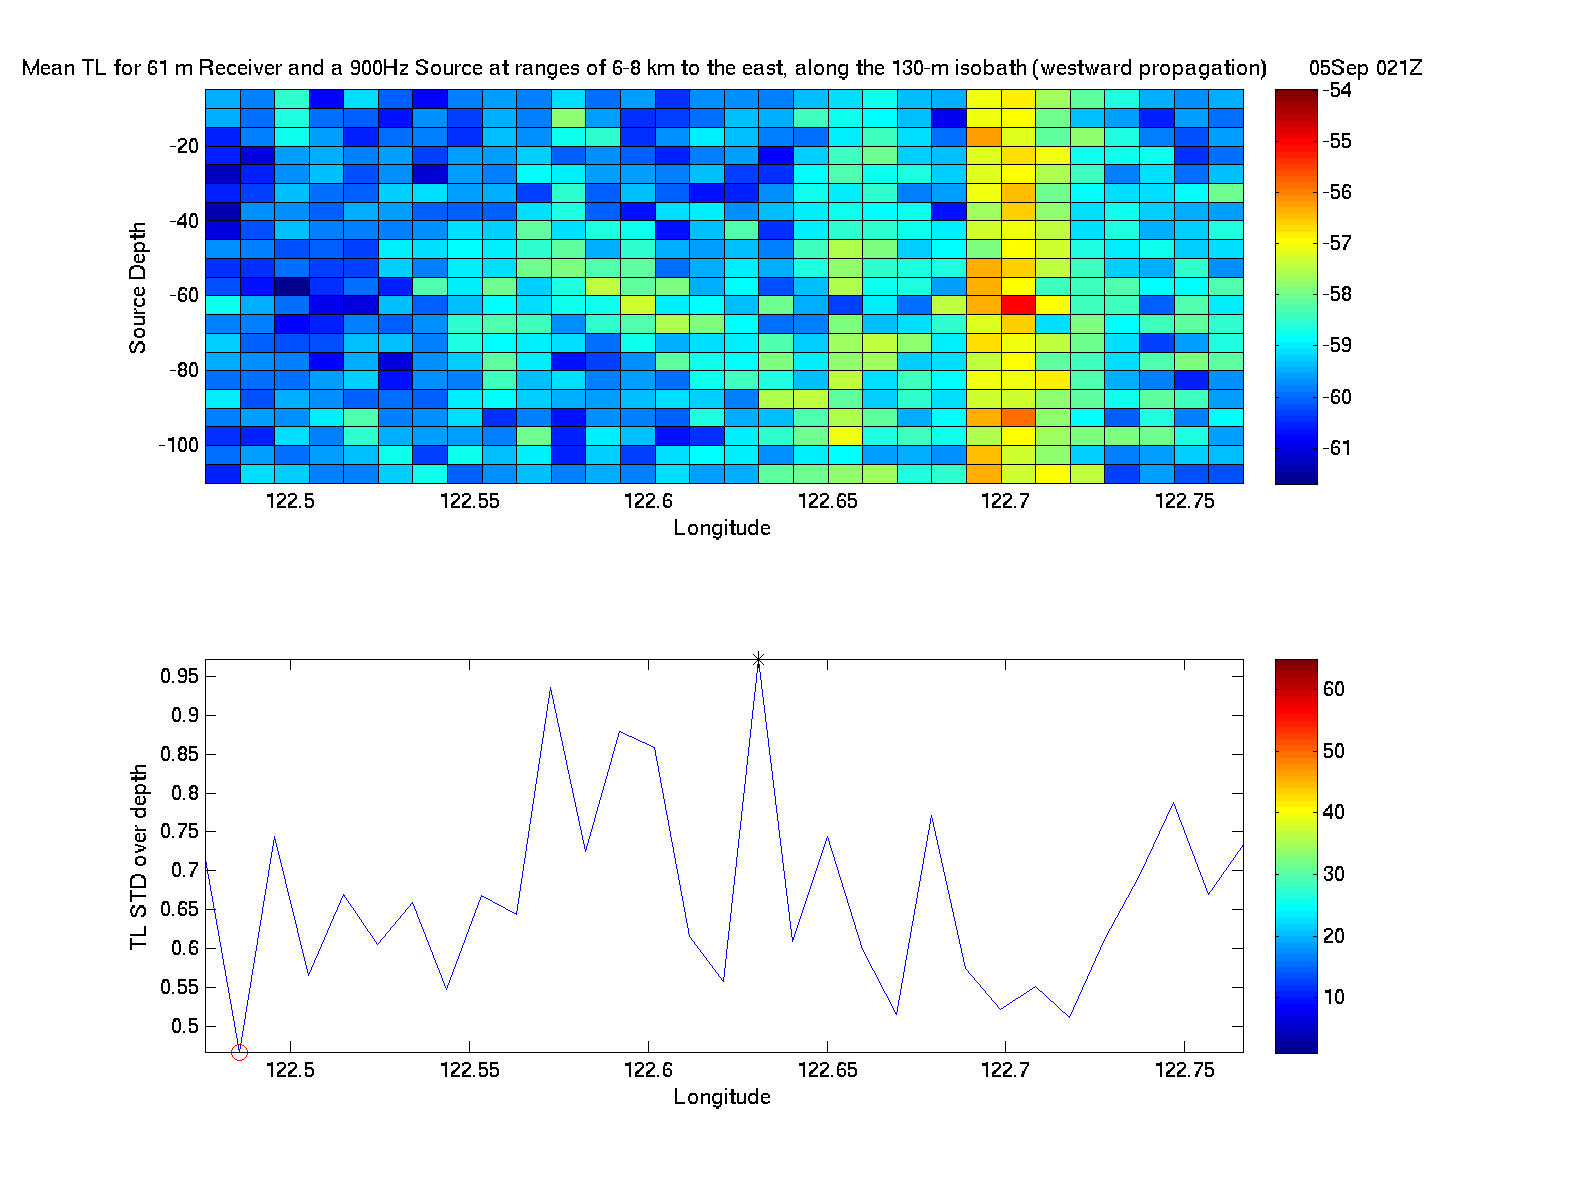
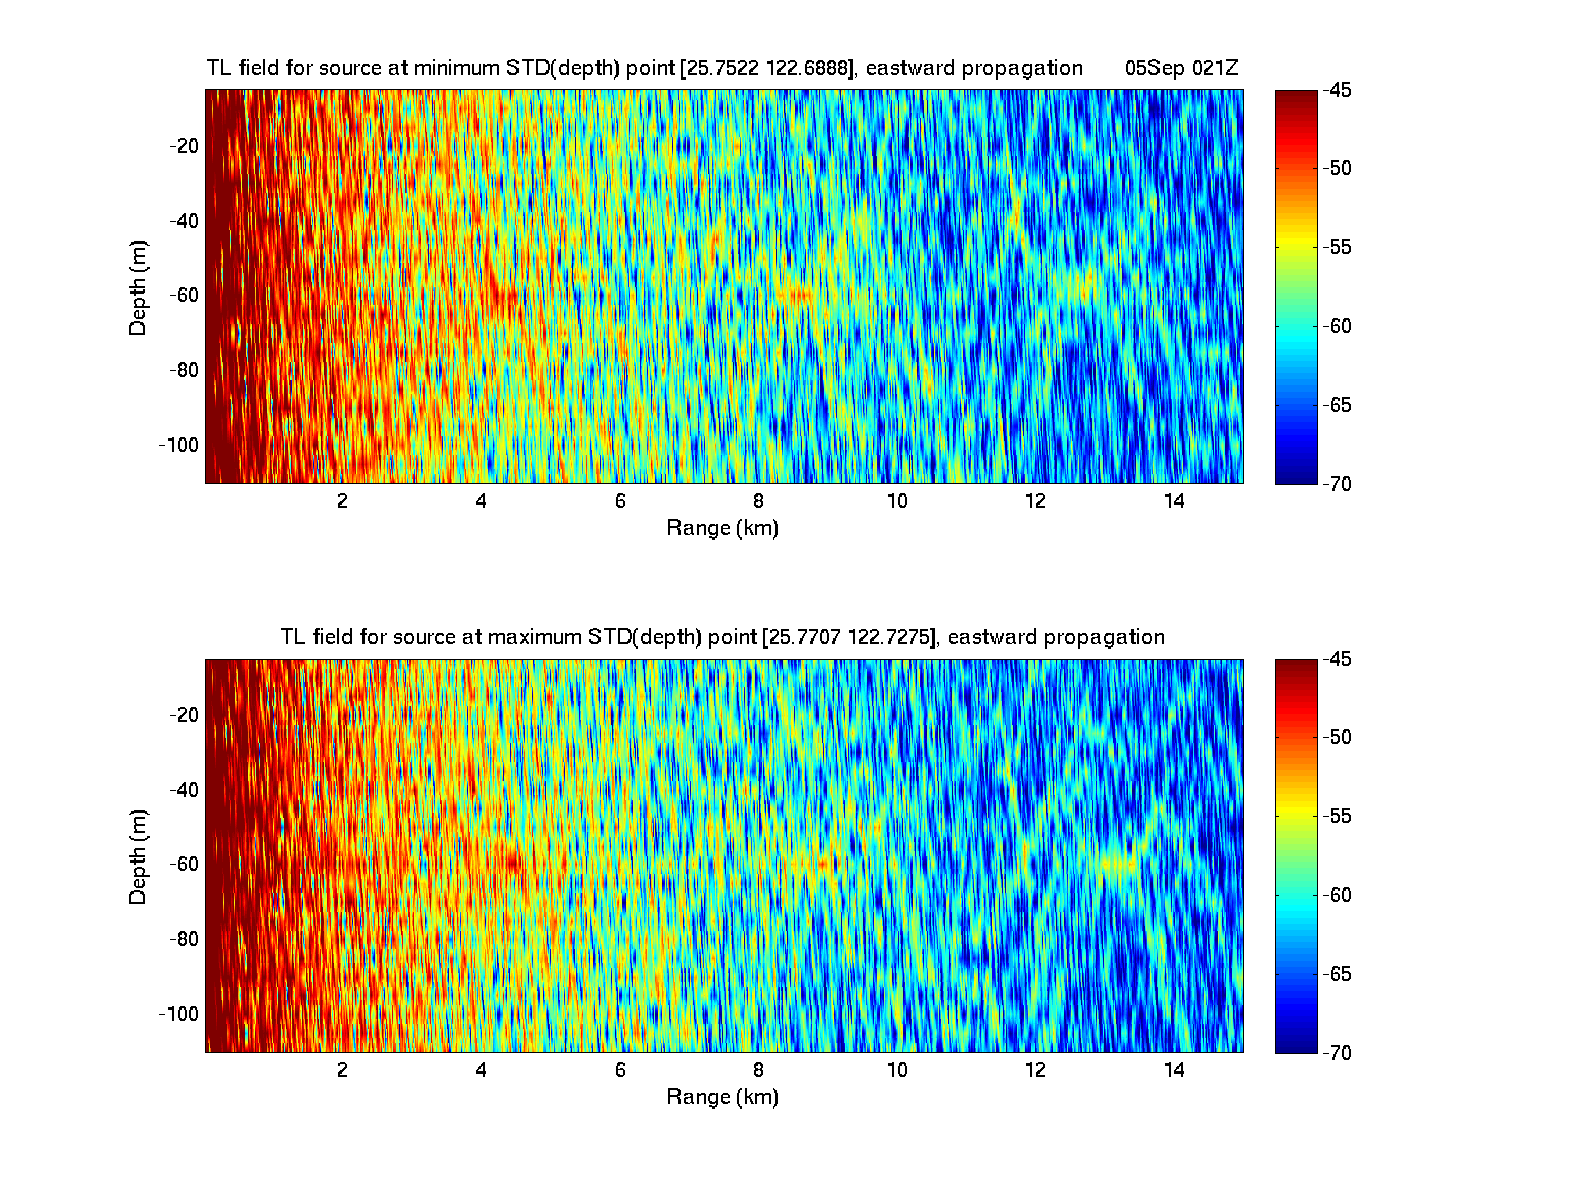
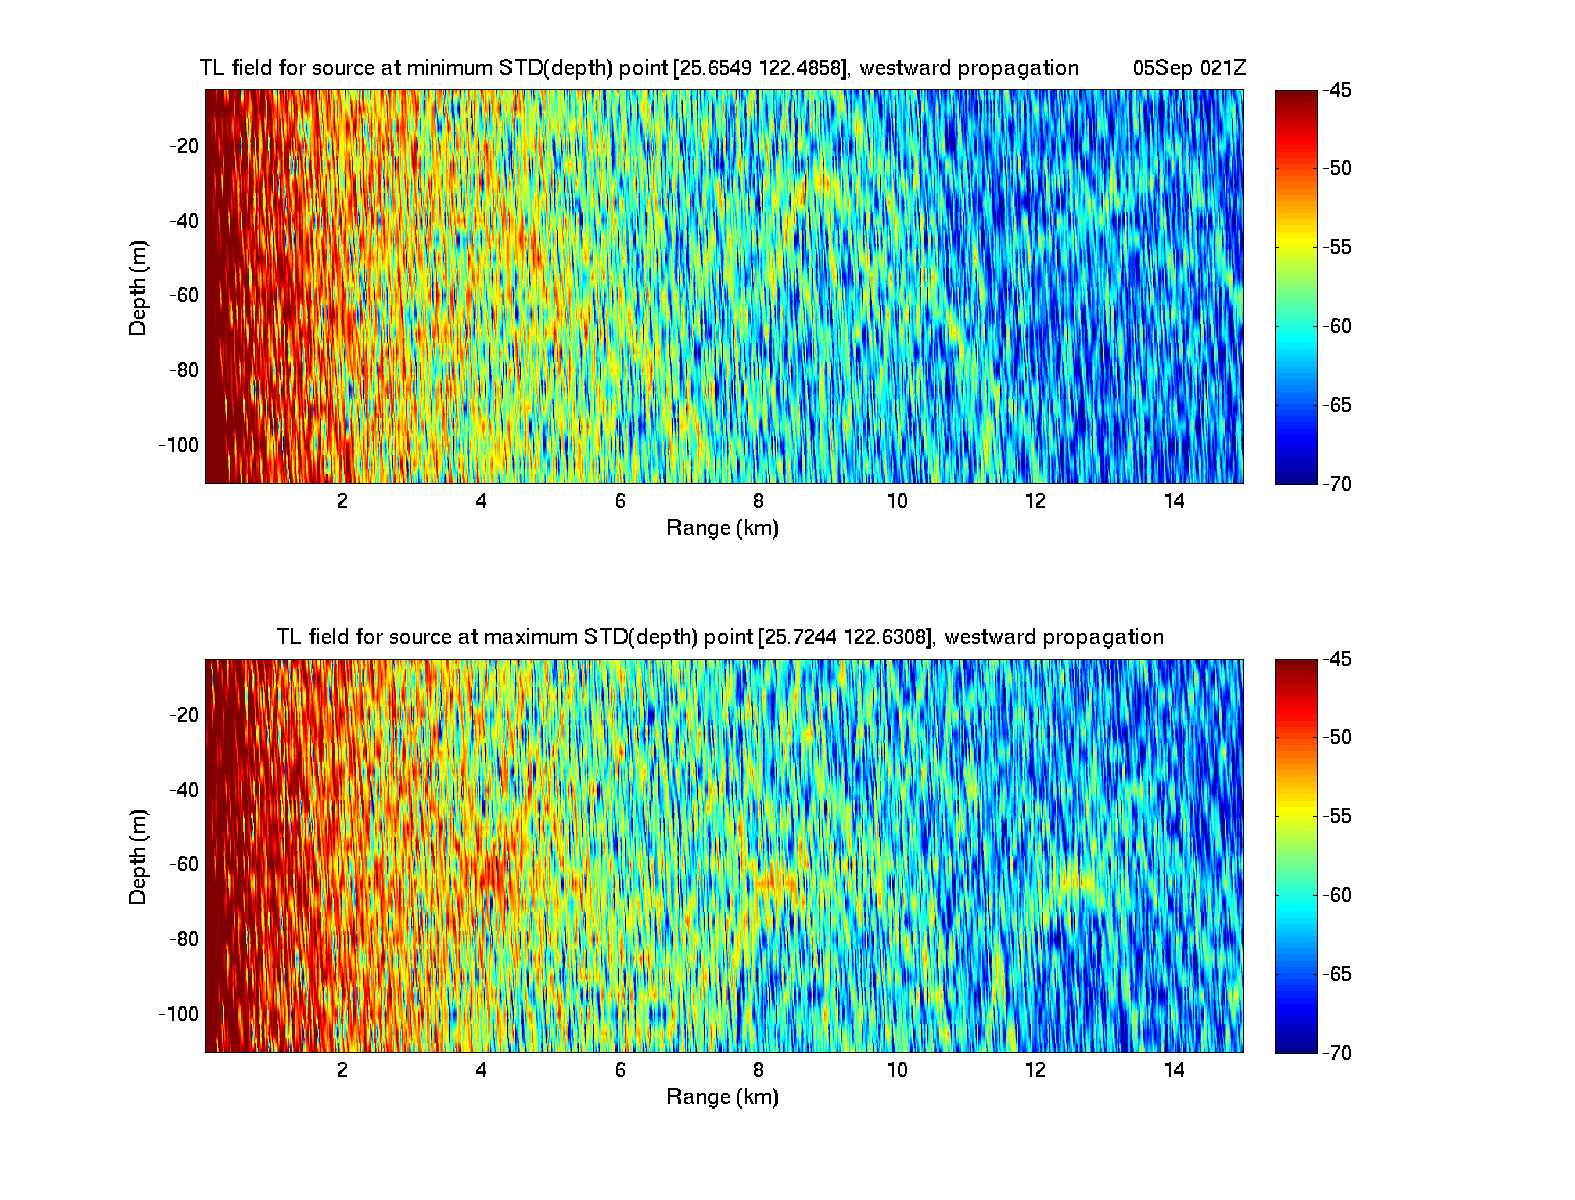
| TL Vertical Sections - 5 September - 2100Z | |||
|---|---|---|---|
| Mean Eastward Propagation | Mean Westward Propagation | TL Field Eastward Propagation | TL Field Westward Propagation |
 |
 |
 |
 |
| Fcst. for 5 Sep. 15Z | ||||
|---|---|---|---|---|
| Acoustic Climate Maps for a TL drop to 60±5 db | ||||
| TL(xs,ys,ts) (TL (db) for source at 900Hz, 60m averaged over all bearings, 6-8km ranges and 51-71m depths) |
Expected Range (km) at fixed time ts for source at (xs,ys) (Mean Range on 05Sep 15Z at which TL drops to 60±5 db averaged over all bearings and 51-71m depths, for source at 900Hz, 60m) |
Expected Range (km) in cross-slope direction at fixed time
ts for source at (xs,ys) (Mean Range on 05Sep 15Z at which TL in cross-slope direction drops to 60±5 db averaged over 51-71m depths, for source at 900Hz, 60m) |
Expected Range (km) in along-slope direction at fixed time ts
for source at (xs,ys) (Mean Range on 05Sep 15Z at which TL in along-slope direction drops to 60±5 db averaged over 51-71m depths, for source at 900Hz, 60m) |
Expected Range (km) at fixed time ts for source at (xs,ys)
and receiver at 27m depth (Mean Range on 05Sep 15Z at which TL drops to 60±5 db for receiver at 27m depth, averaged over all bearings, for source at 900Hz, 60m) |

|
|
|
|
|
| Std Dev in Depth of TL | Std Dev in Depth of Expected Range |
Std Dev in Depth of Expected X-Slope Range |
Std Dev in Depth of Expected Along-Slope Range |
Std Dev in Bearing of Expected Range for 27m Receiver |
|
|
|
|
|
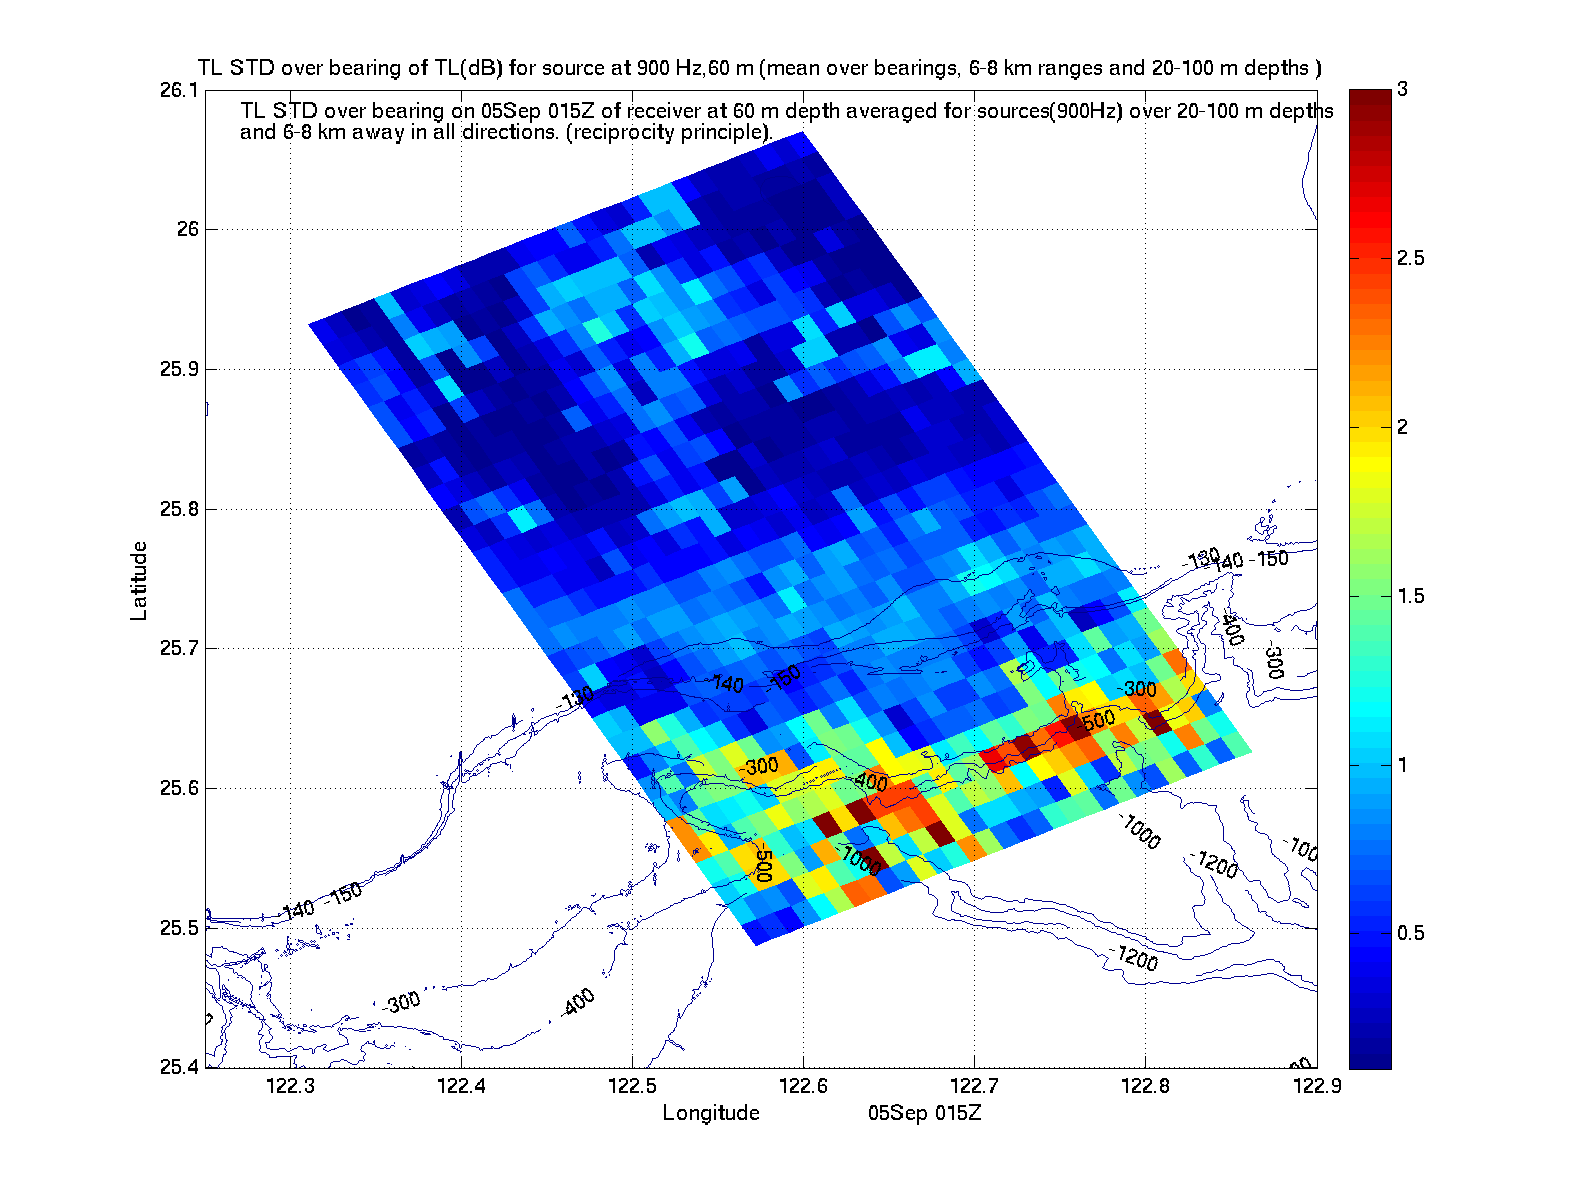
| Std Dev in Bearing of TL | Std Dev in Bearing of Expected Range |
|||
|
|
|||
| Fcst. for 5 Sep. 18Z | ||||
|---|---|---|---|---|
| Acoustic Climate Maps for a TL drop to 60±5 db | ||||
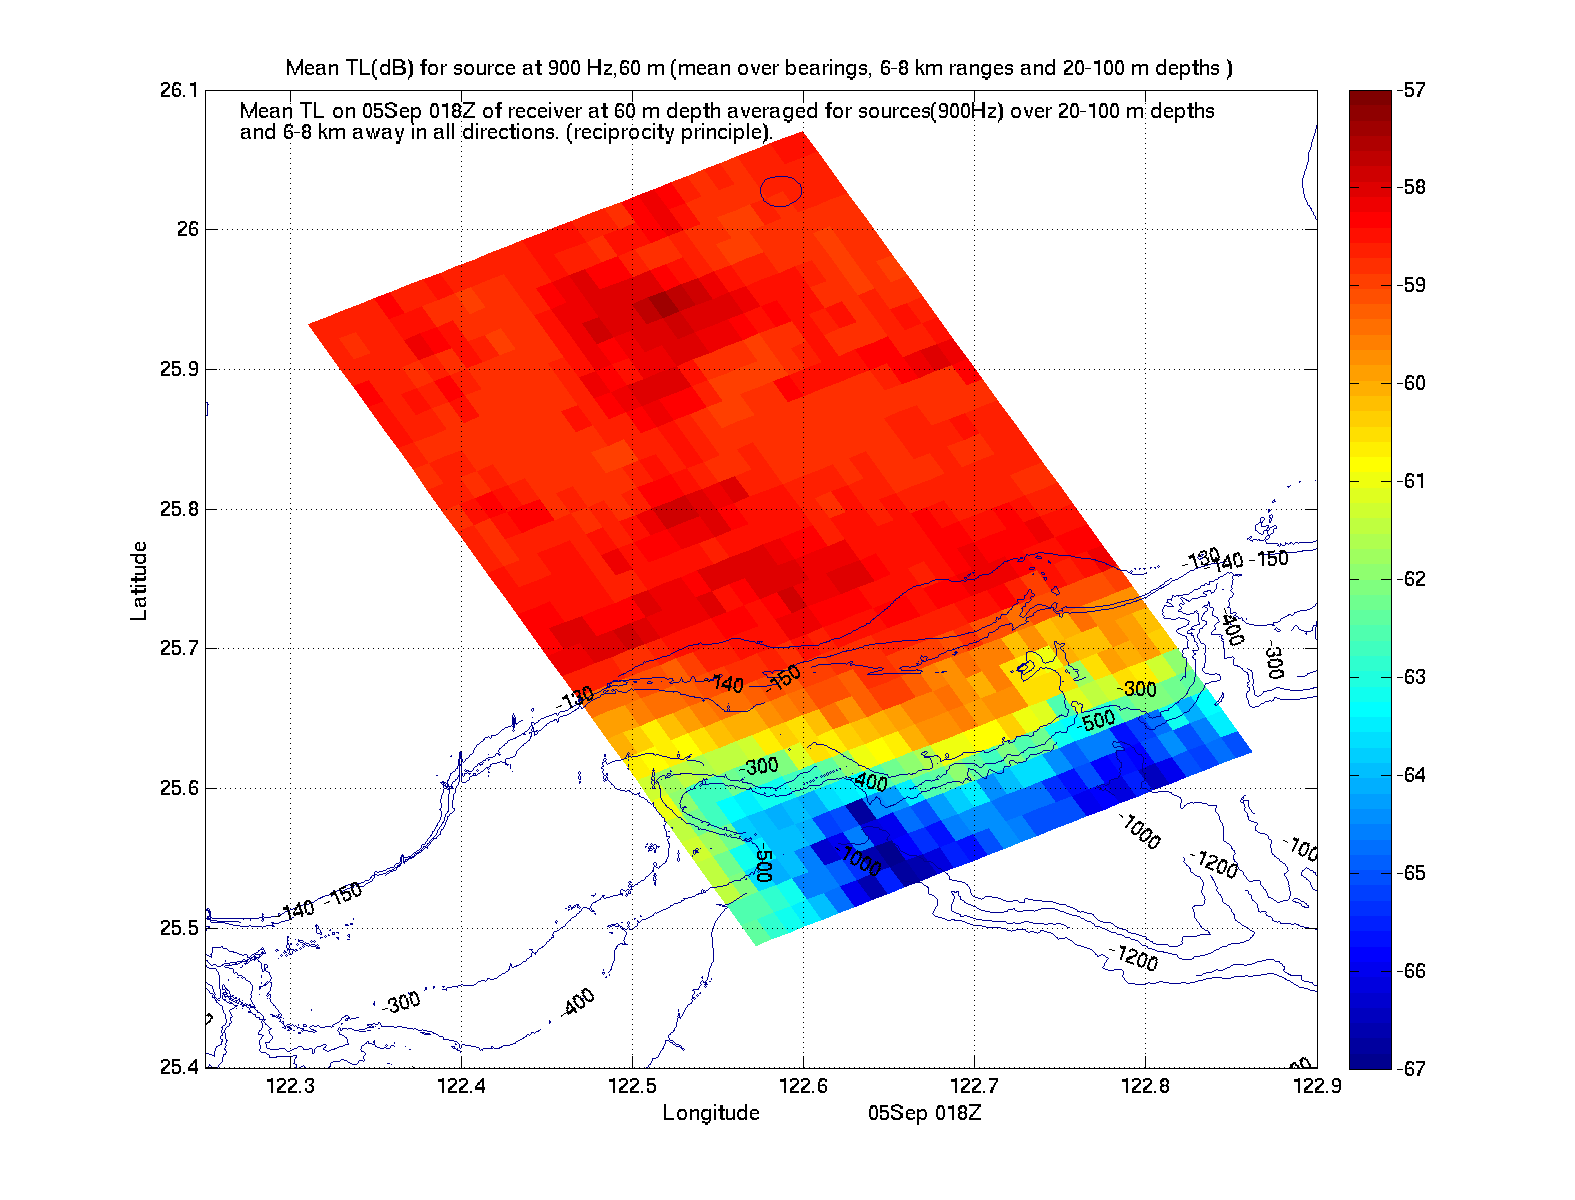
| TL(xs,ys,ts) (TL (db) for source at 900Hz, 60m averaged over all bearings, 6-8km ranges and 51-71m depths) |
Expected Range (km) at fixed time ts for source at (xs,ys) (Mean Range on 05Sep 18Z at which TL drops to 60±5 db averaged over all bearings and 51-71m depths, for source at 900Hz, 60m) |
Expected Range (km) in cross-slope direction at fixed time
ts for source at (xs,ys) (Mean Range on 05Sep 18Z at which TL in cross-slope direction drops to 60±5 db averaged over 51-71m depths, for source at 900Hz, 60m) |
Expected Range (km) in along-slope direction at fixed time ts
for source at (xs,ys) (Mean Range on 05Sep 18Z at which TL in along-slope direction drops to 60±5 db averaged over 51-71m depths, for source at 900Hz, 60m) |
Expected Range (km) at fixed time ts for source at (xs,ys)
and receiver at 27m depth (Mean Range on 05Sep 18Z at which TL drops to 60±5 db for receiver at 27m depth, averaged over all bearings, for source at 900Hz, 60m) |
|
|
|
|
|
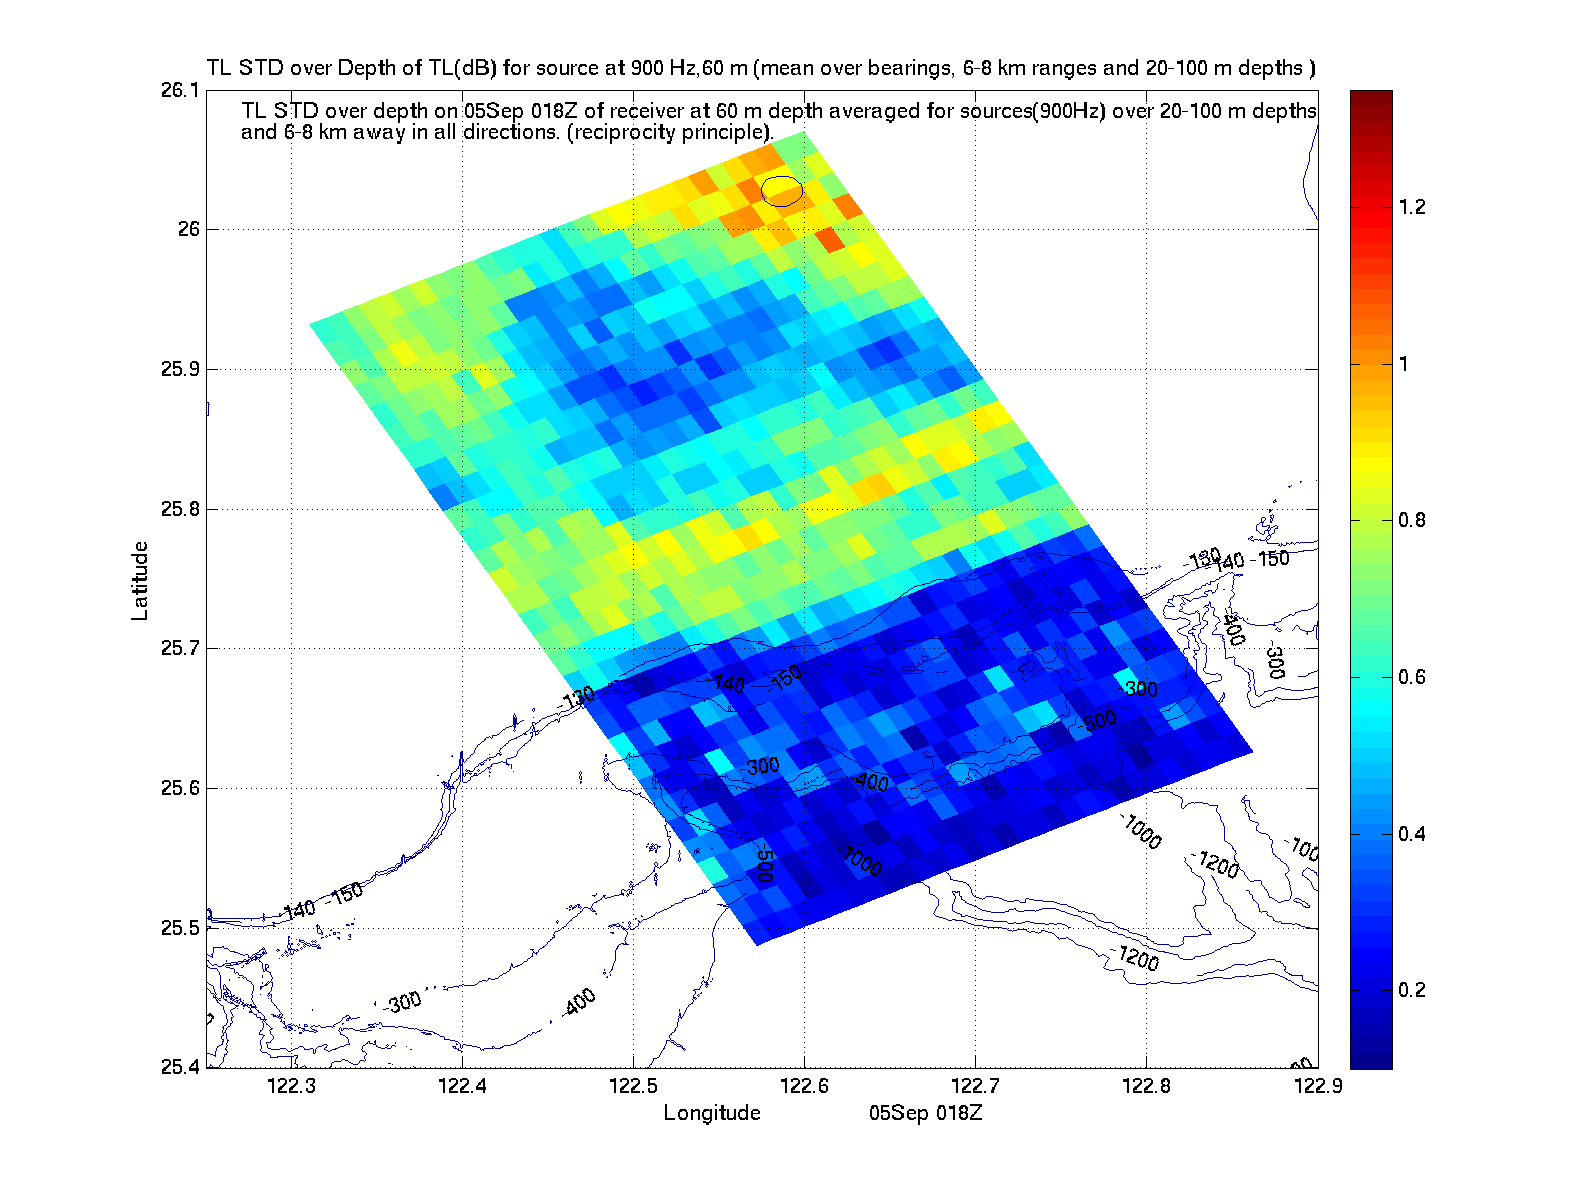
| Std Dev in Depth of TL | Std Dev in Depth of Expected Range |
Std Dev in Depth of Expected X-Slope Range |
Std Dev in Depth of Expected Along-Slope Range |
Std Dev in Bearing of Expected Range for 27m Receiver |
|
|
|
|
|
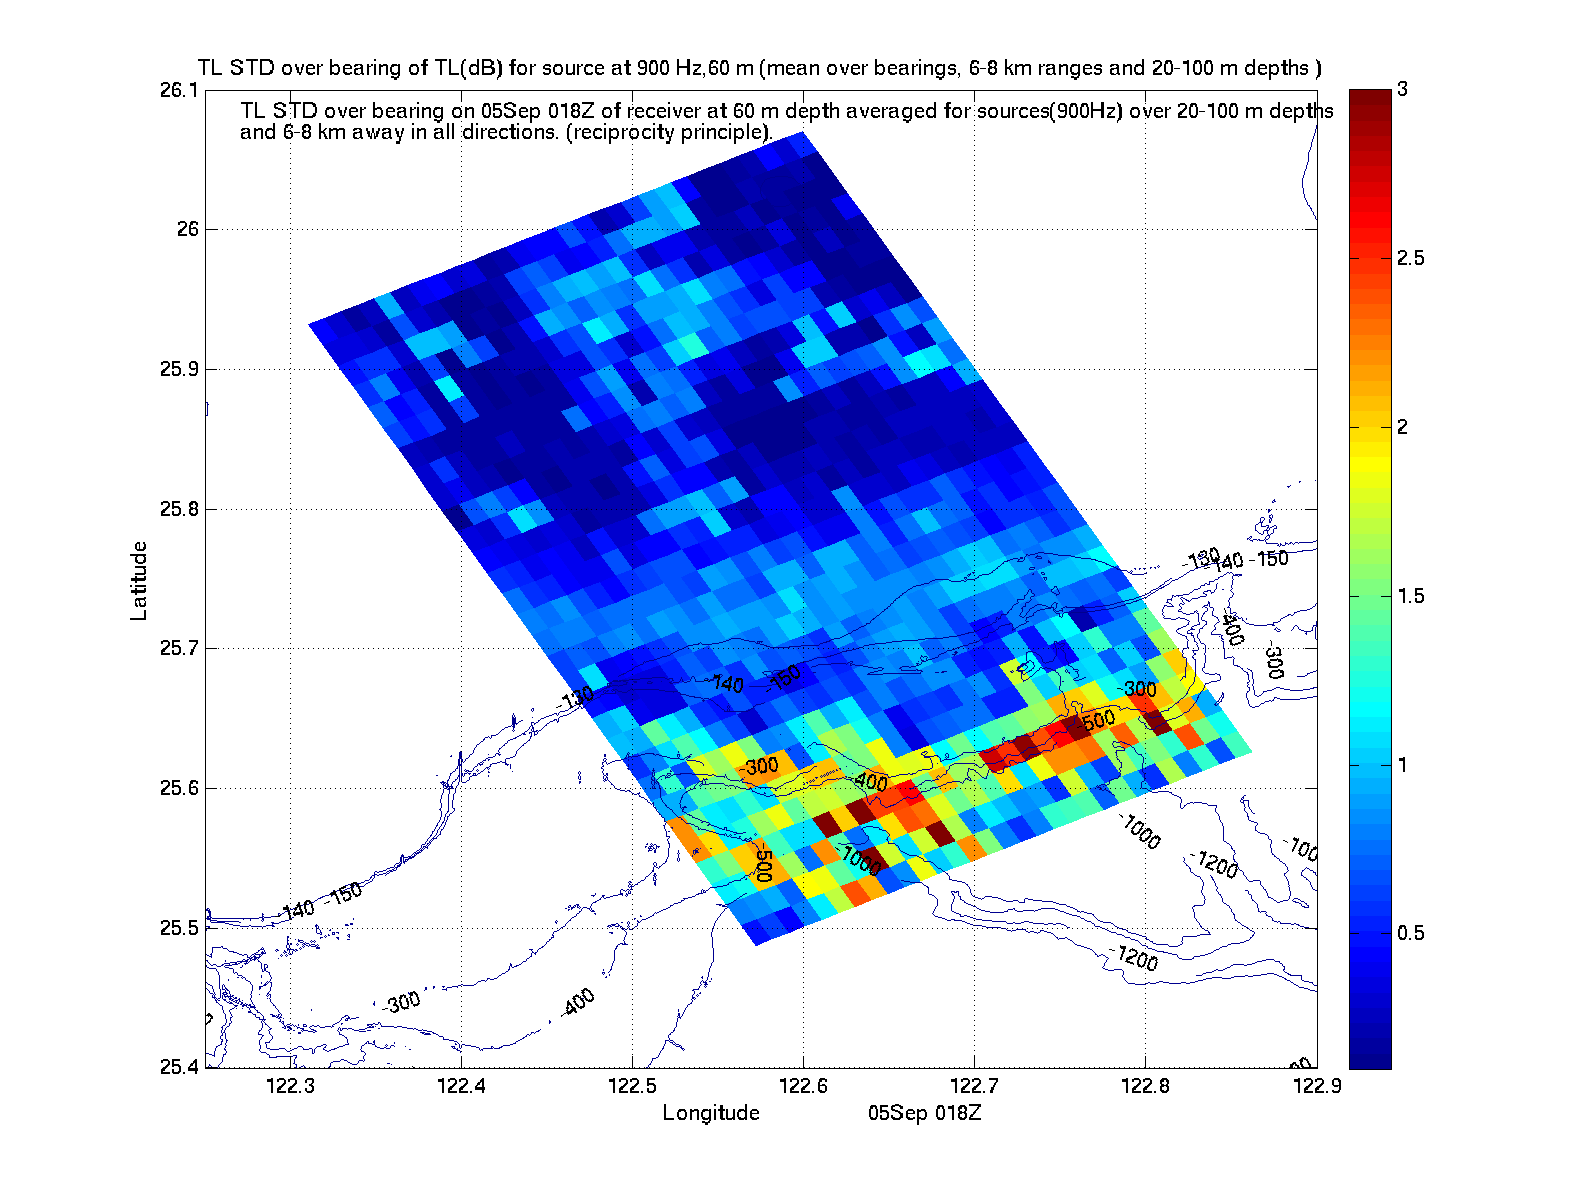
| Std Dev in Bearing of TL | Std Dev in Bearing of Expected Range |
|||
|
|
|||
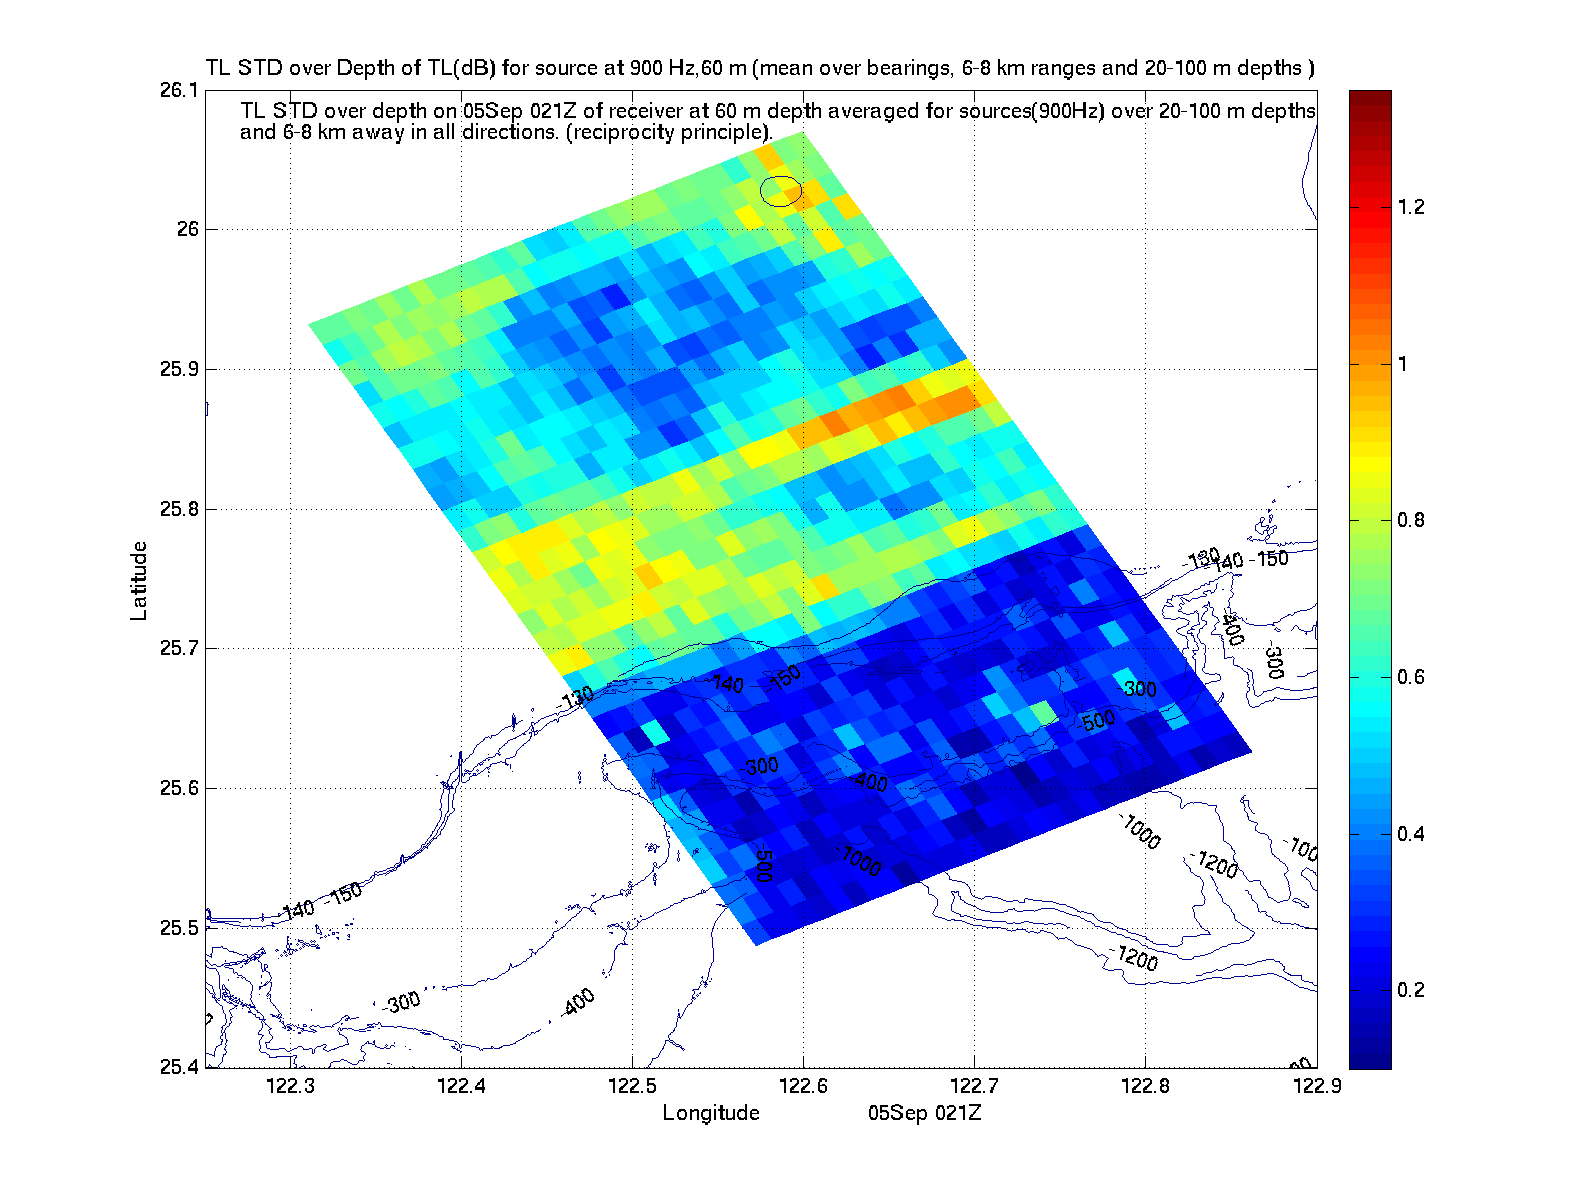
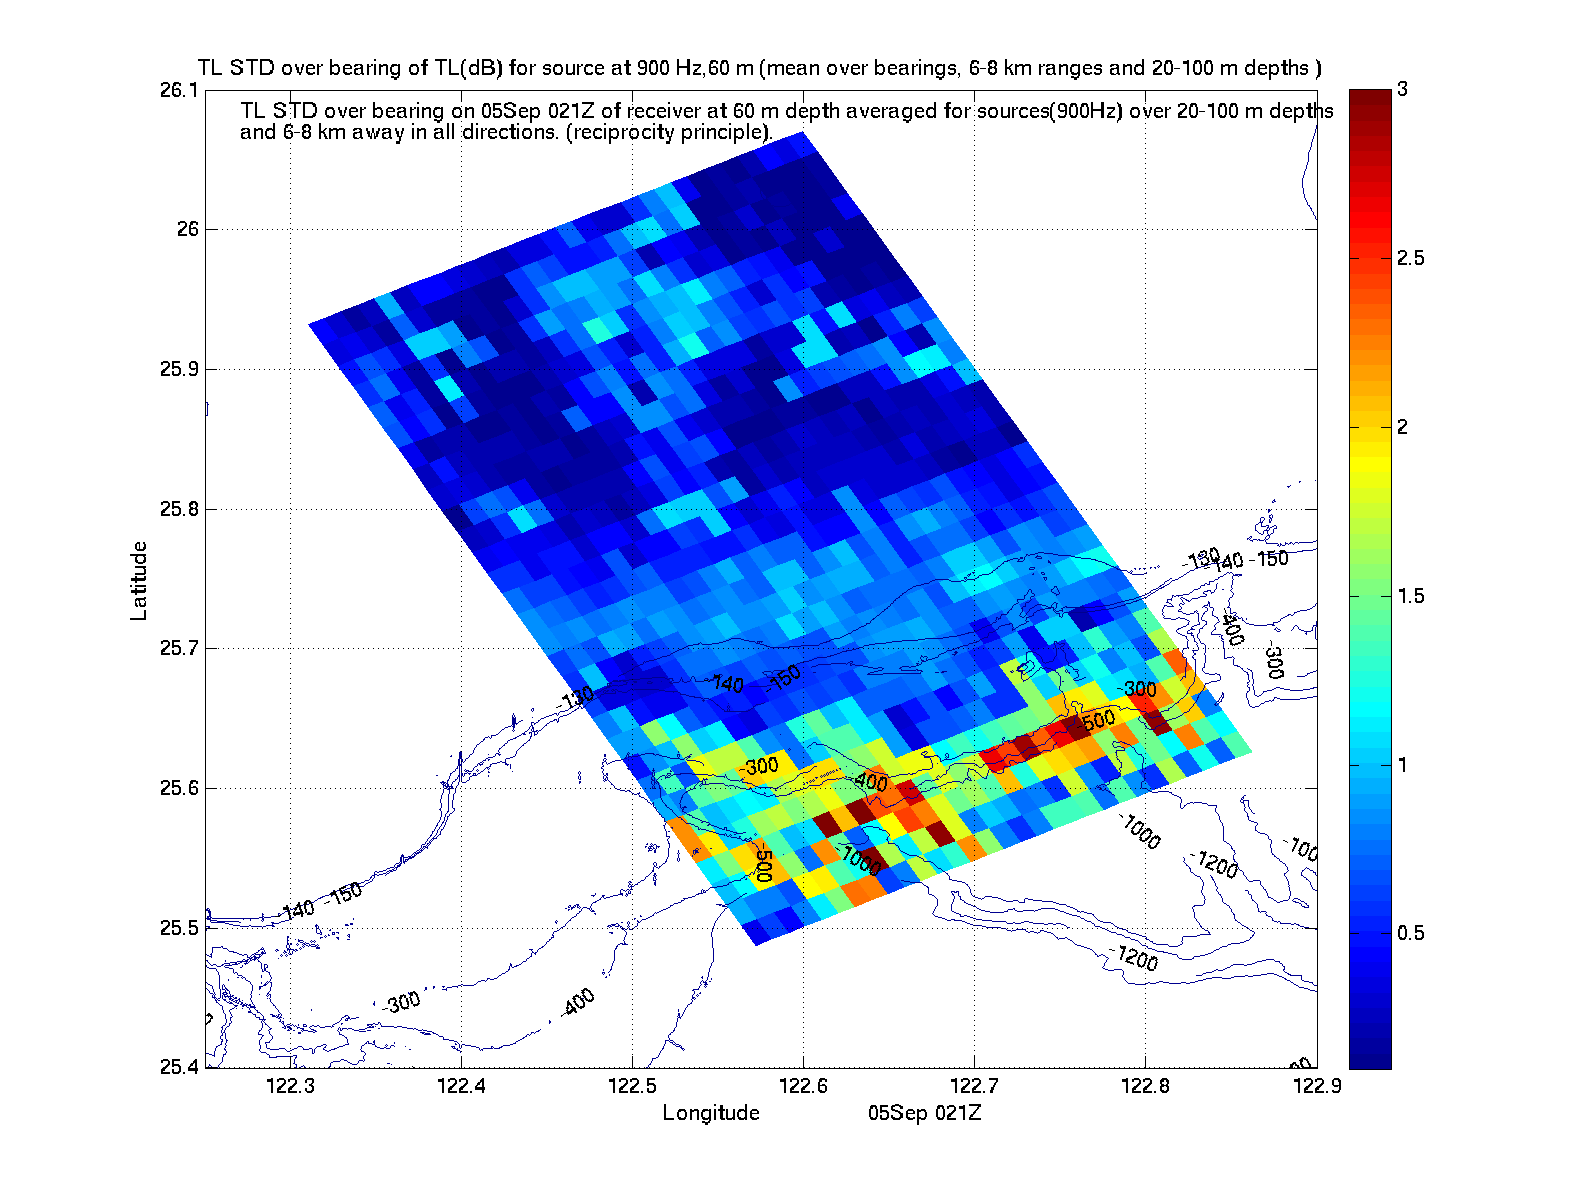
| Fcst. for 5 Sep. 21Z | ||||
|---|---|---|---|---|
| Acoustic Climate Maps for a TL drop to 60±5 db | ||||
| TL(xs,ys,ts) (TL (db) for source at 900Hz, 60m averaged over all bearings, 6-8km ranges and 51-71m depths) |
Expected Range (km) at fixed time ts for source at (xs,ys) (Mean Range on 05Sep 21Z at which TL drops to 60±5 db averaged over all bearings and 51-71m depths, for source at 900Hz, 60m) |
Expected Range (km) in cross-slope direction at fixed time
ts for source at (xs,ys) (Mean Range on 05Sep 21Z at which TL in cross-slope direction drops to 60±5 db averaged over 51-71m depths, for source at 900Hz, 60m) |
Expected Range (km) in along-slope direction at fixed time ts
for source at (xs,ys) (Mean Range on 05Sep 21Z at which TL in along-slope direction drops to 60±5 db averaged over 51-71m depths, for source at 900Hz, 60m) |
Expected Range (km) at fixed time ts for source at (xs,ys)
and receiver at 27m depth (Mean Range on 05Sep 21Z at which TL drops to 60±5 db for receiver at 27m depth, averaged over all bearings, for source at 900Hz, 60m) |

|
|
|
|
|
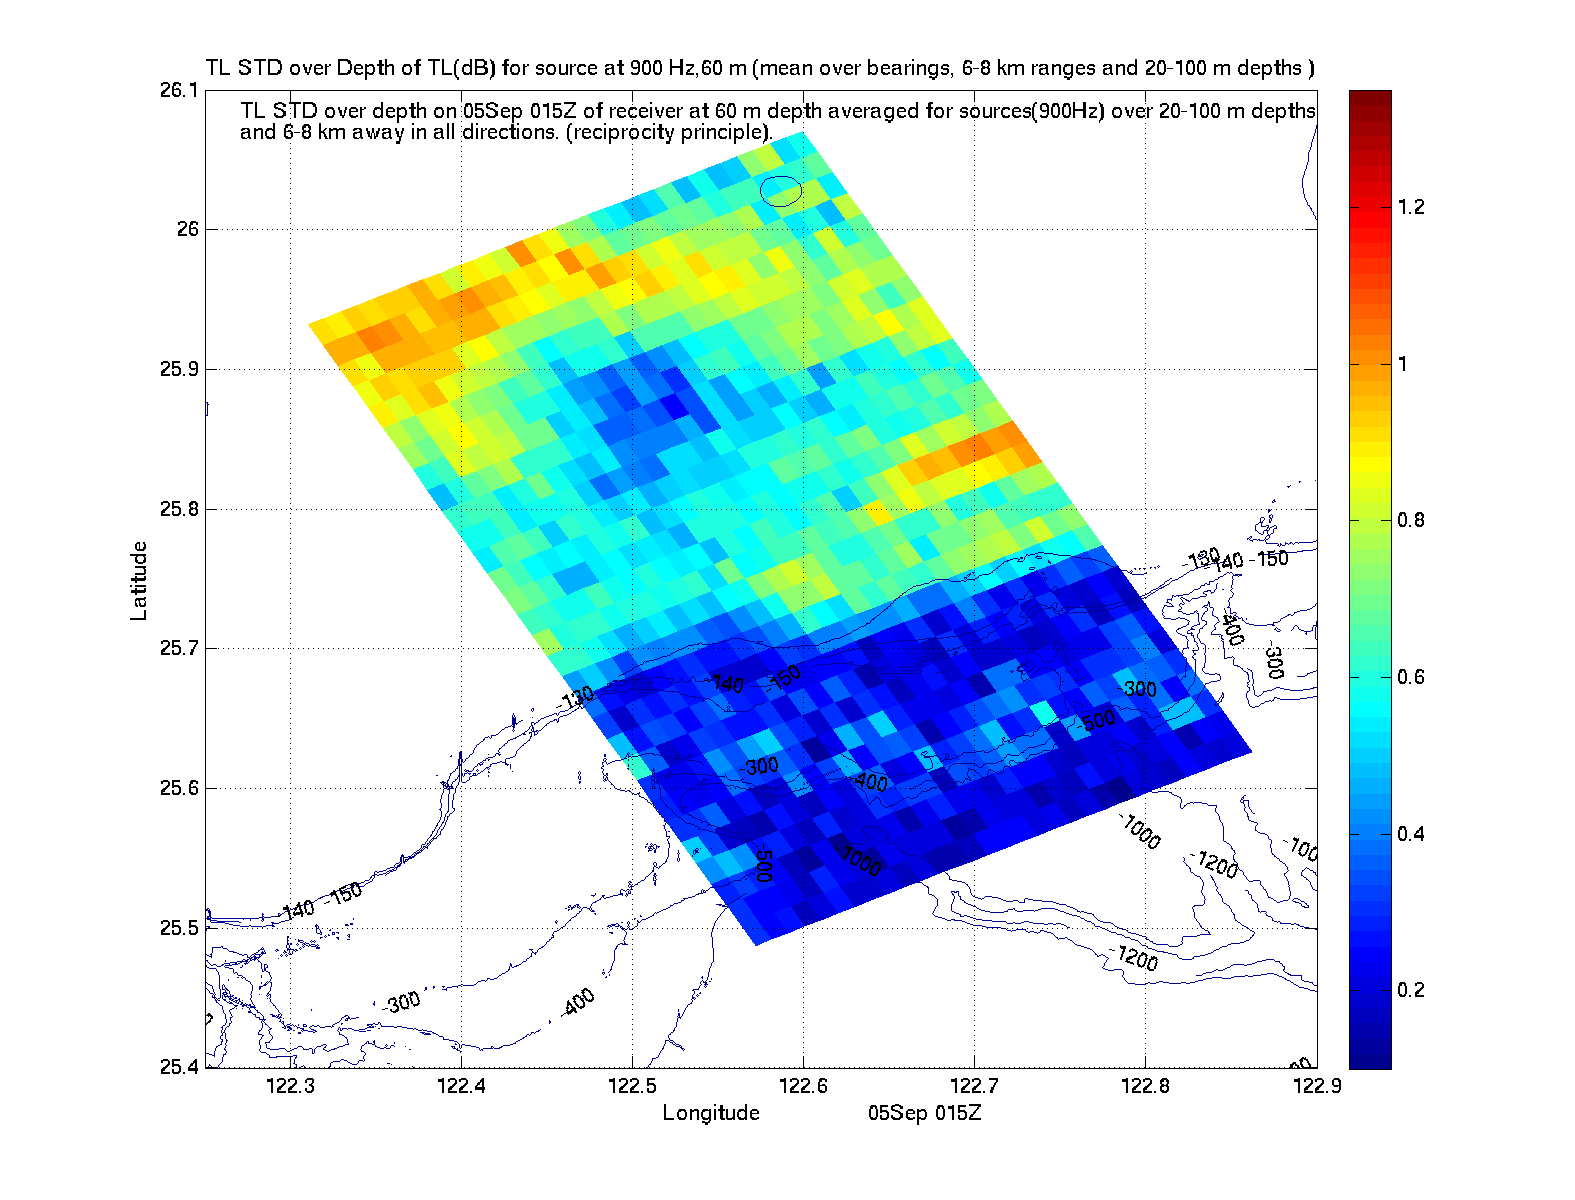
| Std Dev in Depth of TL | Std Dev in Depth of Expected Range |
Std Dev in Depth of Expected X-Slope Range |
Std Dev in Depth of Expected Along-Slope Range |
Std Dev in Bearing of Expected Range for 27m Receiver |
|
|
|
|
|
| Std Dev in Bearing of TL | Std Dev in Bearing of Expected Range |
|||
|
|
|||
| UTC and Taiwan time conversion | ||||||||
|---|---|---|---|---|---|---|---|---|
| UTC | 0000 | 0300 | 0600 | 0900 | 1200 | 1500 | 1800 | 2100 |
| CST | 0800 | 1100 | 1400 | 1700 | 2000 | 2300 | 0200 (+1) | 0500 (+1) |
| Available Forecast NetCDF Files | ||
|---|---|---|
| Physics Fcst for Sep 4-6 | MIT_phys_2009090208_2009090400_2009090600_03h.nc.gz | |
| Acoustics Fcst for Sep05 | 1500Z | MIT_acoustic_TL_2009090208_2009090515_2009090515_00h_900.nc.gz |
| 1800Z | MIT_acoustic_TL_2009090208_2009090518_2009090518_00h_900.nc.gz | |
| 2100Z | MIT_acoustic_TL_2009090208_2009090521_2009090521_00h_900.nc.gz | |
The file names can be interpreted as follows (all times are in UTC):