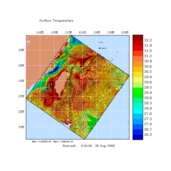
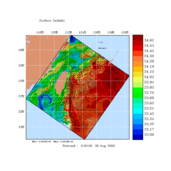
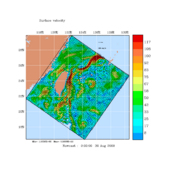
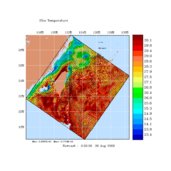
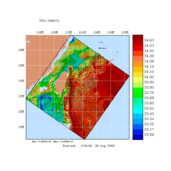
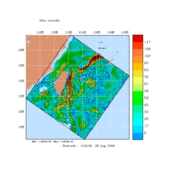
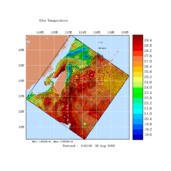
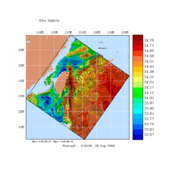
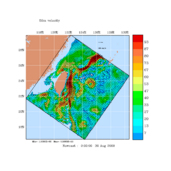
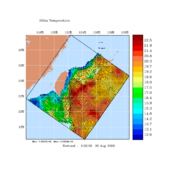
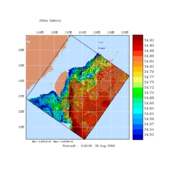
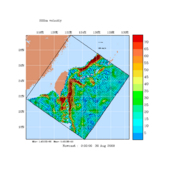
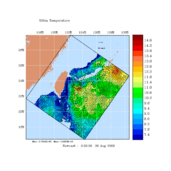
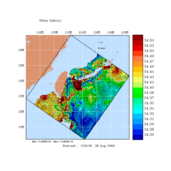
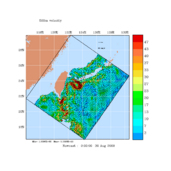
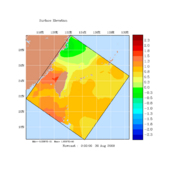
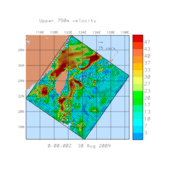
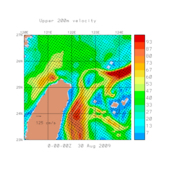
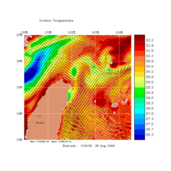
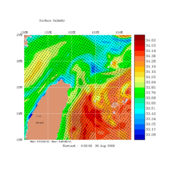
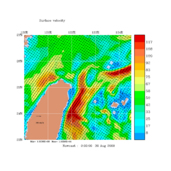
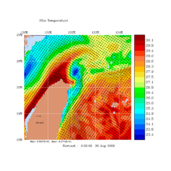
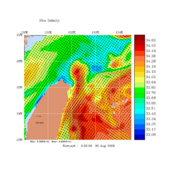
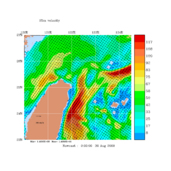
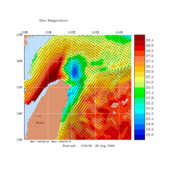
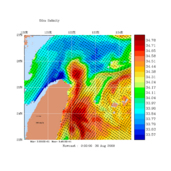
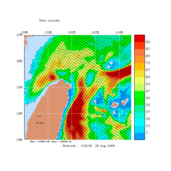
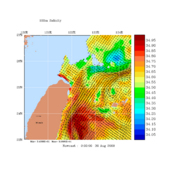
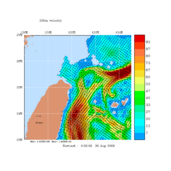
| Aug 30 0000Z (Aug 30 0800CST): Snapshot Time-Series of the Estimated Ocean State (every 3 hours) | |||||||||||||||||||||||||||||
|---|---|---|---|---|---|---|---|---|---|---|---|---|---|---|---|---|---|---|---|---|---|---|---|---|---|---|---|---|---|
| Click on any depth label for a full set of plots | |||||||||||||||||||||||||||||
|
|
|
|||||||||||||||||||||||||||
|
|
|
|||||||||||||||||||||||||||
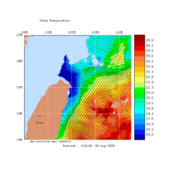
| Zooms on Operational Area of Interest | |||||||||||||||||||||||||||||
|
|
|
|||||||||||||||||||||||||||
|
|||||||||||||||||||||||||||||
| UTC and Taiwan time conversion | ||||||||
|---|---|---|---|---|---|---|---|---|
| UTC | 0000 | 0300 | 0600 | 0900 | 1200 | 1500 | 1800 | 2100 |
| CST | 0800 | 1100 | 1400 | 1700 | 2000 | 2300 | 0200 (+1) | 0500 (+1) |
| Available Forecast Files | ||
|---|---|---|
| Physics Fields for 00Z Sep03 - 00Z Sep05 | Standard | MIT_phys_2009090208_2009083000_2009090100_03h.nc.gz |
| Rotated Standard | MIT_phys_geo_2009090208_2009083000_2009090100_03h.nc.gz | |
| Rotated Zoom | MIT_phys_zoom_2009090208_2009083000_2009090100_03h.mat.gz | |
| 900HZ Acoustics Fields for Sep04 | 1500Z | MIT_acoustic_TL_2009082908_2009083115_2009083115_00h_900.nc.gz |
| 2100Z | MIT_acoustic_TL_2009082908_2009083121_2009083121_00h_900.nc.gz | |
The file names can be interpreted as follows (all times are in UTC):