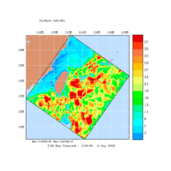
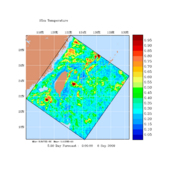
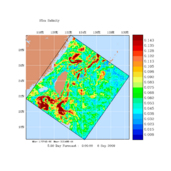
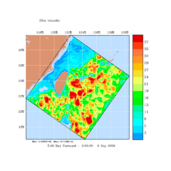
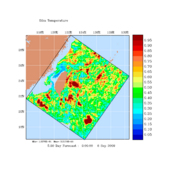
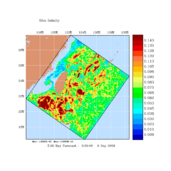
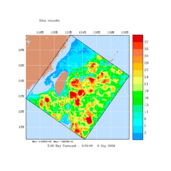
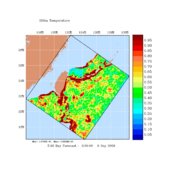
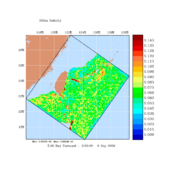
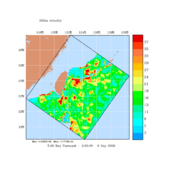
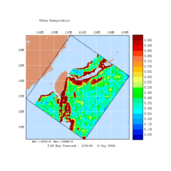
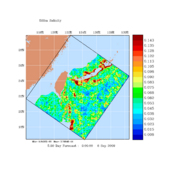
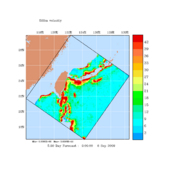
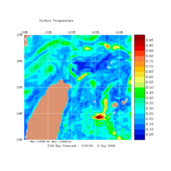
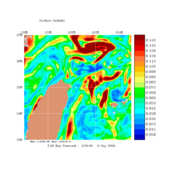
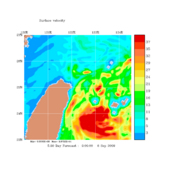
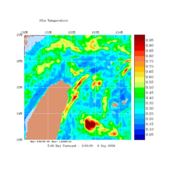
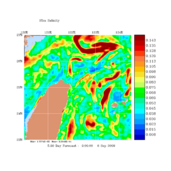
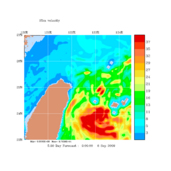
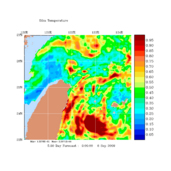
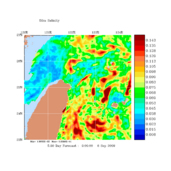
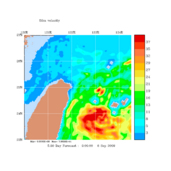
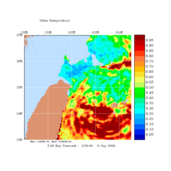
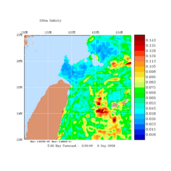
| Sep 06 0000Z (Sep 06 0800CST): Snapshot Time-Series of the Estimated Error Standard Deviations of the Estimated Ocean State (every 3 hours) |
|---|
| Click on any depth label for a full set of plots |
|
0m |
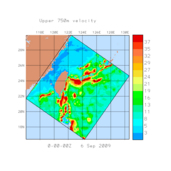
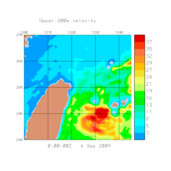
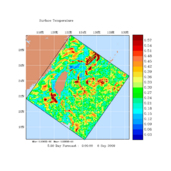
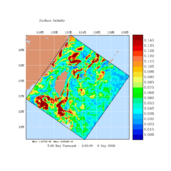
| Temp. Uncertainty | Sal. Uncertainty | Vel. Uncertainty |
 |
 |
 |
|
|
25m |
| Temp. Uncertainty | Sal. Uncertainty | Vel. Uncertainty |
 |
 |
 |
|
|
50m |
| Temp. Uncertainty | Sal. Uncertainty | Vel. Uncertainty |
 |
 |
 |
|
|
200m |
| Temp. Uncertainty | Sal. Uncertainty | Vel. Uncertainty |
 |
 |
 |
|
|
500m |
| Temp. Uncertainty | Sal. Uncertainty | Vel. Uncertainty |
 |
 |
 |
|
|
| Zooms on Operational Area of Interest |
|
000m |
| Temp. Uncertainty | Sal. Uncertainty | Vel. Uncertainty |
 |
 |
 |
|
|
25m |
| Temp. Uncertainty | Sal. Uncertainty | Vel. Uncertainty |
 |
 |
 |
|
|
50m |
| Temp. Uncertainty | Sal. Uncertainty | Vel. Uncertainty |
 |
 |
 |
|
| |
|
100m |
| Temp. Uncertainty | Sal. Uncertainty | Vel. Uncertainty |
 |
 |
 |
|
|