Wayne G. Leslie
Pierre F.J. Lermusiaux
Patrick J. Haley, Jr.

MSEAS QPE IOP2009 home page
MSEAS QPE home page
MSEAS home page

QPE - Atmospheric Forcings - 1 Aug. - 15 Sep. 2009

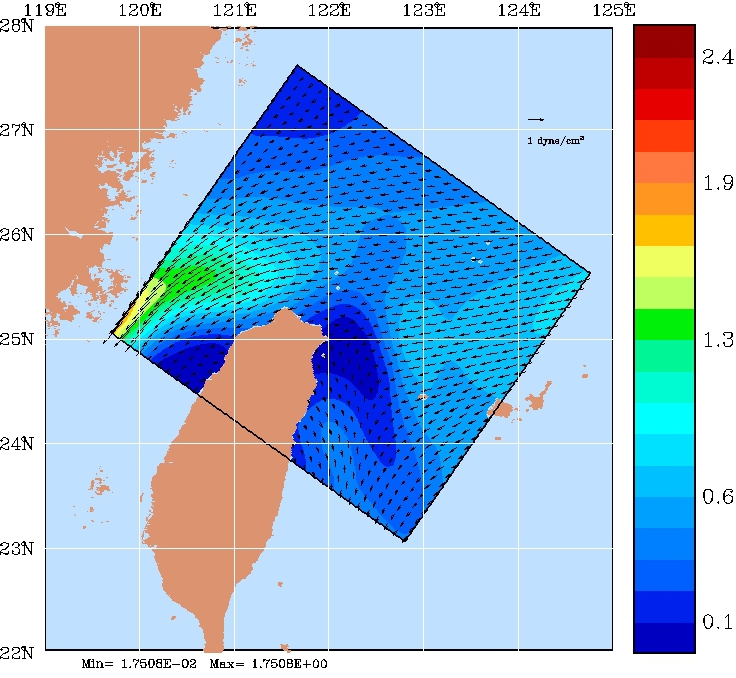
Atmospheric forcing fields have been prepared for 06Z 1 August - 06Z 15 September 2009. Available variables include wind stress, net heat flux, evaporation-precipitation, and shortwave radiation. These fields have been primarily prepared from the direct fluxes of an 18km resolution COAMPS archive; the wind stress is a combination of the 18km COAMPS archive winds and a set of nested 15km/5km COAMPS winds (available in real-time).

The final fields are the result of a two-year study during which we carefully compared and evaluated available data sets: flux by flux and field by field. We subsequently selected what we determined was the most appropriate combination of re-analysis products and gridded those on 4 different grids at different resolutions. We then selected the highest resolution among all available fields and compiled/combined/merged them into our best estimates of the atmospheric forcing. A complete description of the numerous comparisons and evaluations carried out, the fields and their composition is available here.

The 18km COAMPS and nested 15km/5km COAMPS data sets were chosen as the basis for the final product set because:
  1. all the direct observations necessary to calculate the MSEAS forcing are available
  2. no bulk formula calculations are required
  3. there is complete spatial and temporal coverage of the area of interest
  4. spatial and temporal resolutions are adequate
  5. available observations are self-consistent (from one model)
The available physical regions are shown below:
  1. 7.24S-45.6N, 94.88-185.08E at 5km resolution
  2. 16-31N, 115-131E at 5km resolution
  3. the 4.5km resolution MSEAS real-time modeling domain
  4. the 1.5km resolution MSEAS real-time modeling domain.

  A subset of the specific evaluations carried out includes:
  • Precipitation - compared COAMPS and NOGAPS total precipitation for 7-9 Aug., 30-31 Aug. and 9-10 Sep
  • Direct versus bulk formulae - compared direct and bulk formulae calculations of E-P, net heat and wind stress from COAMPS and NOGAPS
  • Components of net heat - compared components of heat flux (shortwave radiation, sensible heat, latent heat and backscatter) from direct and bulk formulae calculations
  • Cloud cover - determined ramifications of cloud cover and SST availability in the various products
  • Real-time versus nested - compared real-time COAMPS and NOGAPS with nested 15km/5km COAMPS
  • Real-time - compared fields received daily in real-time from COAMPS and NOGAPS
5km Resolution Domain (-7 - 45N, 95-185E)
http://mseas.mit.edu/Research/QPE/Forcings/Final/complete_wstr_Aug02_00Z_full18km_crop.gif
Representative domain plotted.
Plots of
 
Evap. - Precip.
 
Net Heat
 
Radiation
 
Wind Stress
NetCDF Data Files:
 
Evap. - Precip.
 
Net Heat
 
Radiation
 
Wind Stress
 
13GB each
(Wind stress is 25GB)
5km Resolution Domain (16-31N, 115-131E)
http://mseas.mit.edu/Research/QPE/Forcings/Final/complete_wstr_Aug02_00Z_large_crop.gif Plots of
 
Evap. - Precip.
 
Net Heat
 
Radiation
 
Wind Stress
NetCDF Data Files:
 
Evap. - Precip.
 
Net Heat
 
Radiation
 
Wind Stress
 
631MB each
(Wind stress is 1.3GB)
MSEAS 4.5km Resolution Real-time Modeling Domain
http://mseas.mit.edu/Research/QPE/Forcings/Final/complete_wind_Aug02_00Z_mseas_domain_crop.gif Plots of
 
Evap. - Precip.
 
Net Heat
 
Radiation
 
Wind Stress
NetCDF Data File:
 
Complete
 
1.2GB
(One file contains all four fluxes)
MSEAS 1.5km Resolution Real-time Modeling Domain
http://mseas.mit.edu/Research/QPE/Forcings/Final/complete_wstr_Aug02_00Z_mseas_1p5km_domain_crop.jpg Plots of
 
Evap. - Precip.
 
Net Heat
 
Radiation
 
Wind Stress
NetCDF Data File:
 
Complete
 
1.3GB
(One file contains all four fluxes)
We thank the Office of Naval Research for generous support of this research. At ONR we thank Ching-Sang Chiu, Ben Reeder, Terri Paluszkiewicz, and Ellen Livingston for their assistance throughout the QPE program. In addition, we thank G. Gawarkiewicz, T. Duda, J. Sen, B. Cornuelle, J. Lynch, P. Niiler, L. Centurioni, C. Lee, R.-C. Lien, T. Sanford, L. Mayer, B. Calder, and Y.-T. Lin for data and discussions. We also thank J. Doyle, D. Marble, J. Nachimkin, and J. Cook as well as the FNMOC for providing us with atmospheric fluxes.