Click on any depth label for a full set of plots.
| Snapshot Time-Series of the Estimated Ocean State (every 6 hours) |
|---|
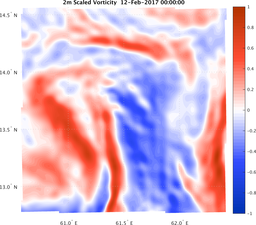
| Zooms on Operational Area of Interest |
|
0m |
| Sigma-T | Velocity | Temperature | Salinity |
 |
 |
 |
 |
|
|
60m |
| Sigma-T | Velocity | Temperature | Salinity |
 |
 |
 |
 |
|
|
100m |
| Sigma-T | Velocity | Temperature | Salinity |
 |
 |
 |
 |
|
|
500m |
| Sigma-T | Velocity | Temperature | Salinity |
 |
 |
 |
 |
|
|
1000m |
| Sigma-T | Velocity | Temperature | Salinity |
 |
 |
 |
 |
|
|
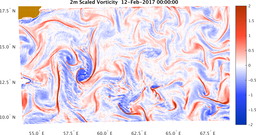
| Interior Northern Arabian Sea Domain |
|
0m |
| Sigma-T | Velocity | Temperature | Salinity |
 |
 |
 |
 |
|
|
60m |
| Sigma-T | Velocity | Temperature | Salinity |
 |
 |
 |
 |
|
|
100m |
| Sigma-T | Velocity | Temperature | Salinity |
 |
 |
 |
 |
|
|
500m |
| Sigma-T | Velocity | Temperature | Salinity |
 |
 |
 |
 |
|
|
1000m |
| Sigma-T | Velocity | Temperature | Salinity |
 |
 |
 |
 |
|
|