| 600Hz | |||
| Mode01 | Mode06 | Mode11 | Mode16 |
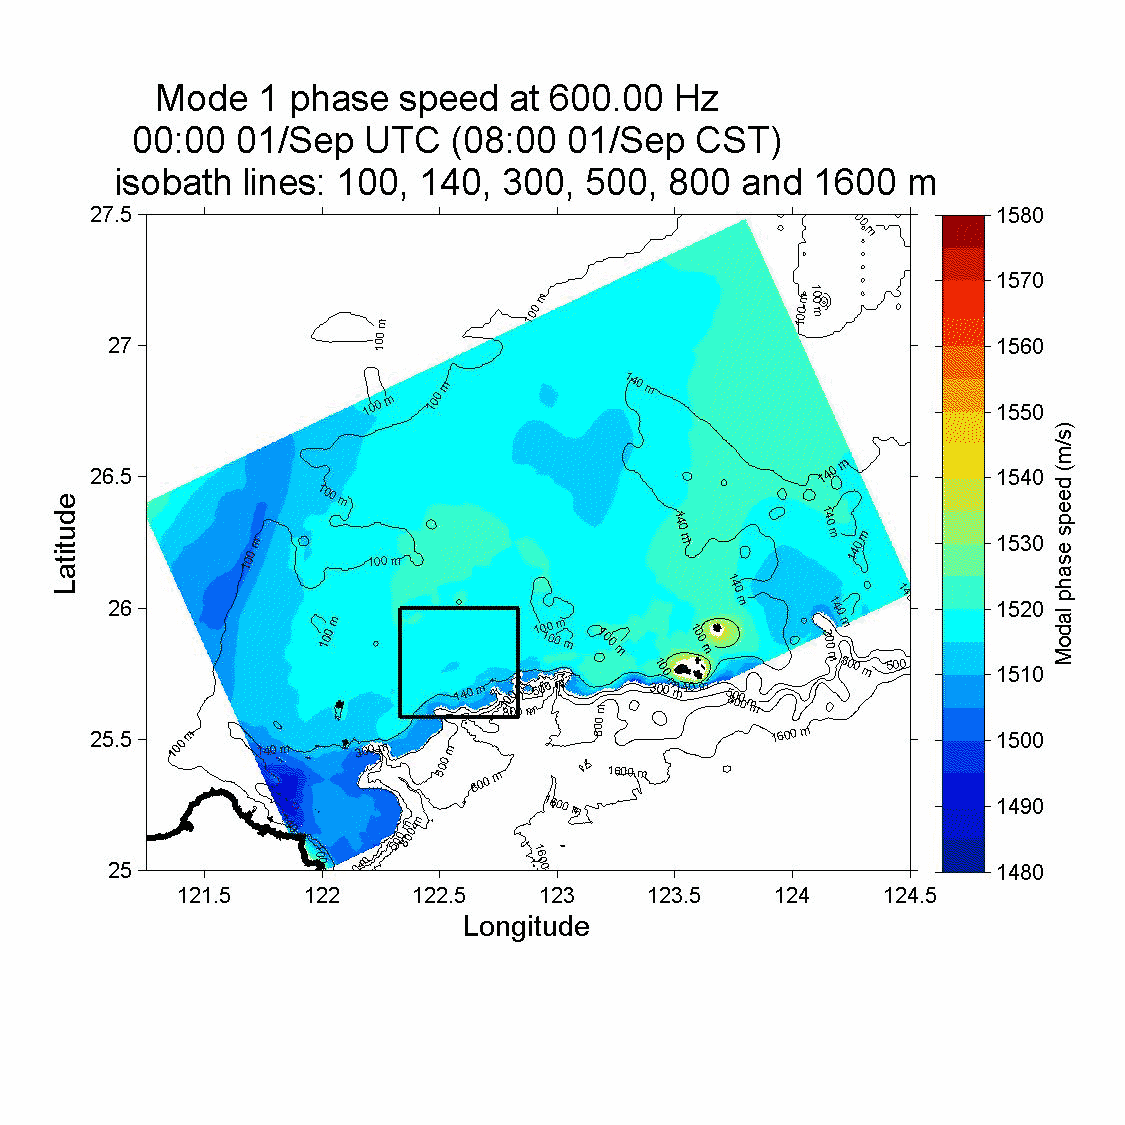 |
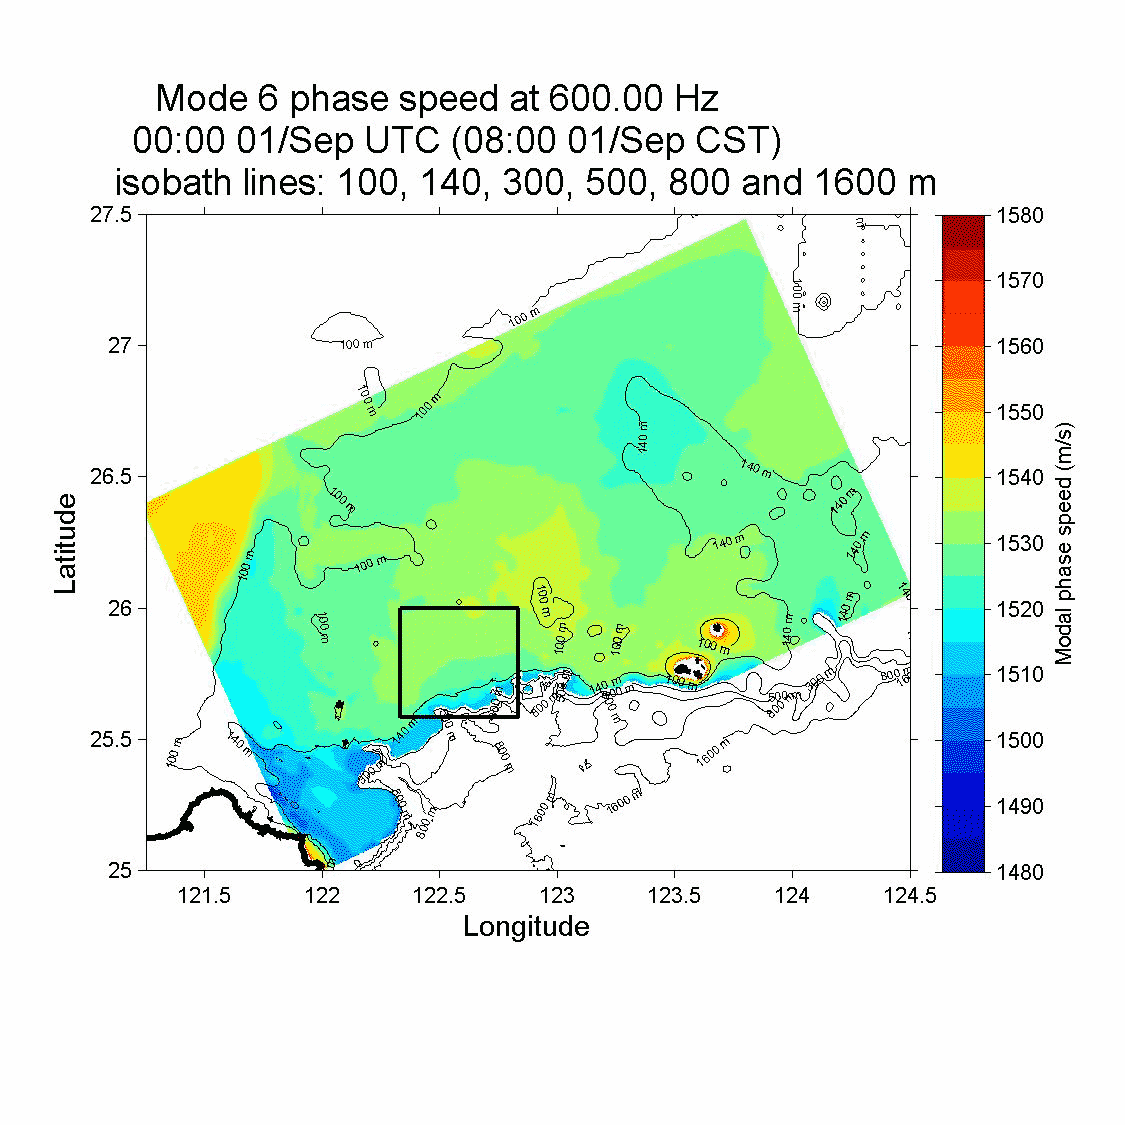 |
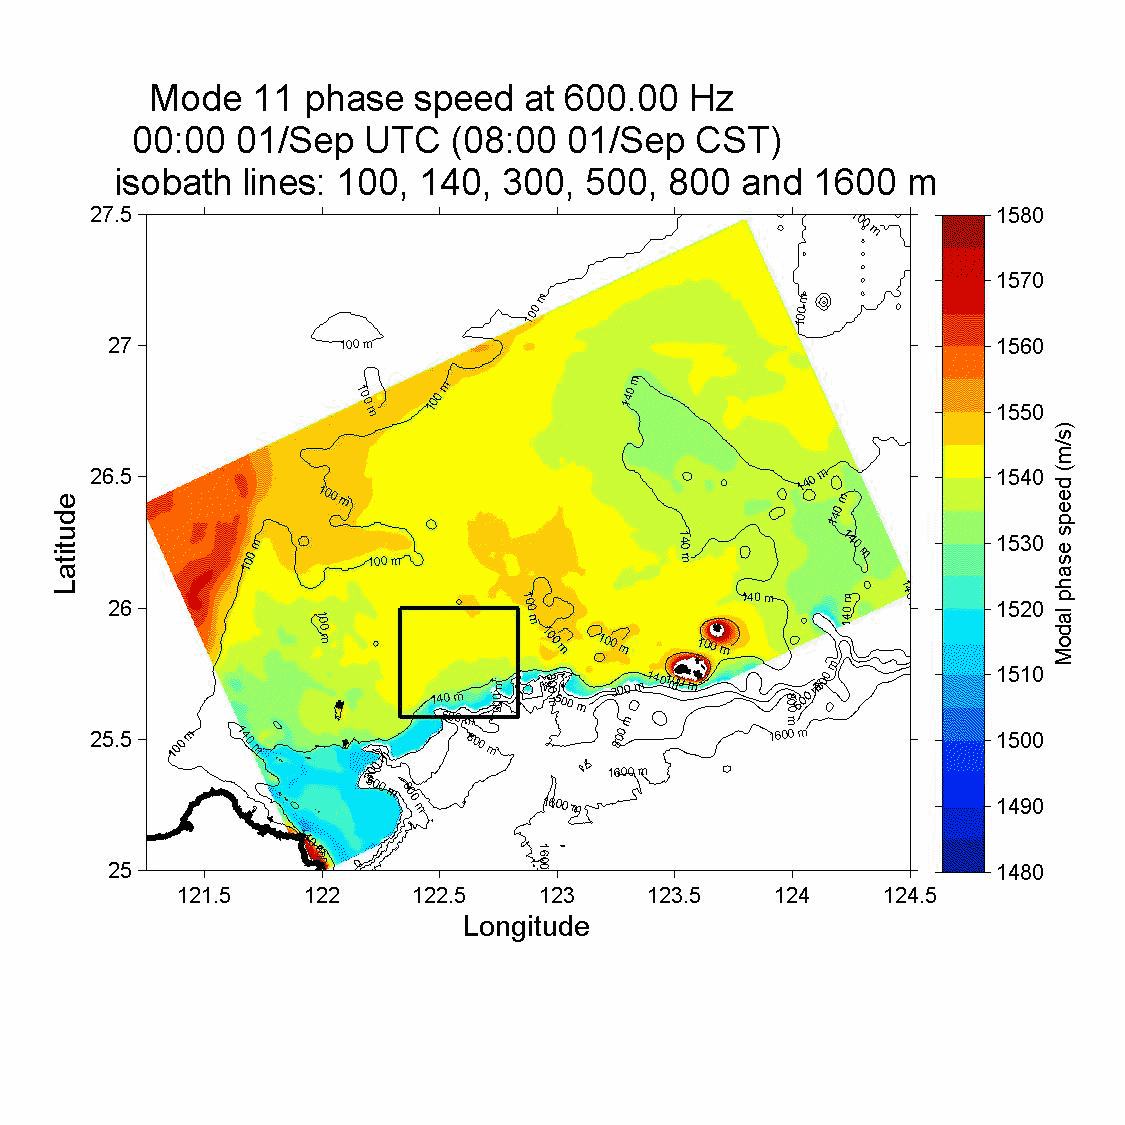 |
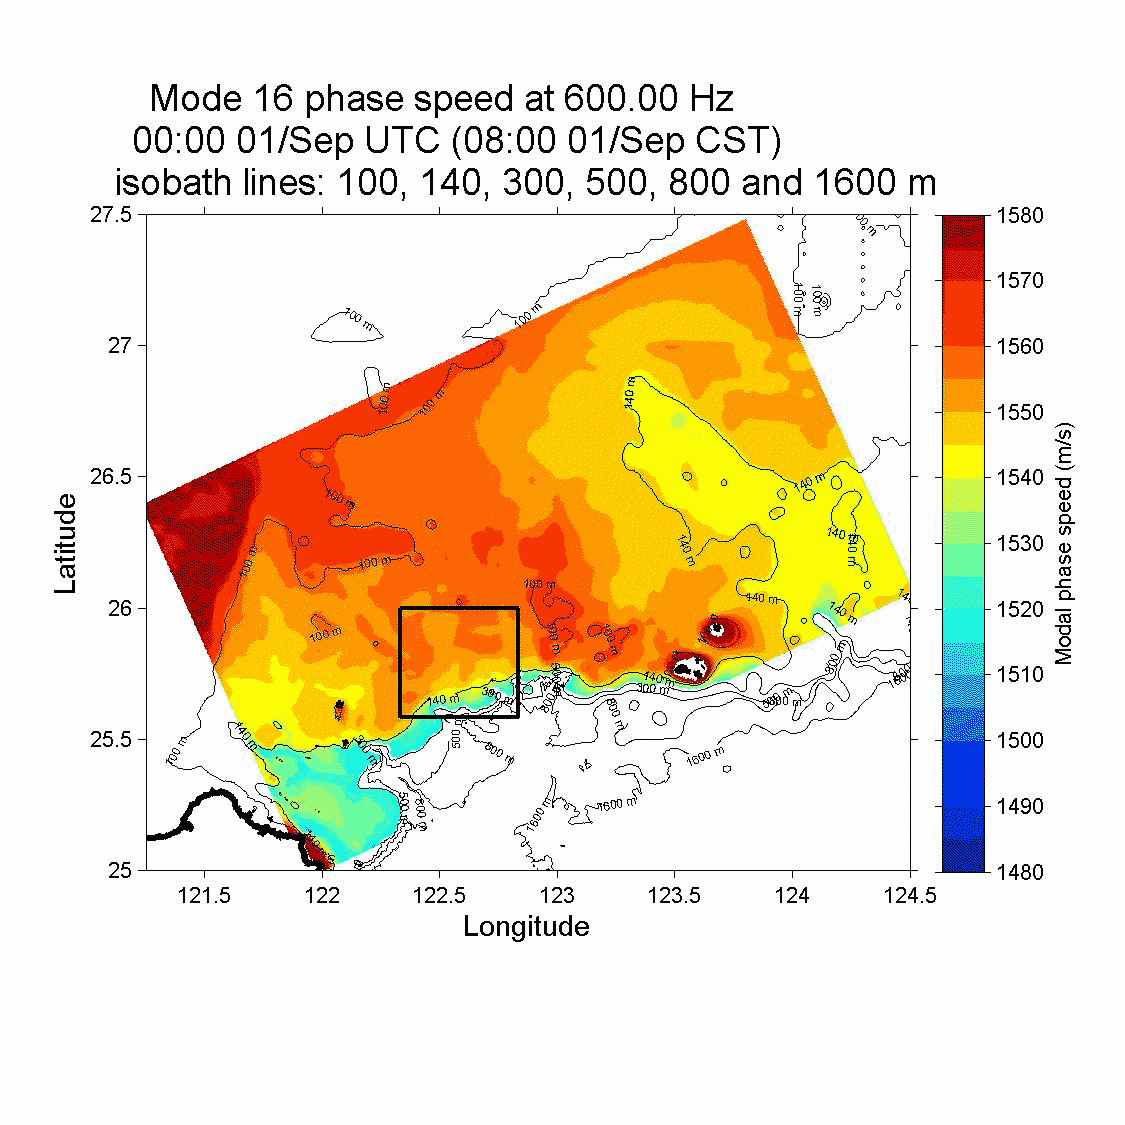 |
| 900Hz | |||
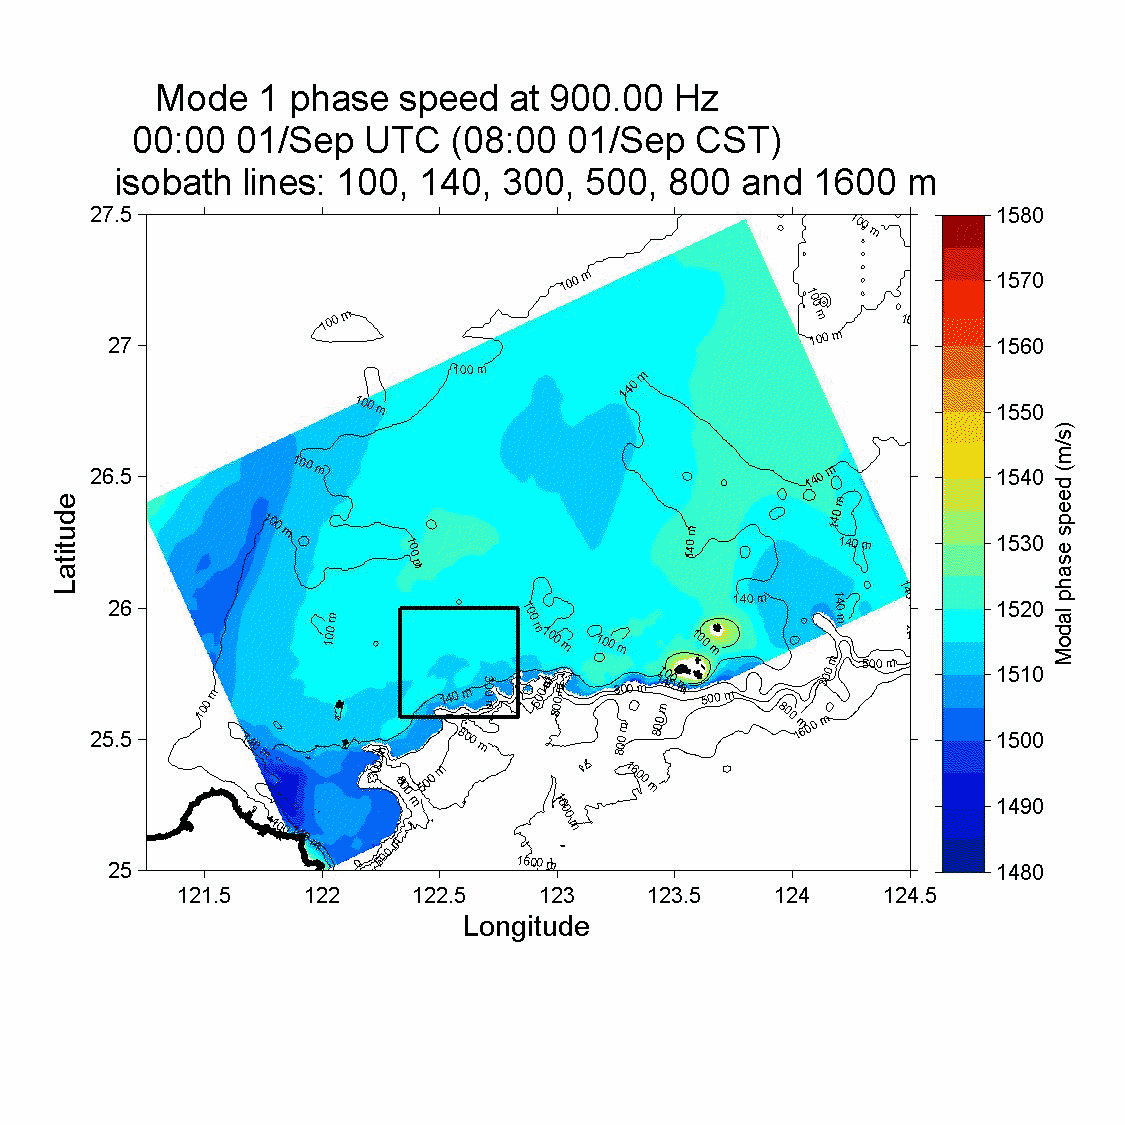
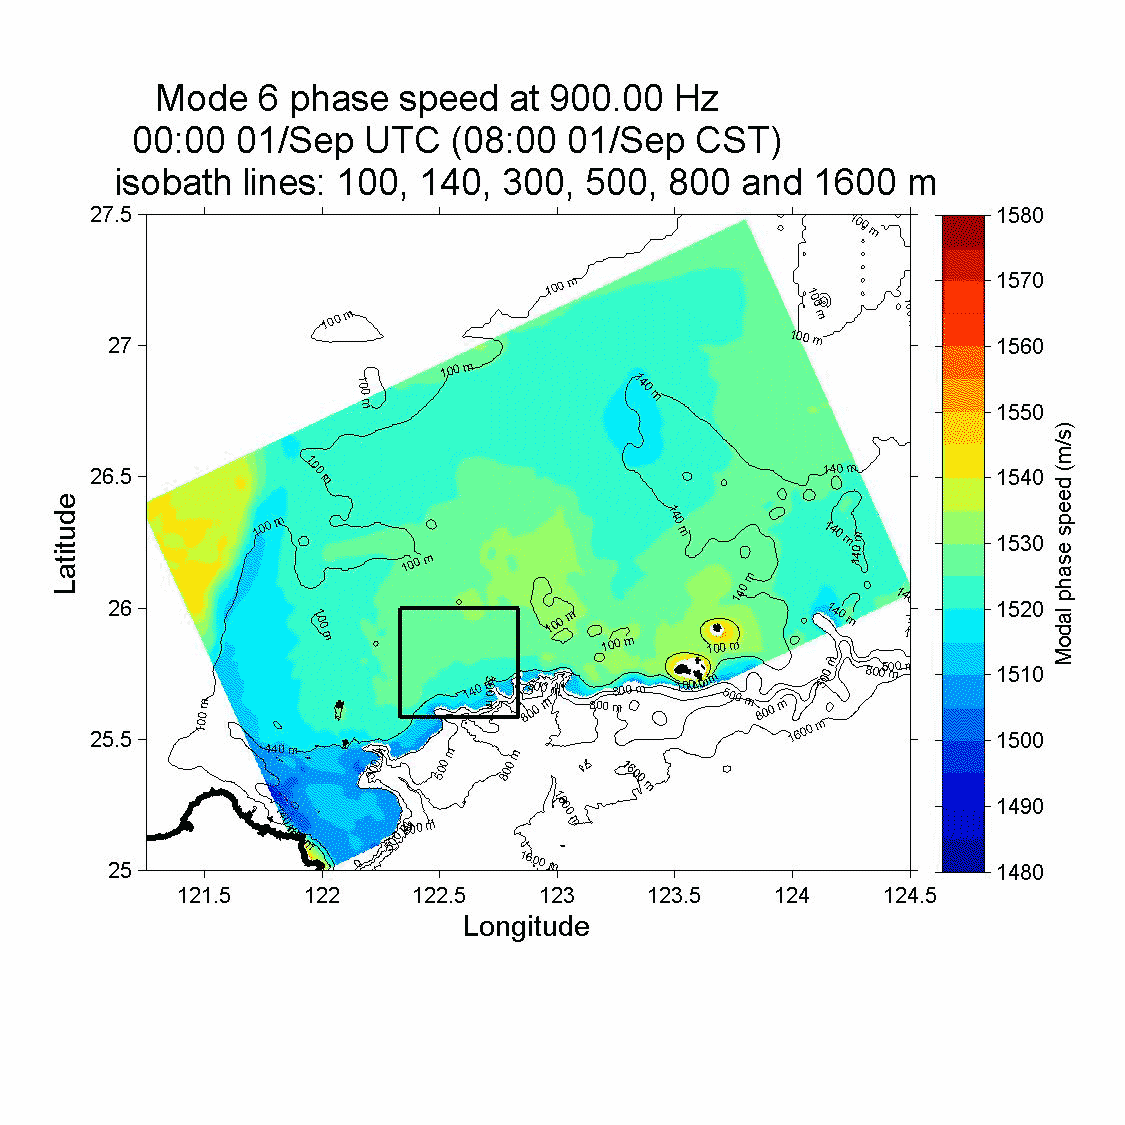
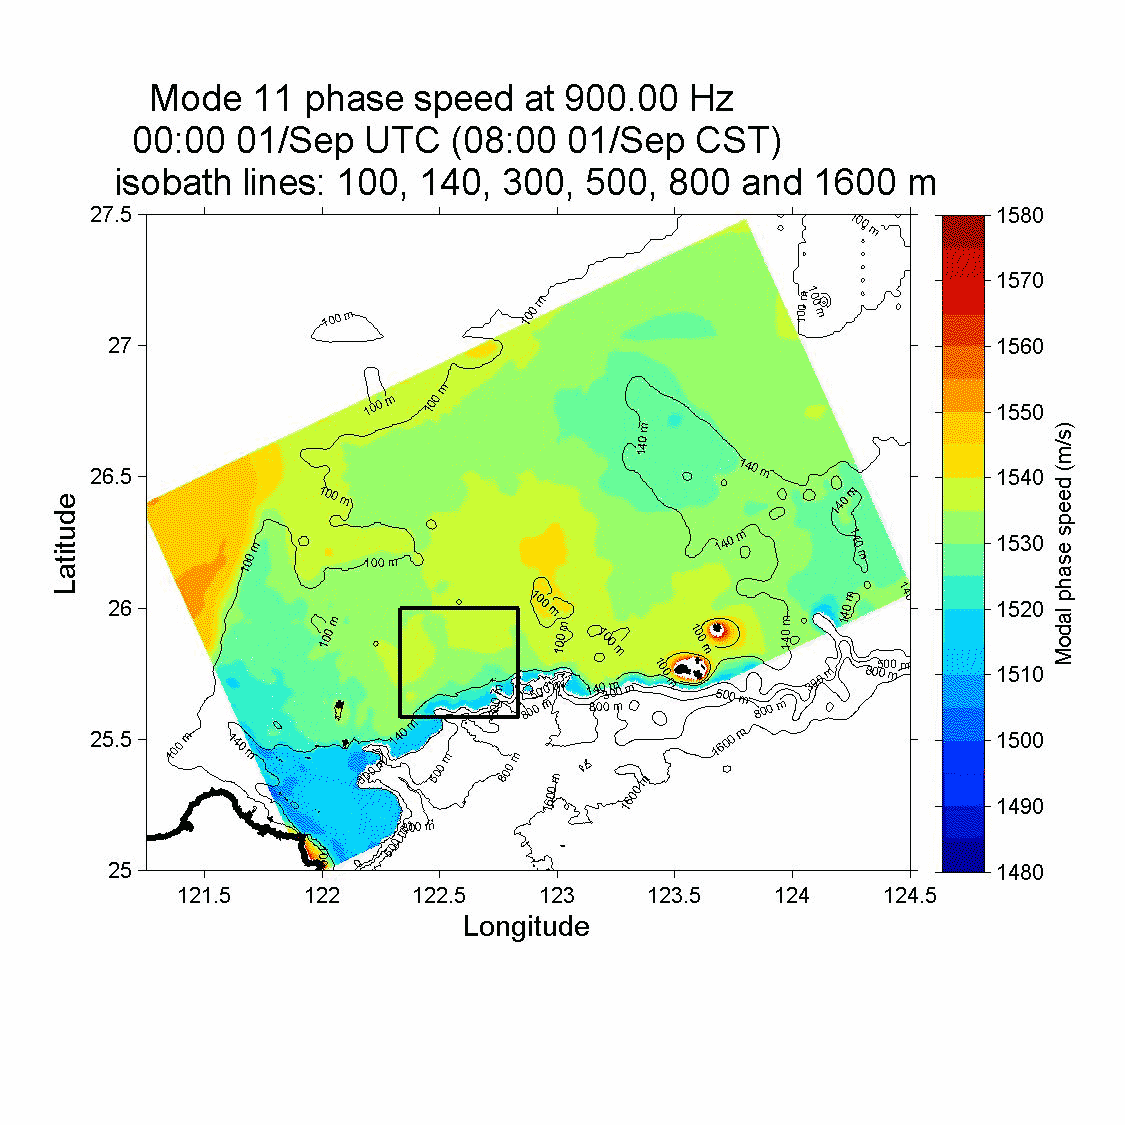
| Mode01 | Mode06 | Mode11 | Mode16 |
 |
 |
 |
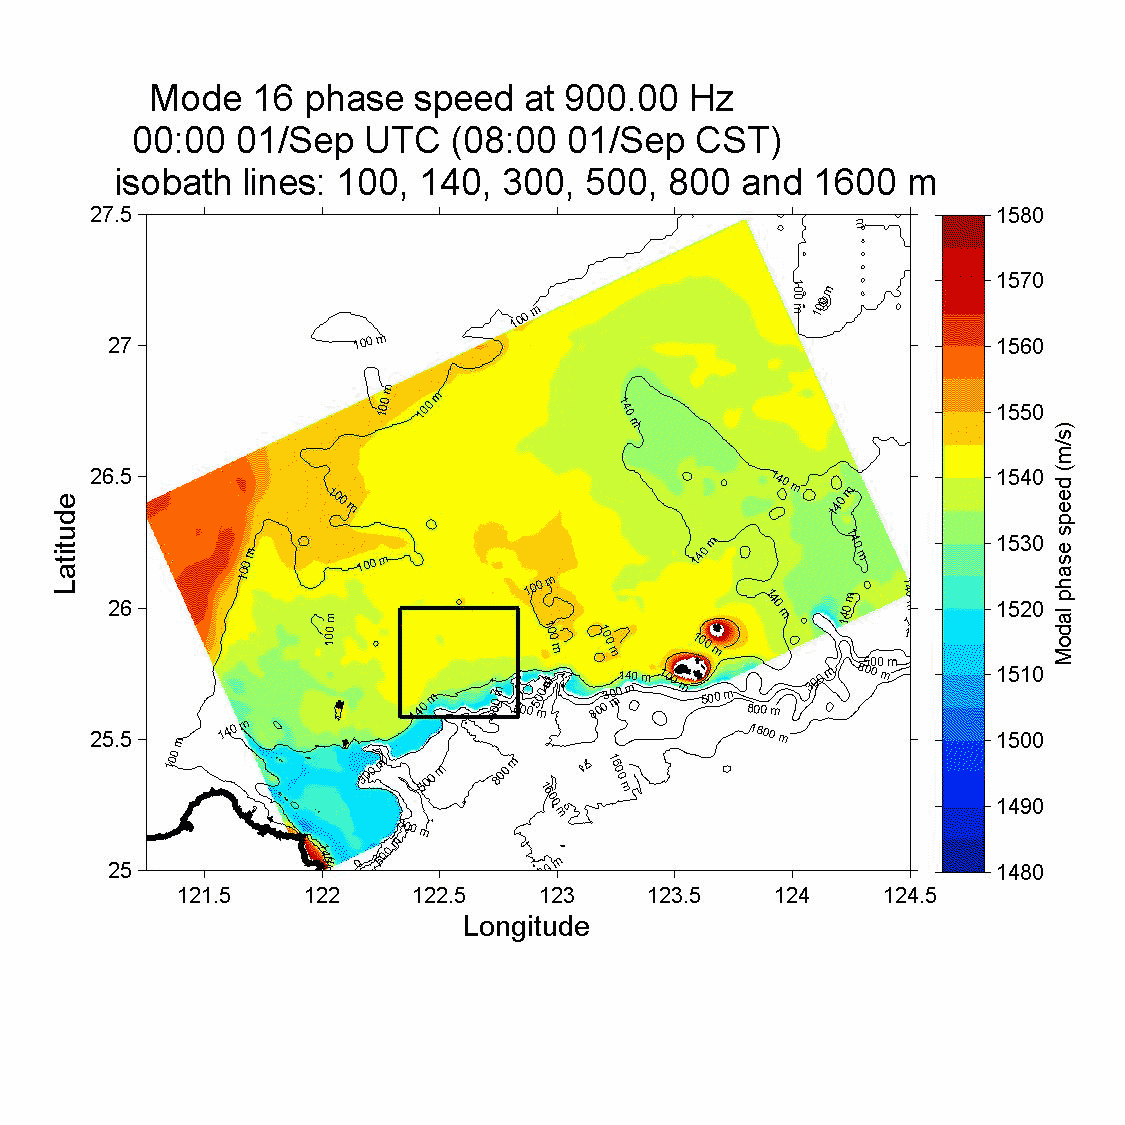 |
Sound frequencies: 600 Hz and 900 Hz; Normal Mode Calculation Domain Resolution: 800 m
Water column: Real-time MIT MSEAS system (4.5 km resolution)
Bathymetry: MIT bathymetry data creating from UNH 100 and 500 m resolution data and NCOR data.
Bottom: 20 m deep sediment layer on the top of a basement with sound speed (c) 1,800 m/s, density (ρ) 2.0 g/cm3 and attenuation coef. (α) 0.5 dB/λ.
The sediment type depends on the local water depth (WD): when WD < 140m a sand sediment is given (c: 1,562 m/s, ρ: 1.9 g/cm3, α: 0.9 dB/λ);
whereas when WD > 140m a muddy-sand sediment is given (c: 1,549 m/s, ρ: 1.488 g/cm3, α: 1.15 dB/λ)
This forecast is for predicting the acoustic modal variability due to water-column condition changes. The normal mode program KRAKEN is used to calculate the local vertical modes at each point on the grid. It should be noted that the sediment type depends on the local water depth, as suggested by P. Lermusiaux and J. Xu of MIT on their bottom sensitivity study using QPE Pilot Study data. This work is sponsored by the ONR.
| Sep 01 0000Z (Sep 01 0800CST): Snapshot Time-Series of the Estimated Modal Phase Speeds(every 3 hours) | ||||||||||||
|---|---|---|---|---|---|---|---|---|---|---|---|---|
| Click on any mode label for a full set of plots | ||||||||||||
|
||||||||||||
|
||||||||||||
| Return to the MSEAS: | |||
| QPE IOP09 real-time web page | QPE web page | Home page | |