|
|
Barotropic tidal estimates are obtained from the solution of shallow water equations over high resolution bathymetry. We have utilized a 100m resolution bathymetry, the highest resolution product available to us. The computational code is described in Logutov (2008) and Logutov and Lermusiaux (2008).
These barotropic tides force our primitive-equation simulations at the open-boundaries. For limited regional-scale basins the tidal forcing occurs pre-dominantly through the open boundary conditions and the contribution of the astronomical tidal forcing inside the domain is negligible.
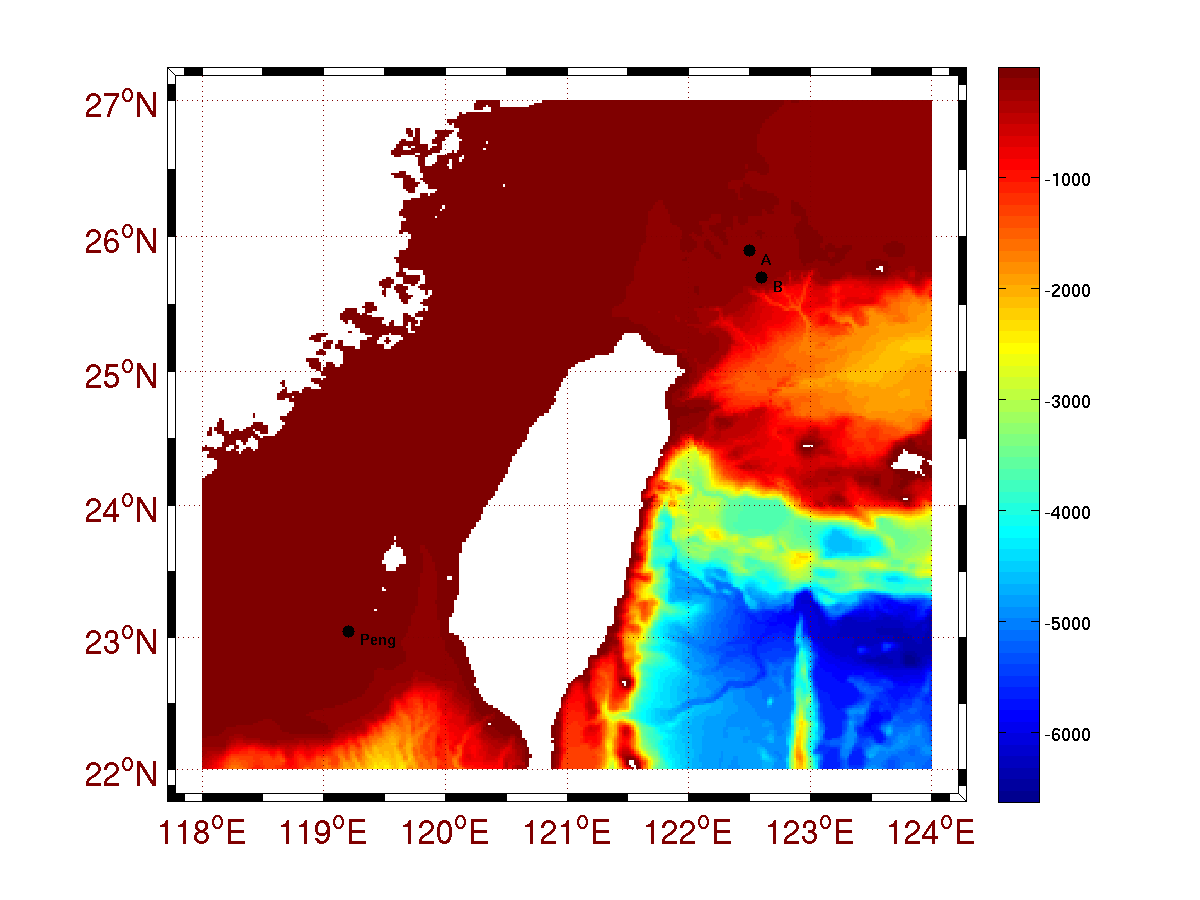
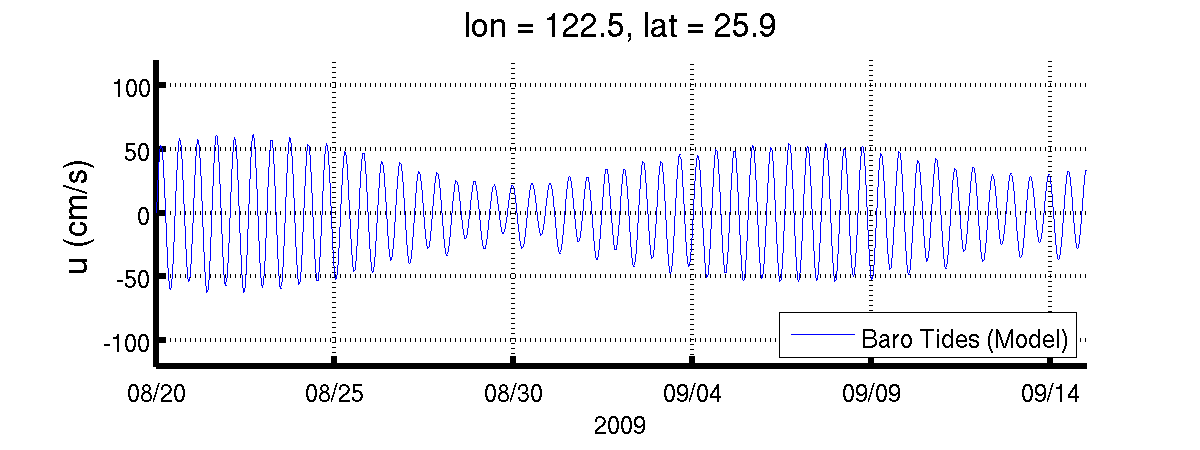
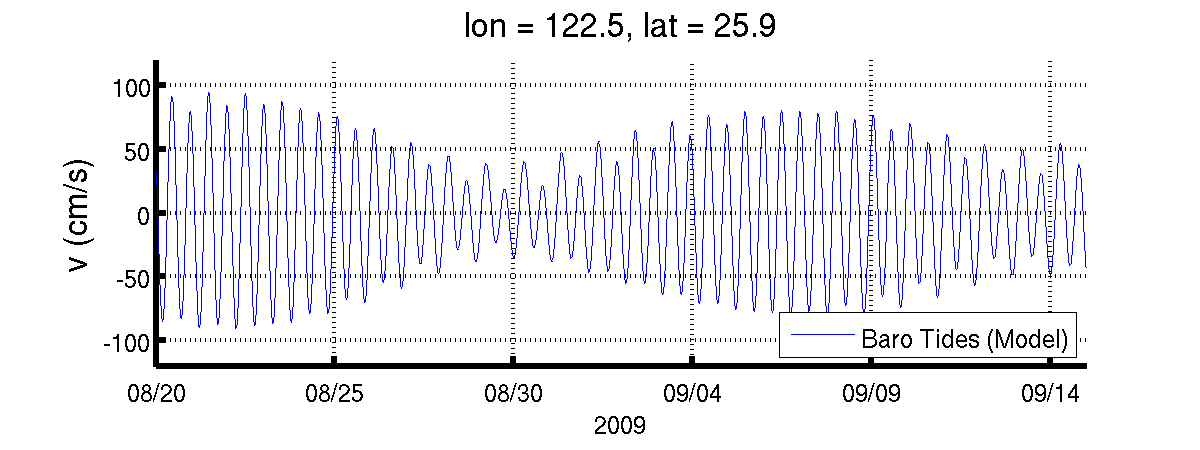
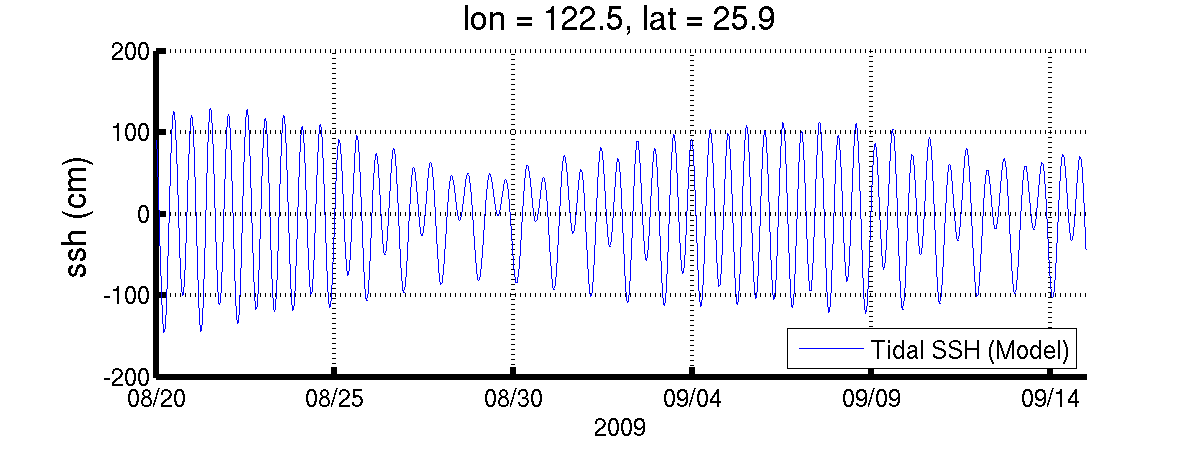
Here we provide a Matlab file containing the resulting tidal estimates for Taiwan-Kuroshio Domain and a very brief description of the contents. Below, we provide: i) Barotopic tide forecasts at sites A and B of the acoustic area, see map at right; ii) Barotropic tidal fields in the nested QPE and Taiwan-Kuroshio Domains; iii) a comparison of our tidal predictions to data; iv) Barotopic tide forecasts near the Peng-Hu islands which we forecast to be a location of strong tides, including generation of strong internal tides/waves.
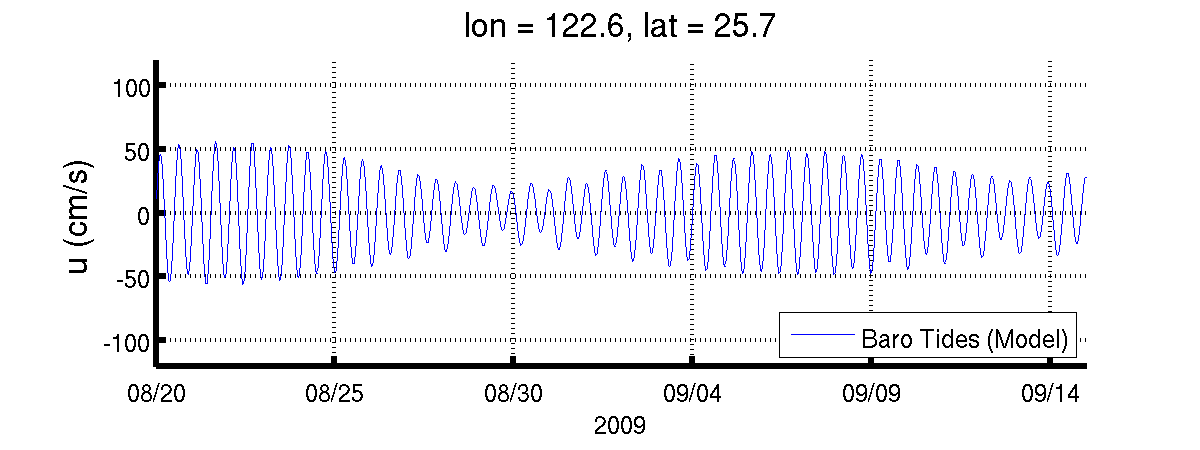
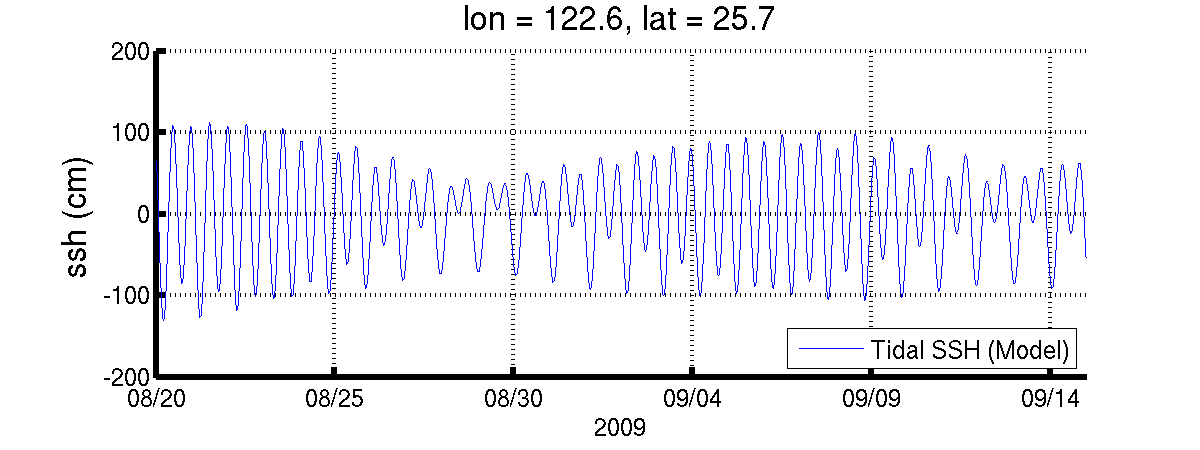
| Site A: U and V components of velocity, sea surface height |
|
| Site B: U and V components of velocity, sea surface height |

|
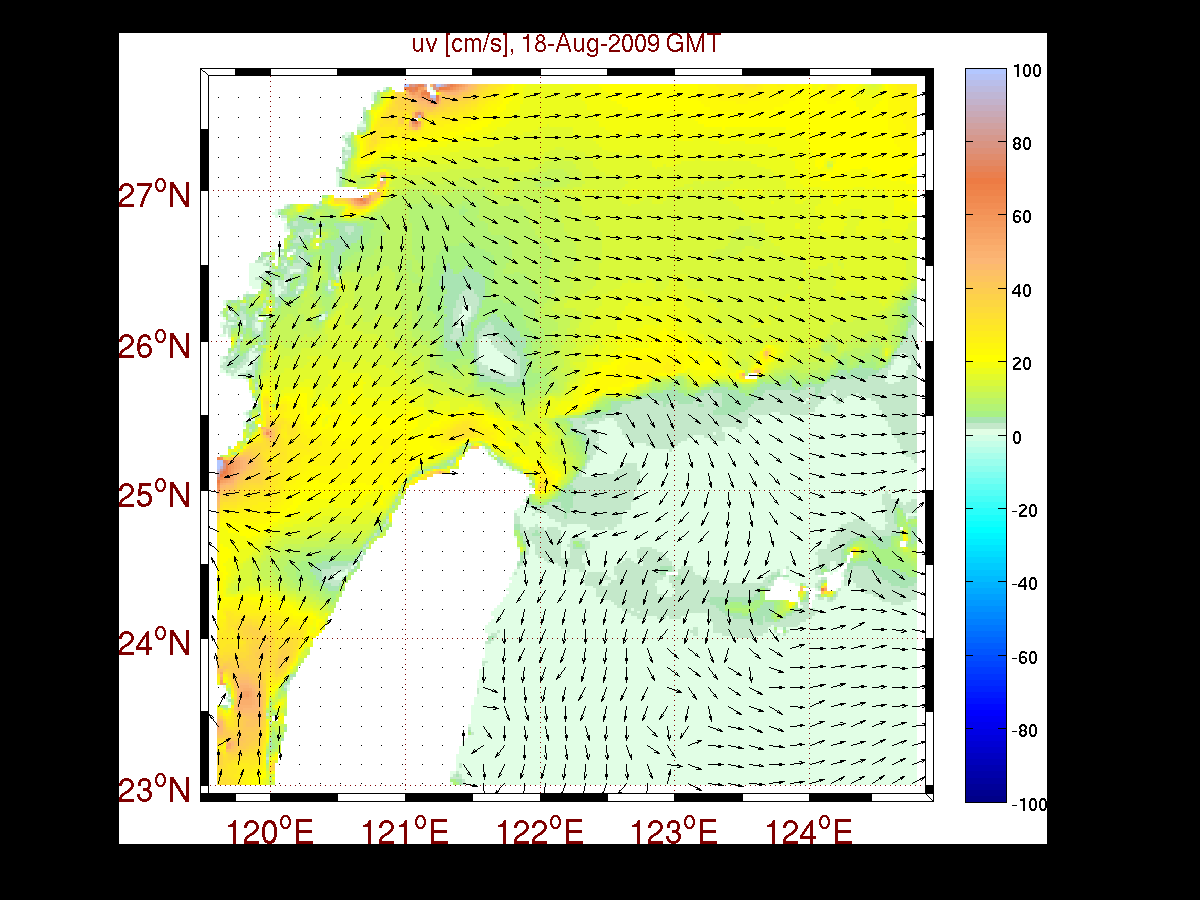
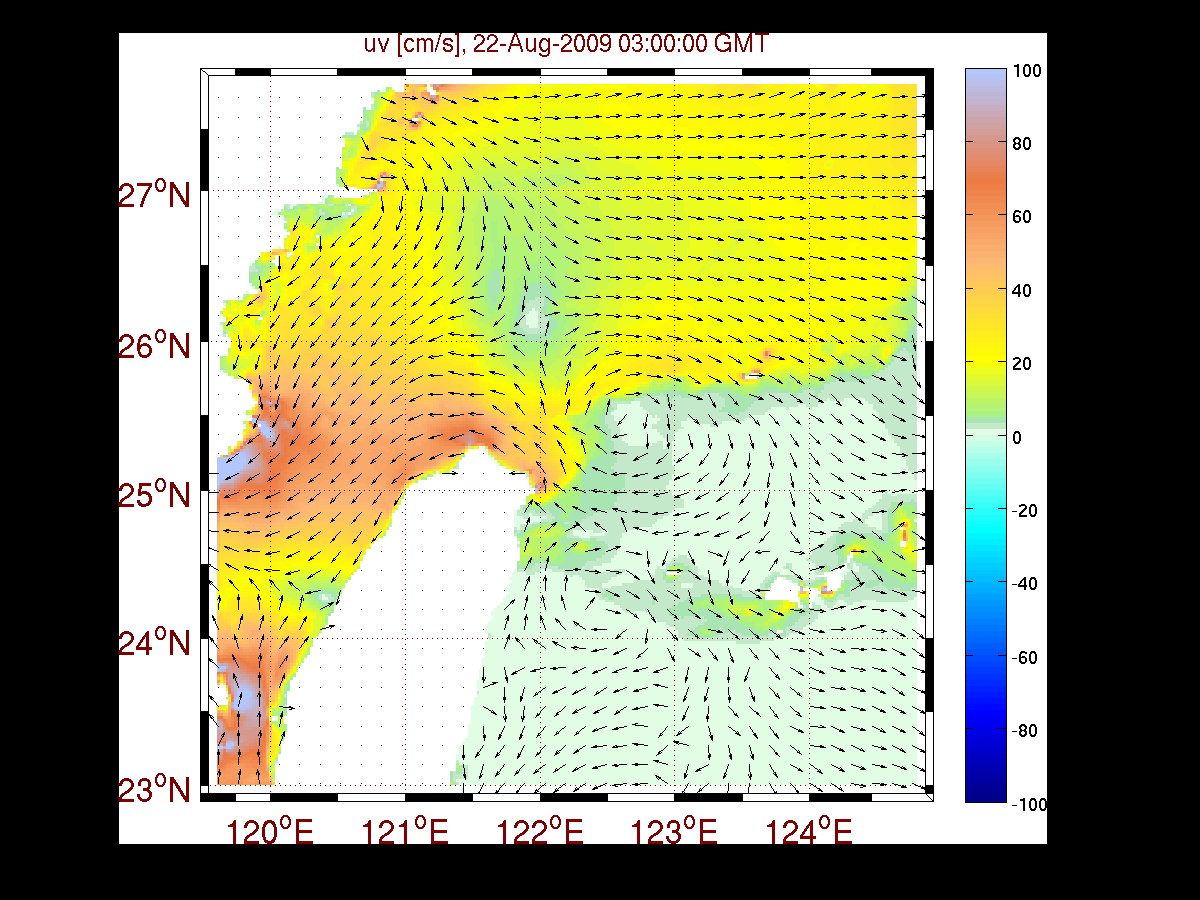
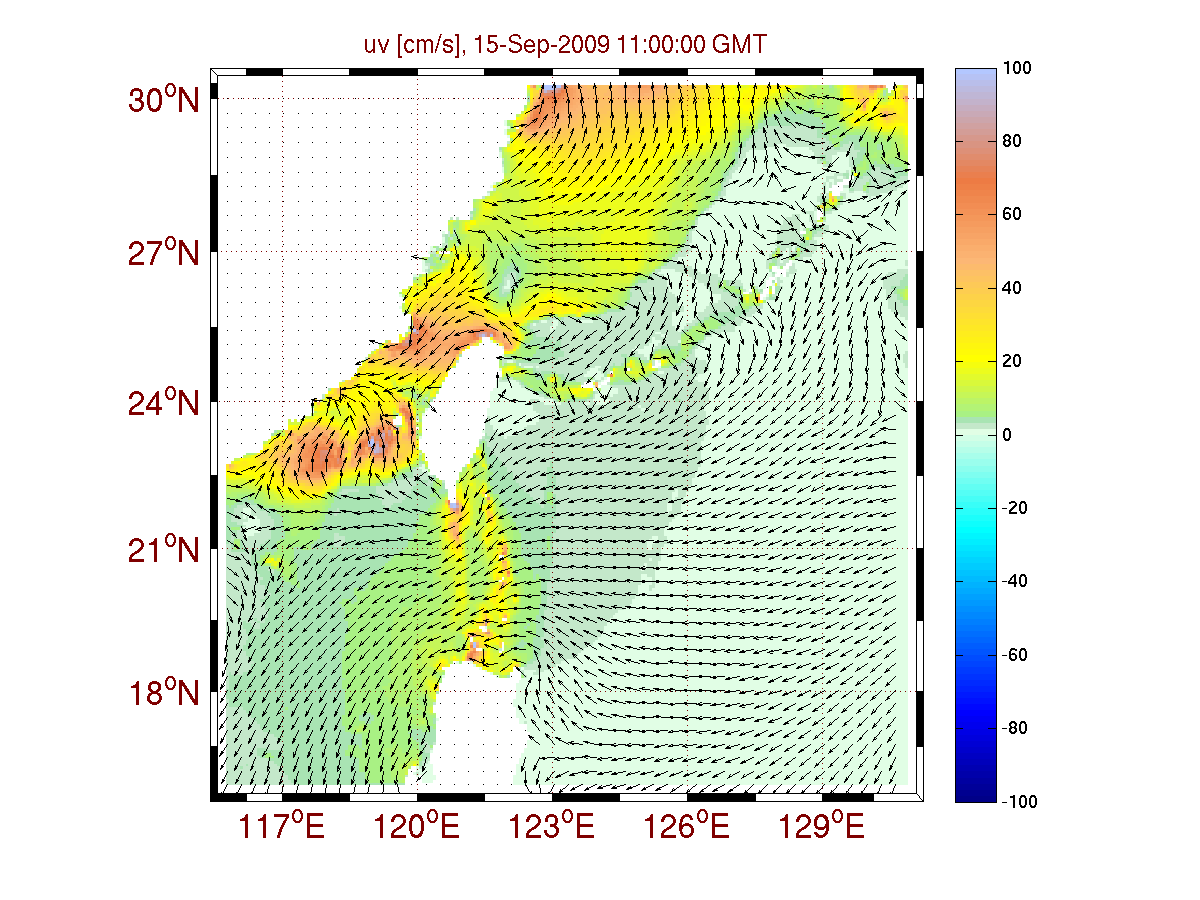
The evolution of the barotropic tidal flow field is shown in the movies below.
3-hour snapshots from 3-12 September are found here.
| QPE Domain | 18 - 22 Aug | 22 - 26 Aug | 26 - 30 Aug | 30 Aug - 3 Sep |
 |
 |
 |
 |
|
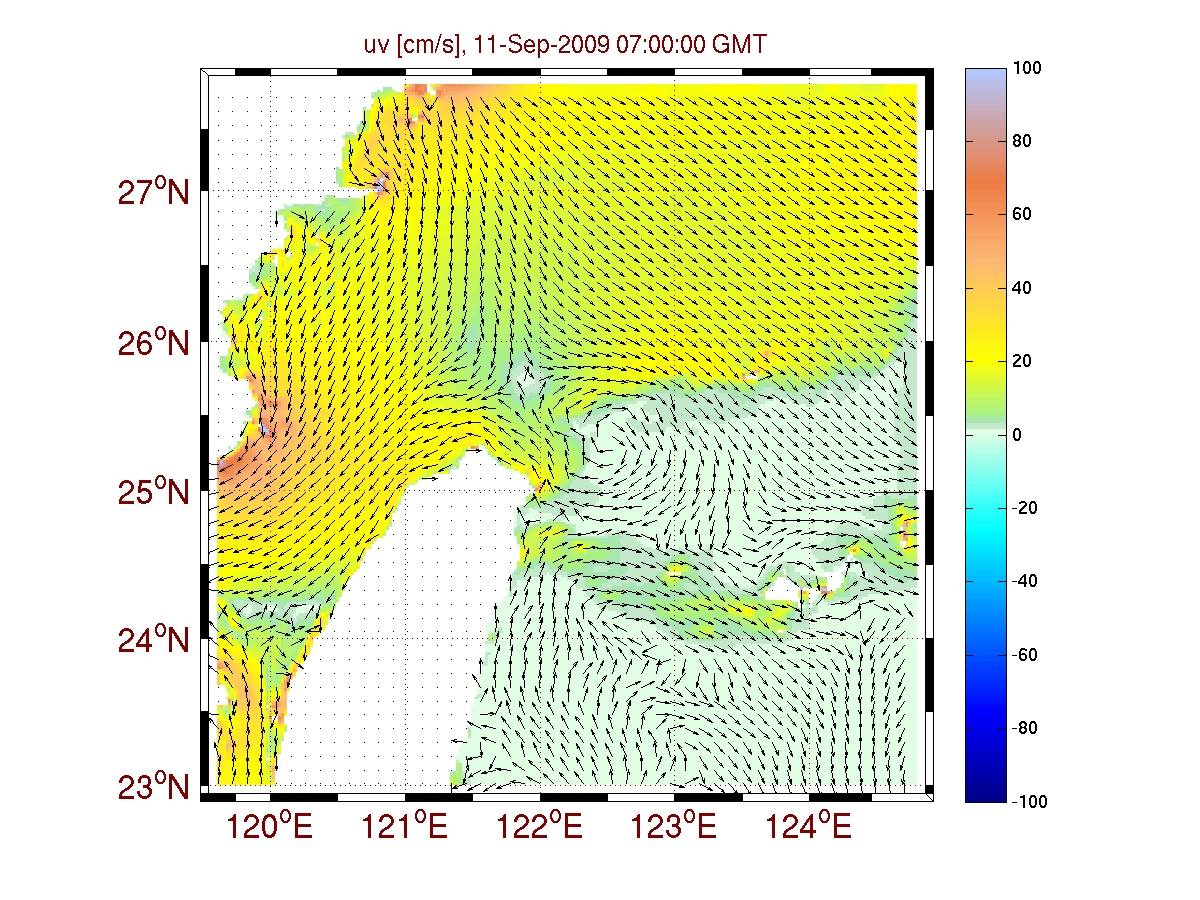
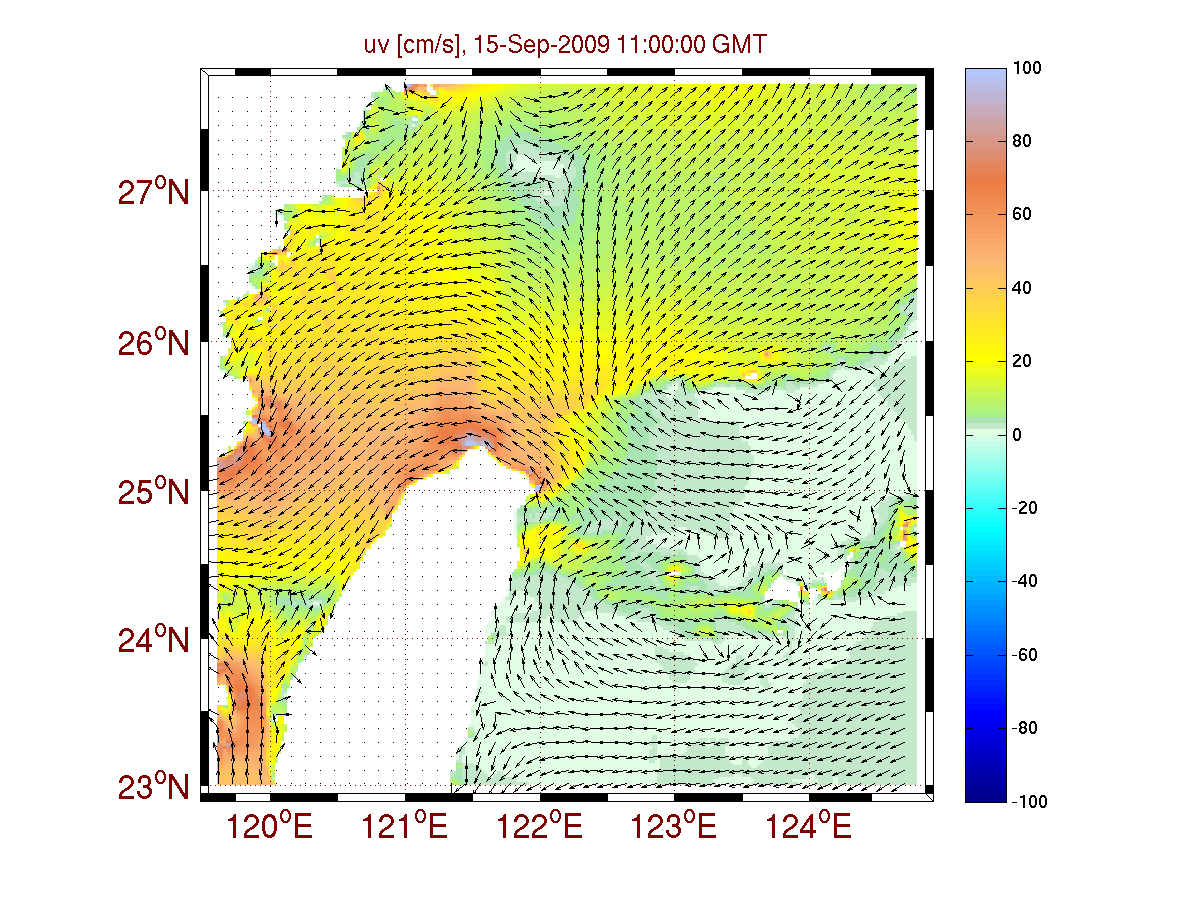
| 3 - 7 Sep | 7 - 11 Sep | 11 - 15 Sep | 15 - 16 Sep | |
 |
 |
 |
 |
|
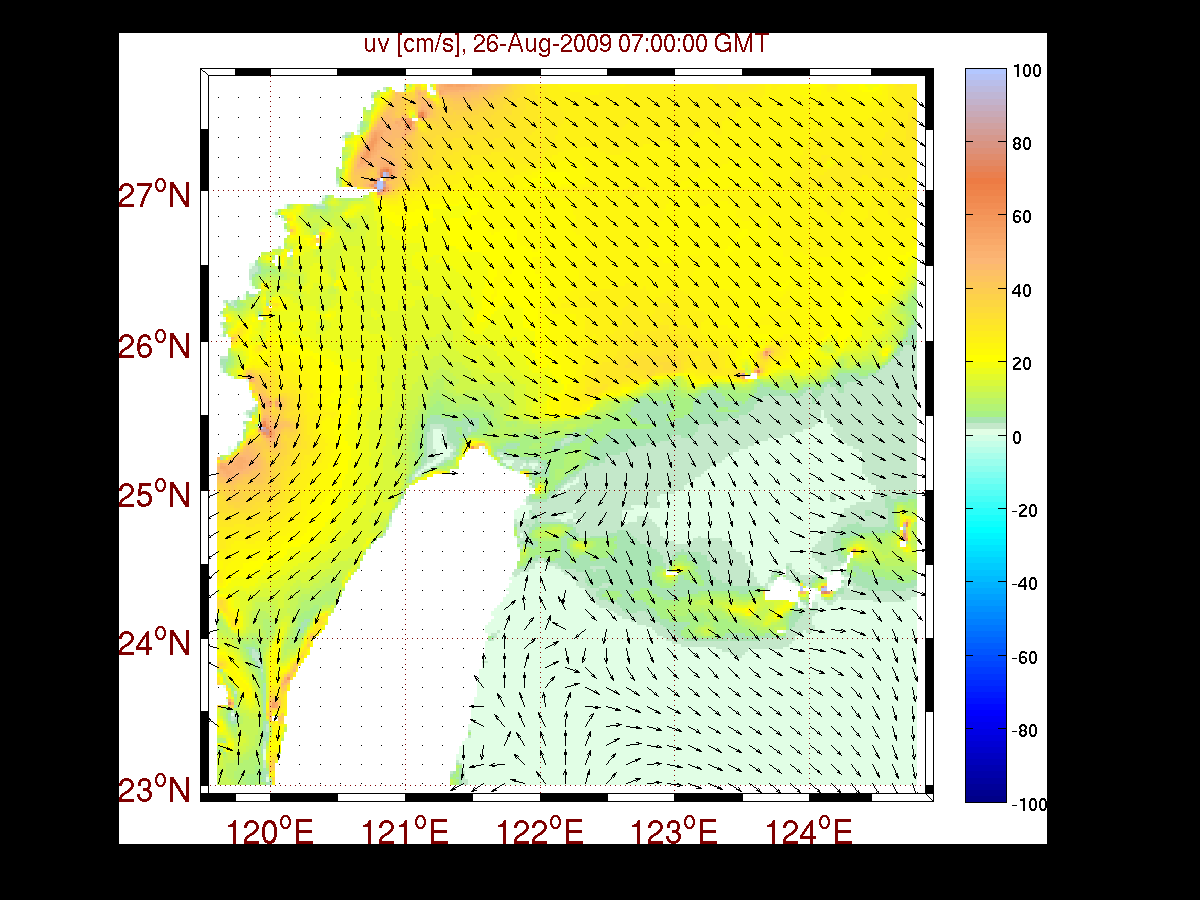
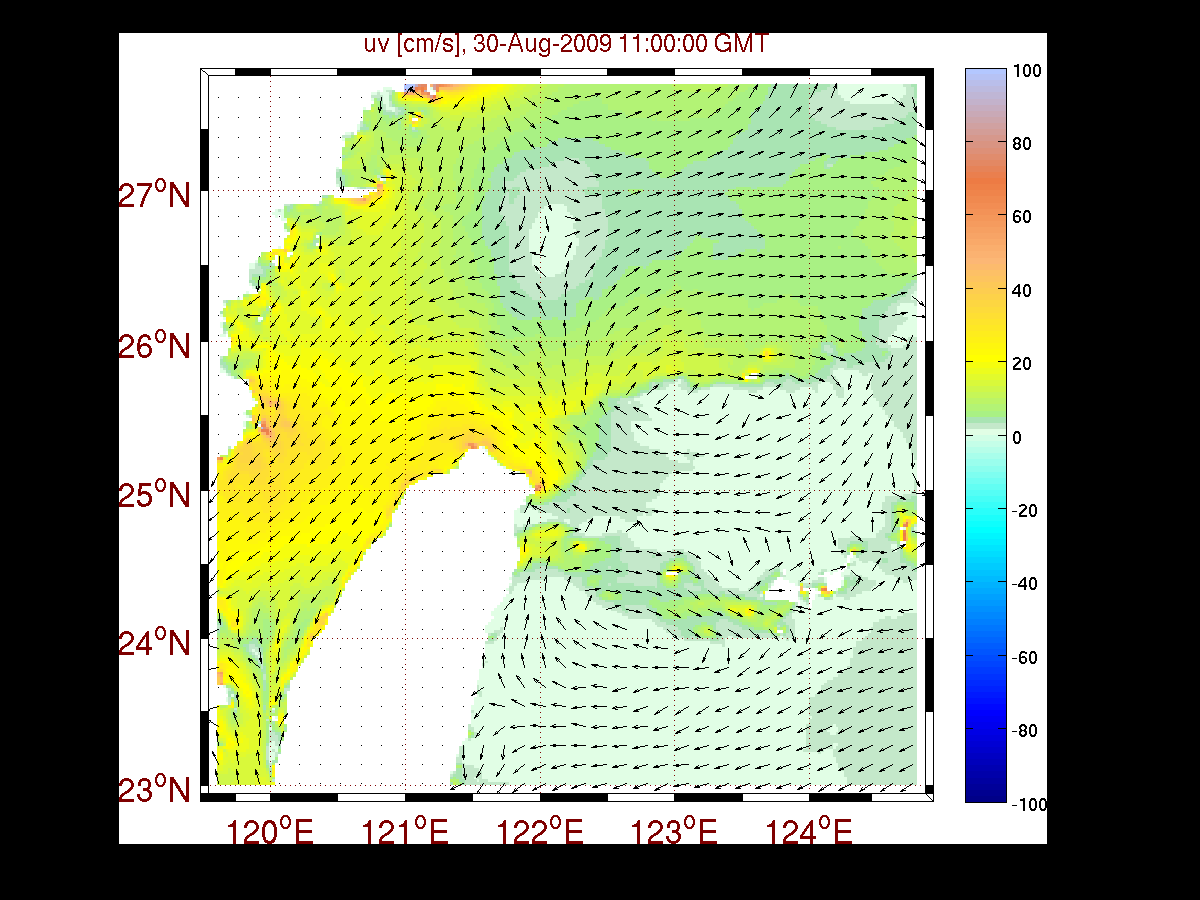
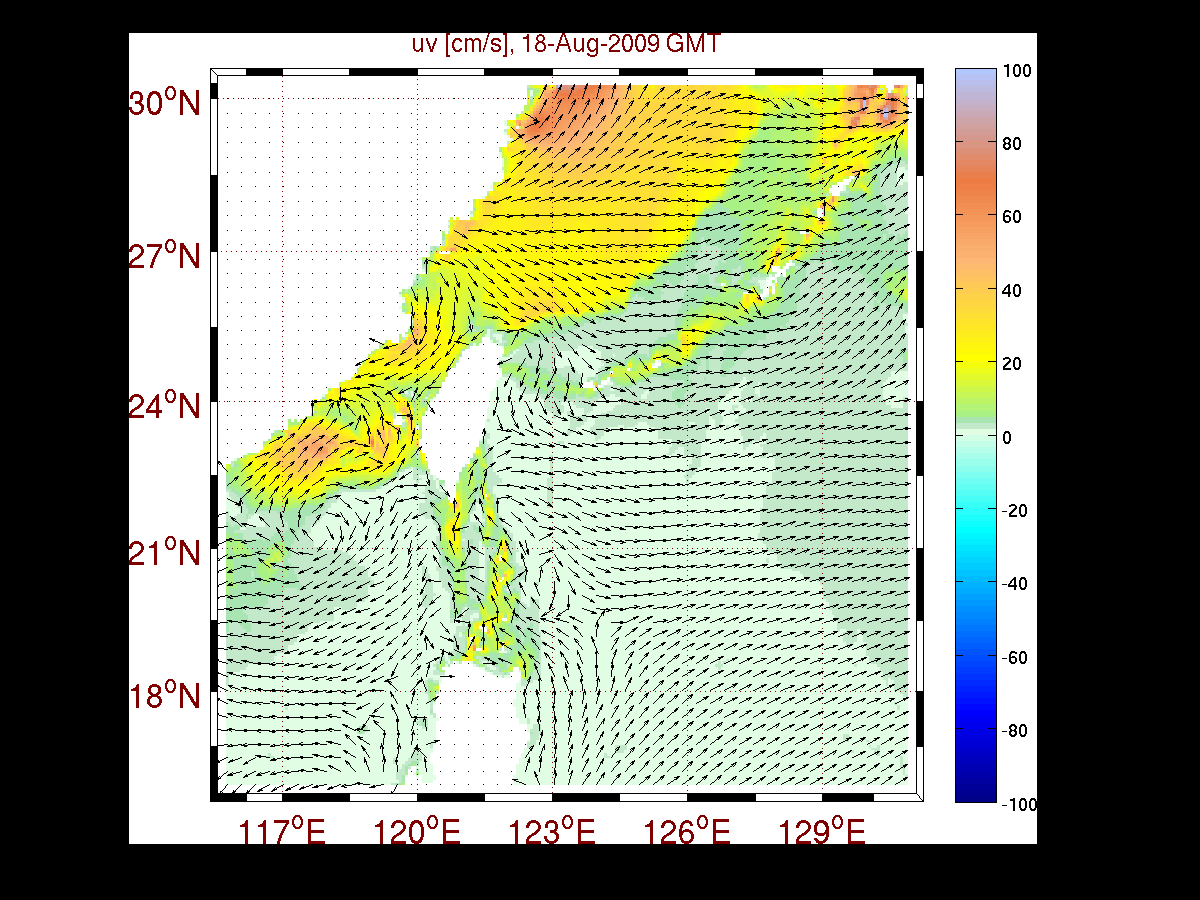
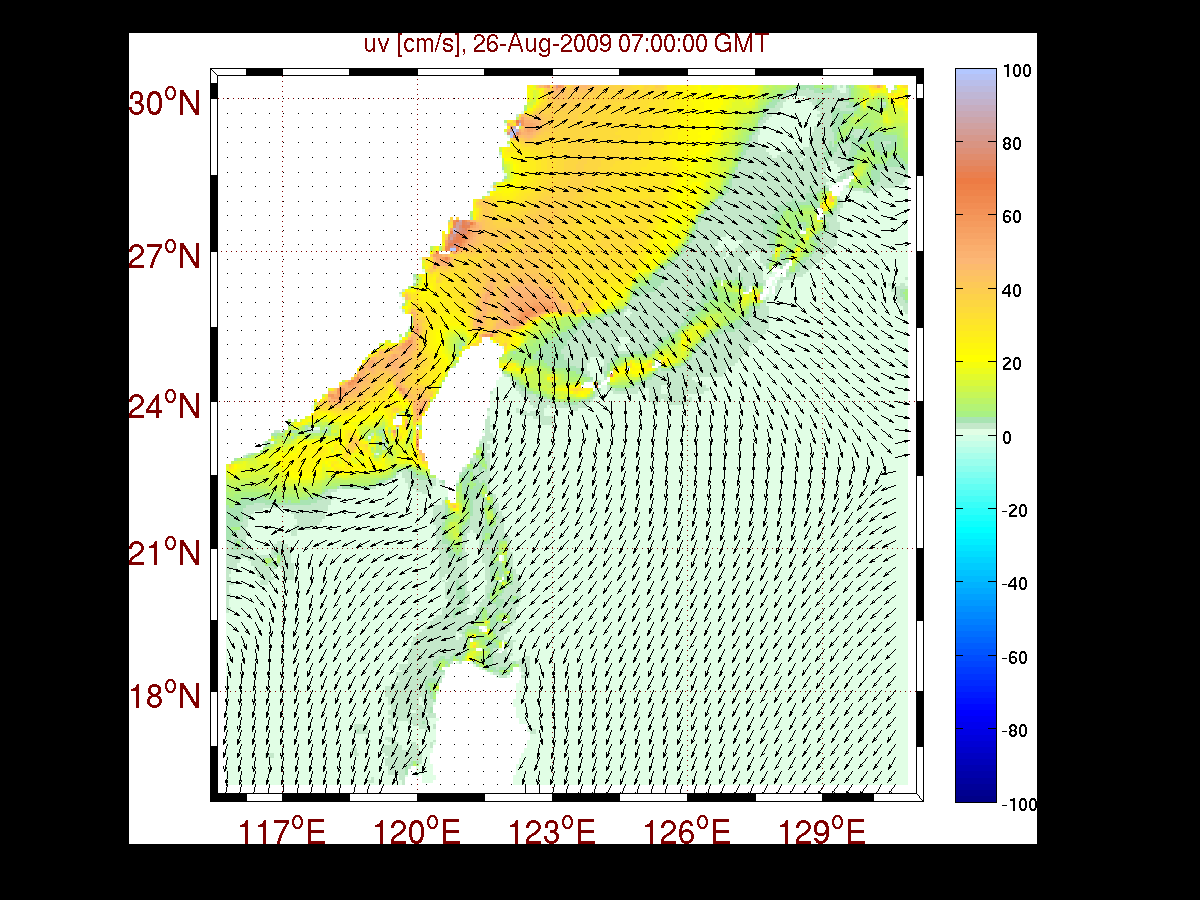
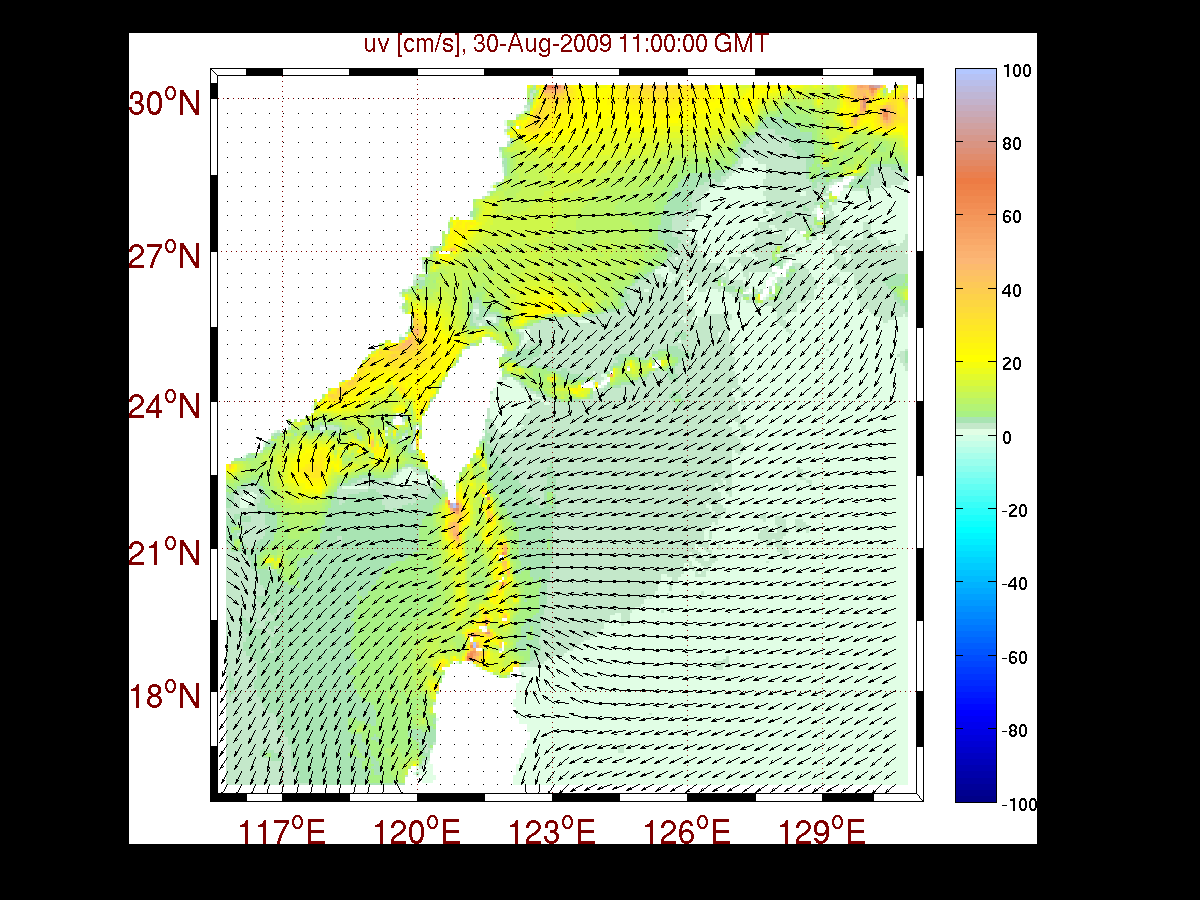
| Taiwan-Kuroshio Domain | 18 - 22 Aug | 22 - 26 Aug | 26 - 30 Aug | 30 Aug - 3 Sep |
 |
 |
 |
 |
|
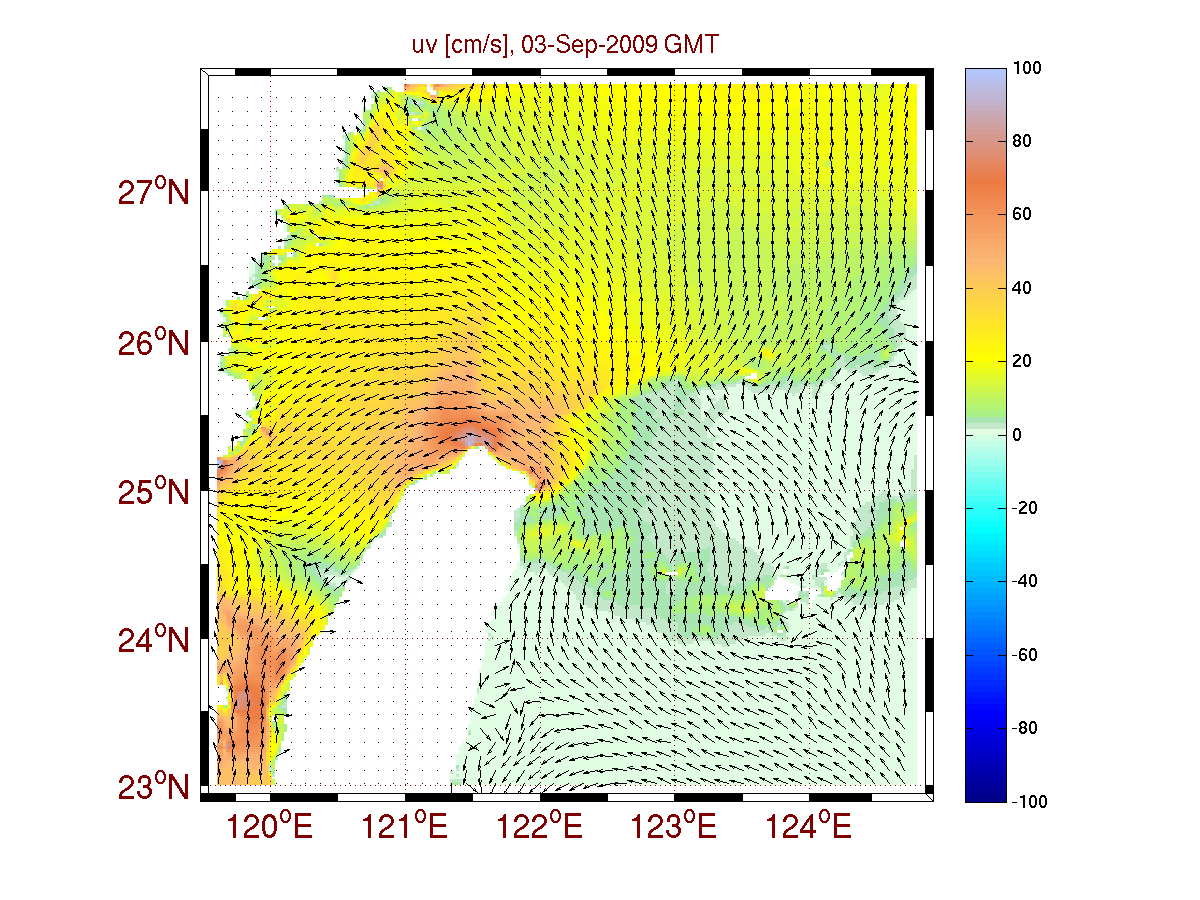
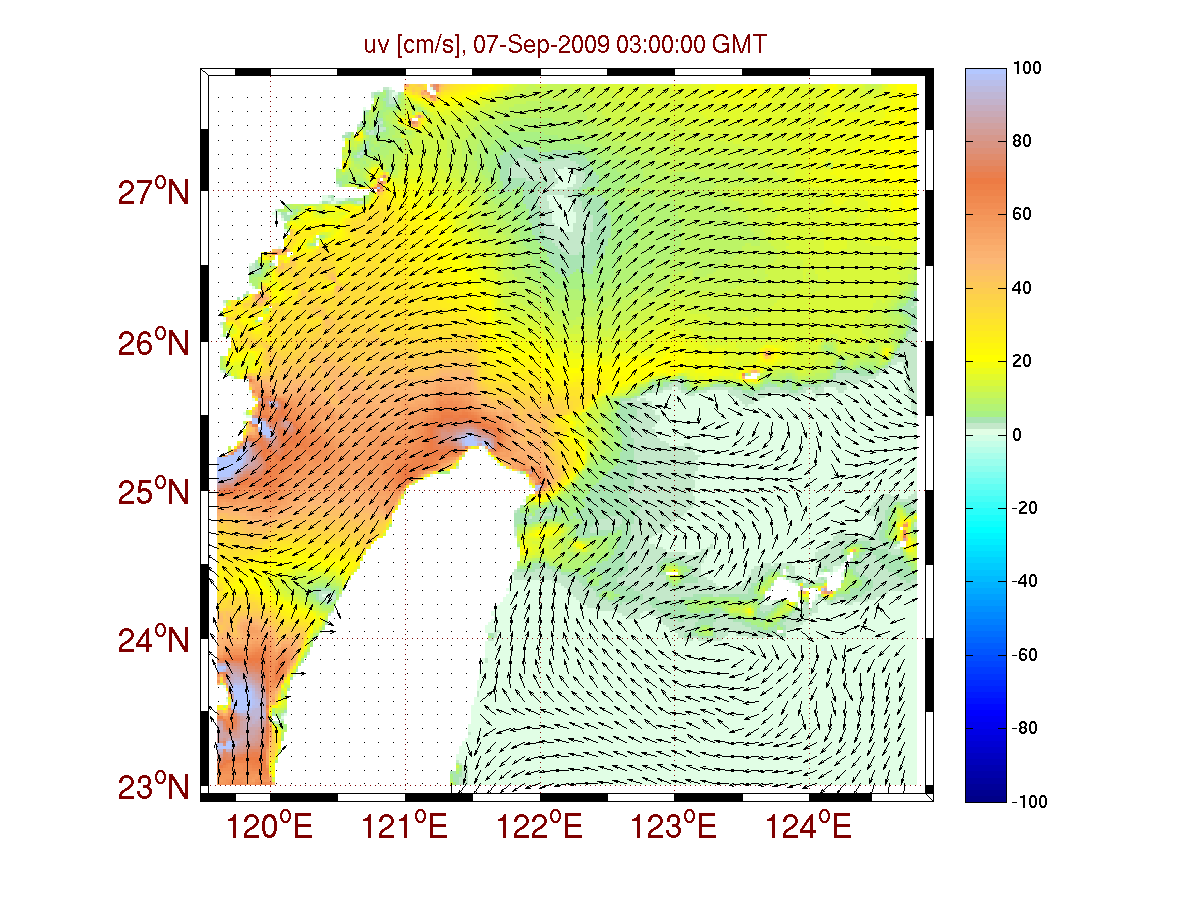
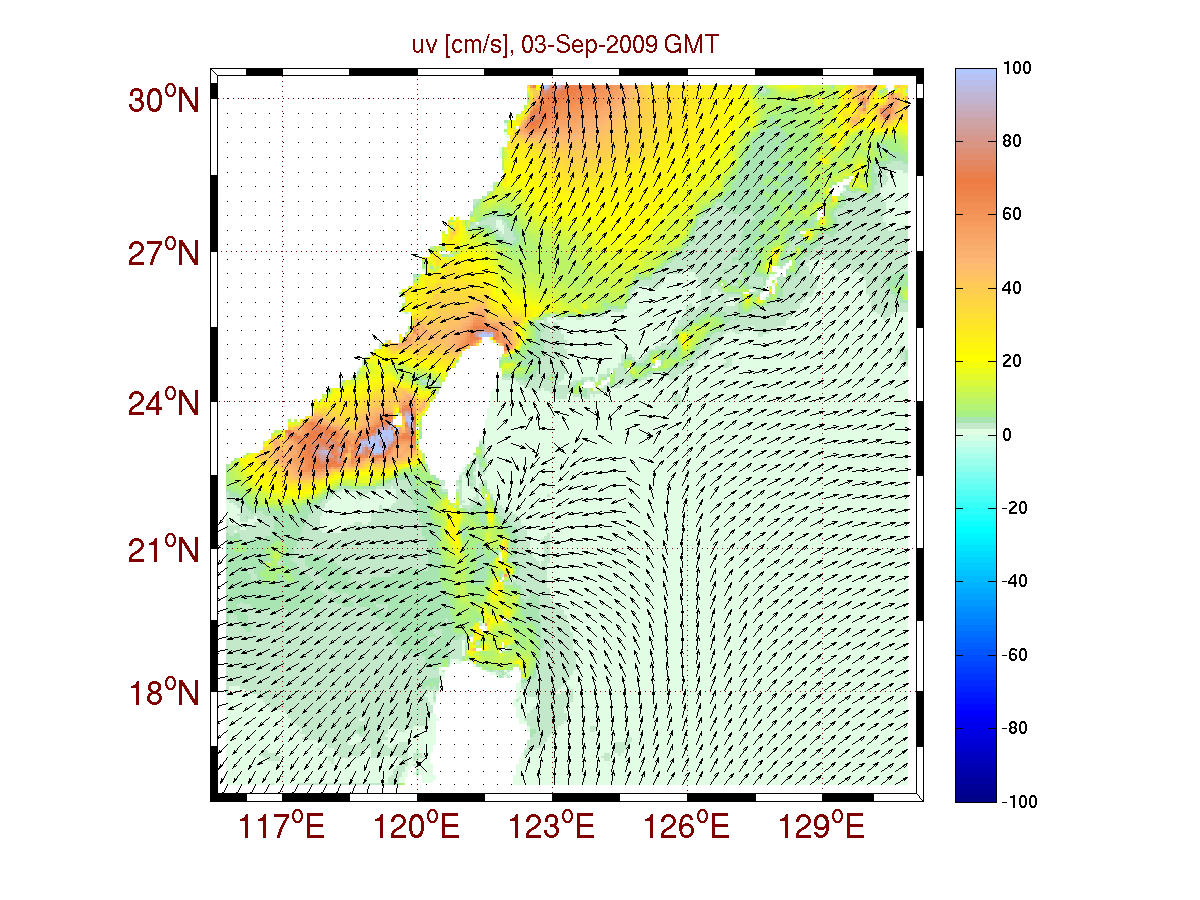
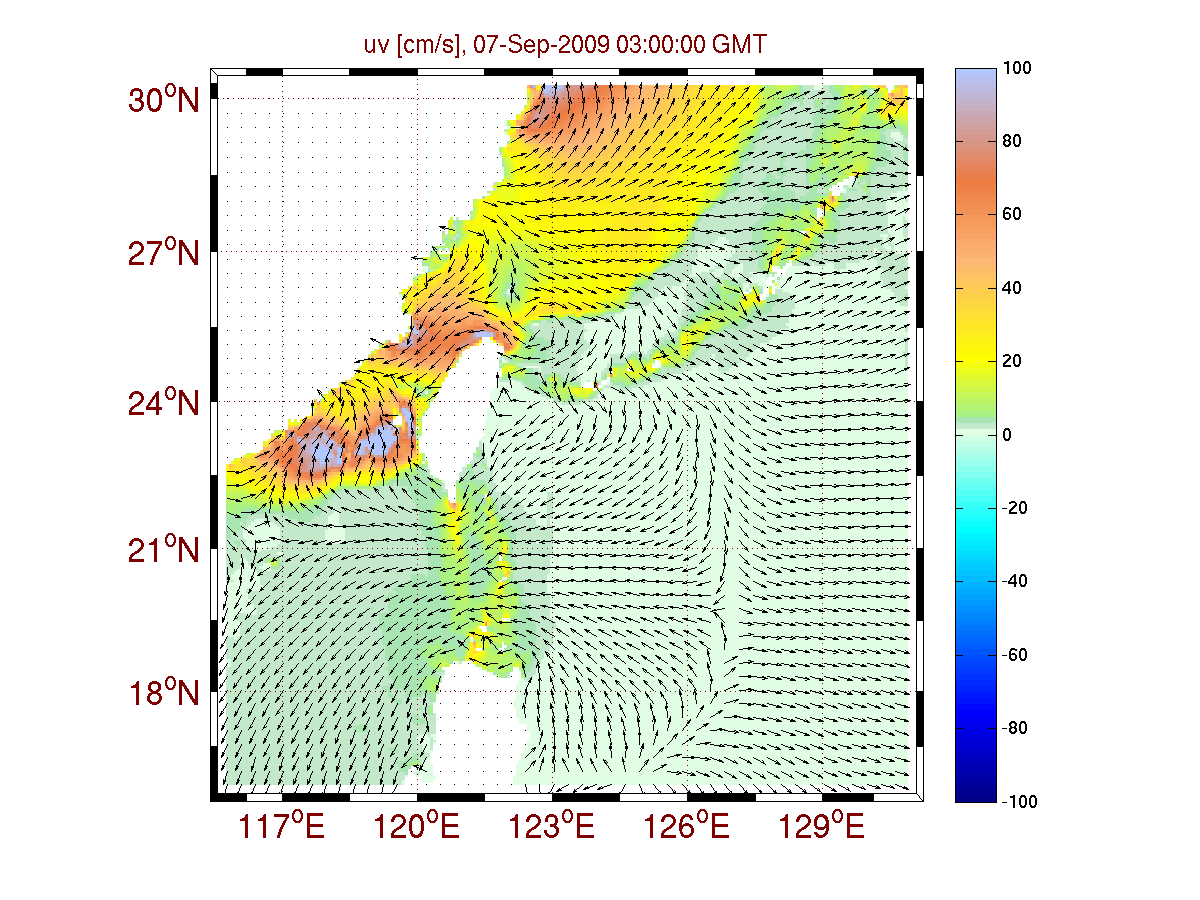
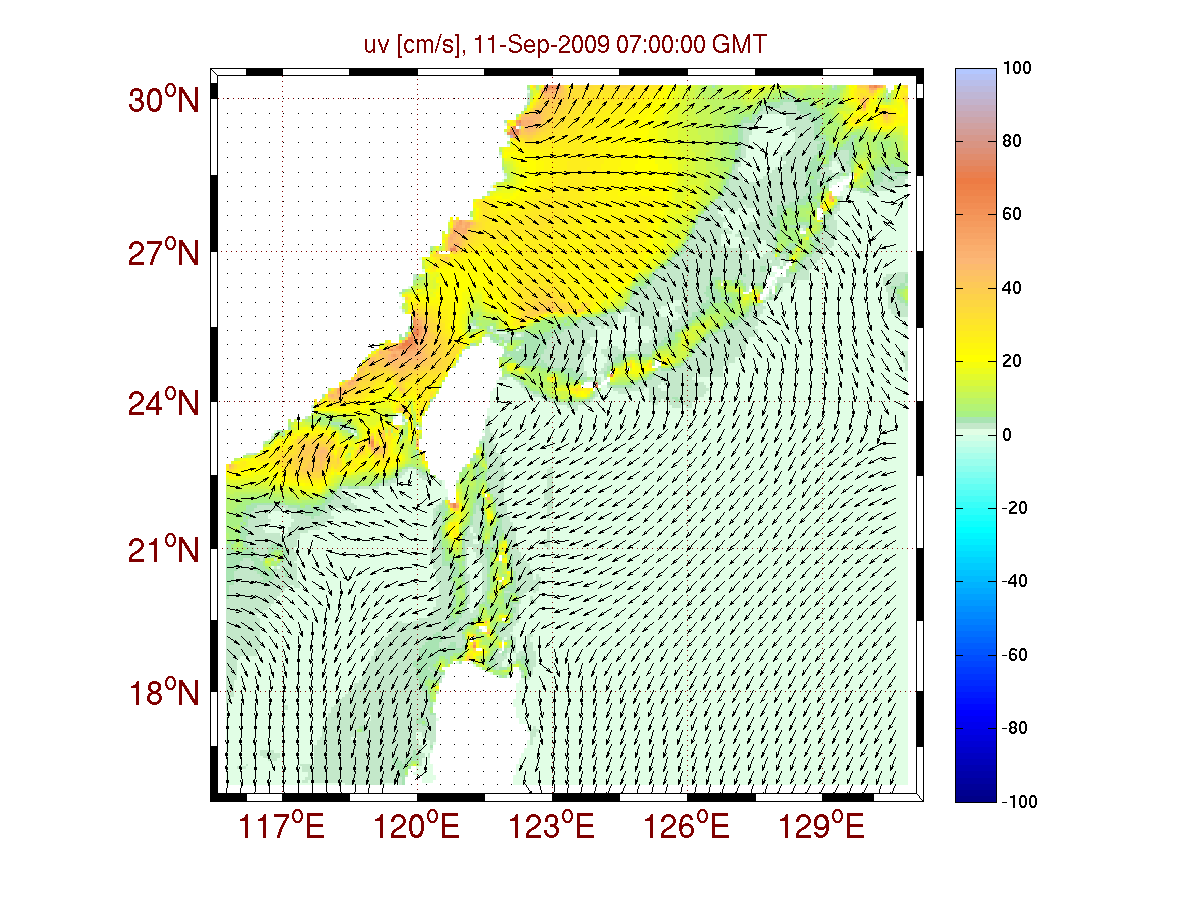
| 3 - 7 Sep | 7 - 11 Sep | 11 - 15 Sep | 15 - 16 Sep | |
 |
 |
 |
 |
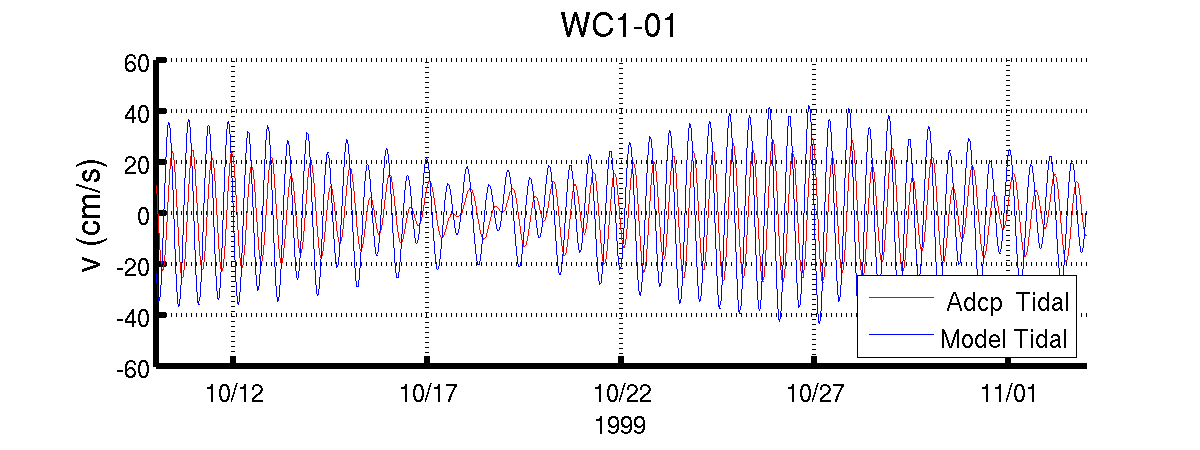
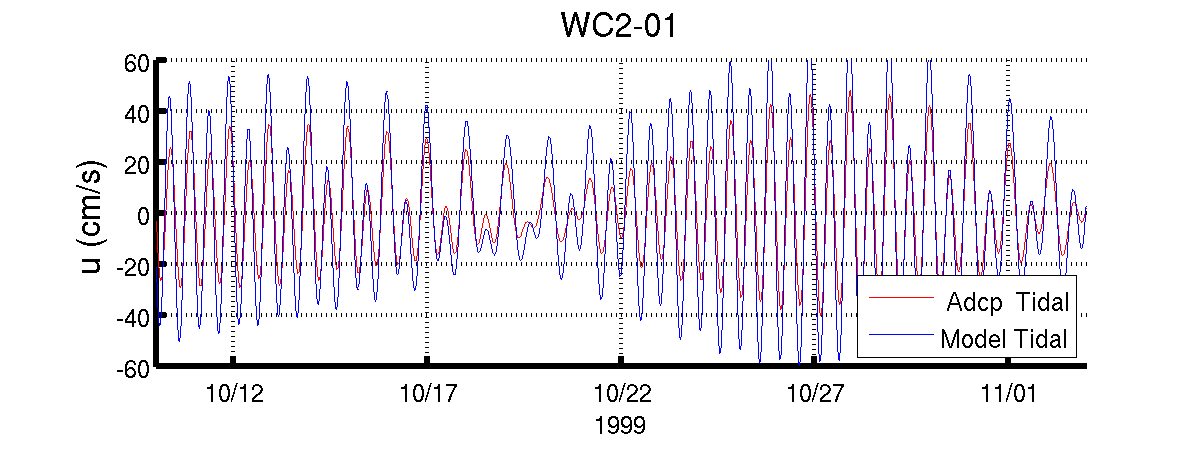
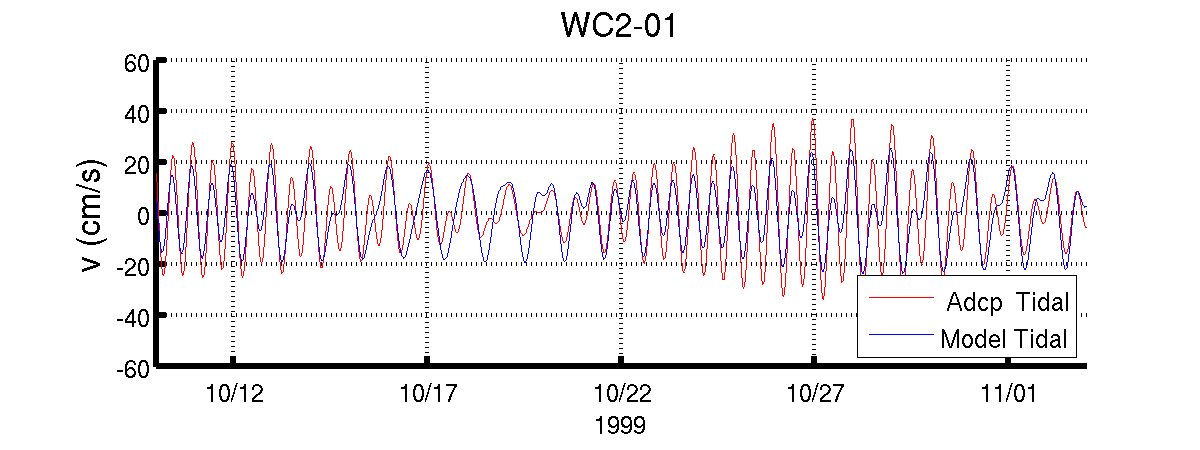
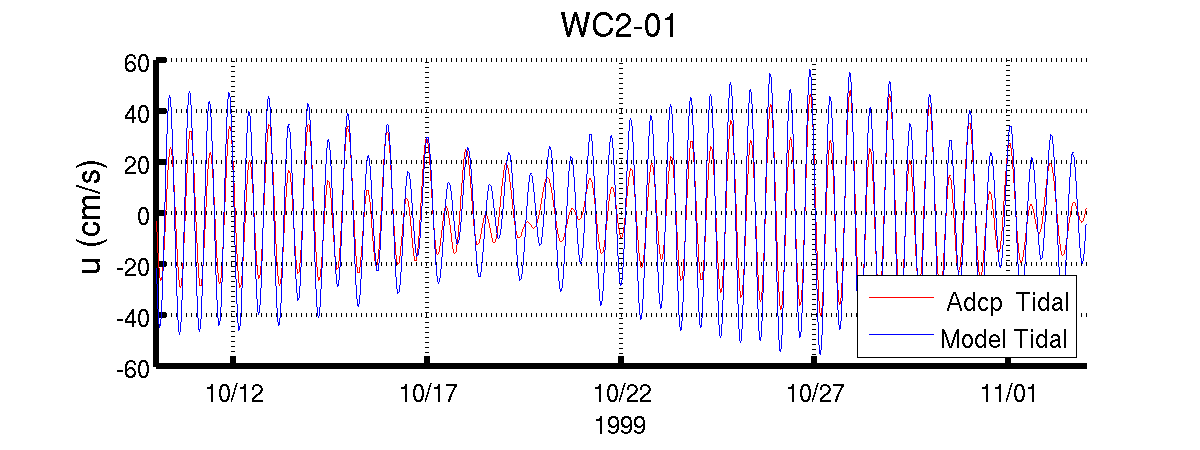
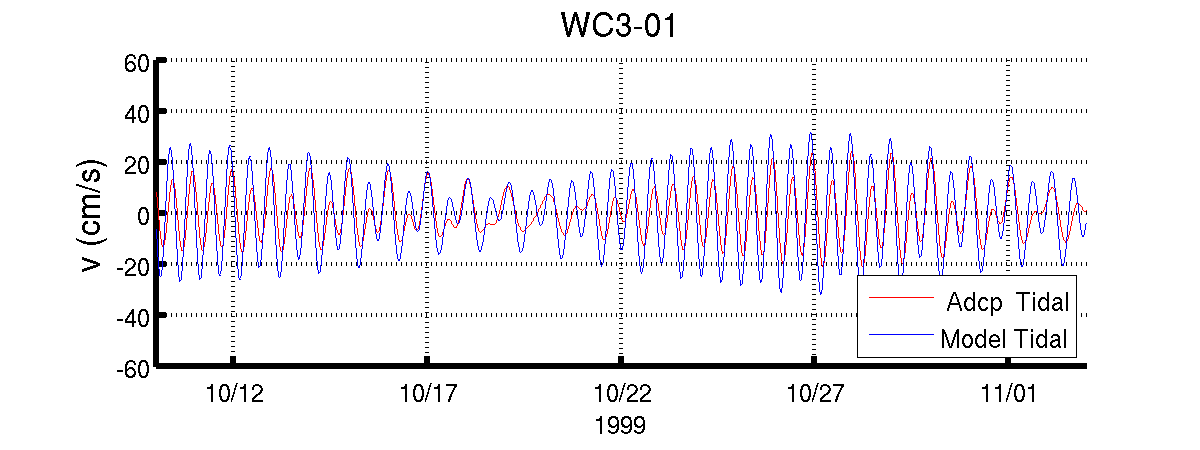
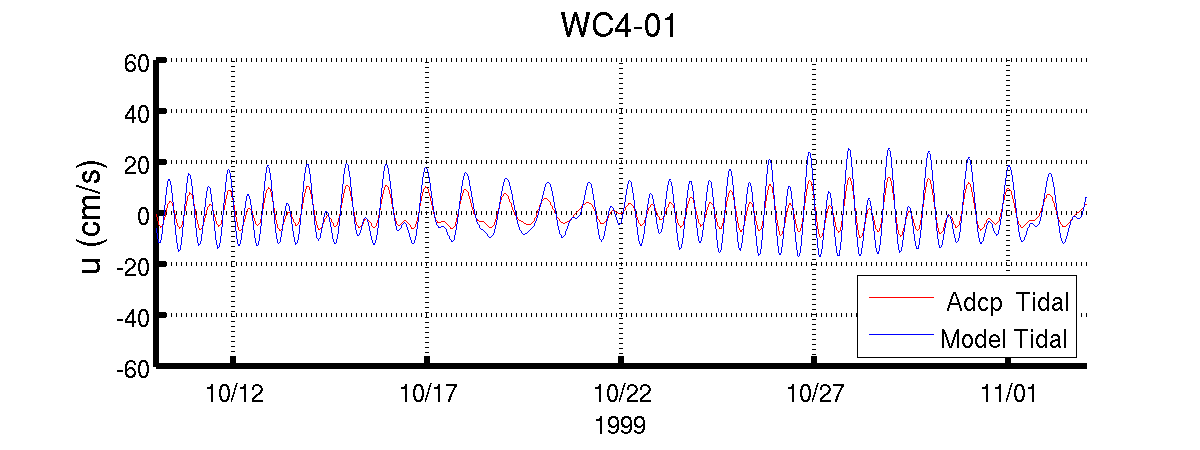
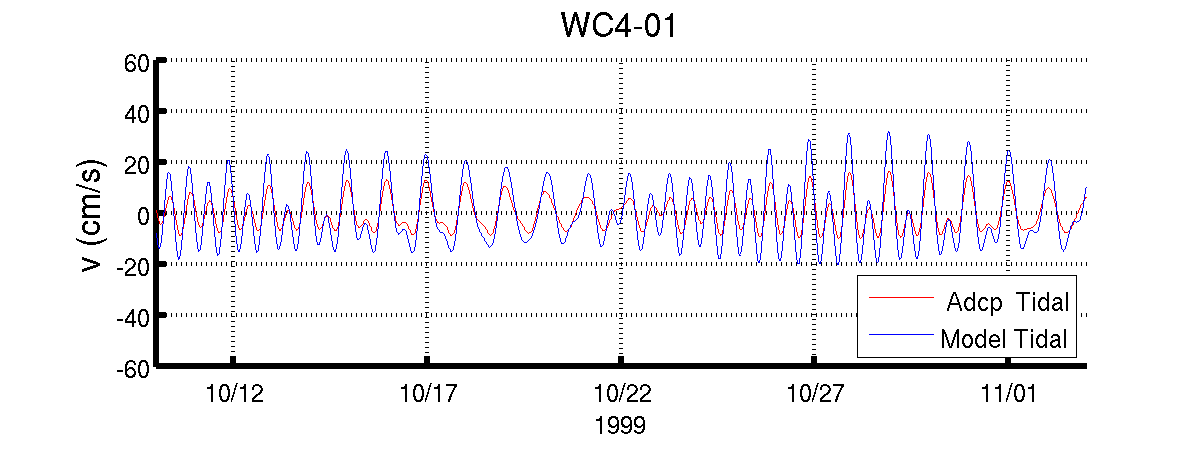
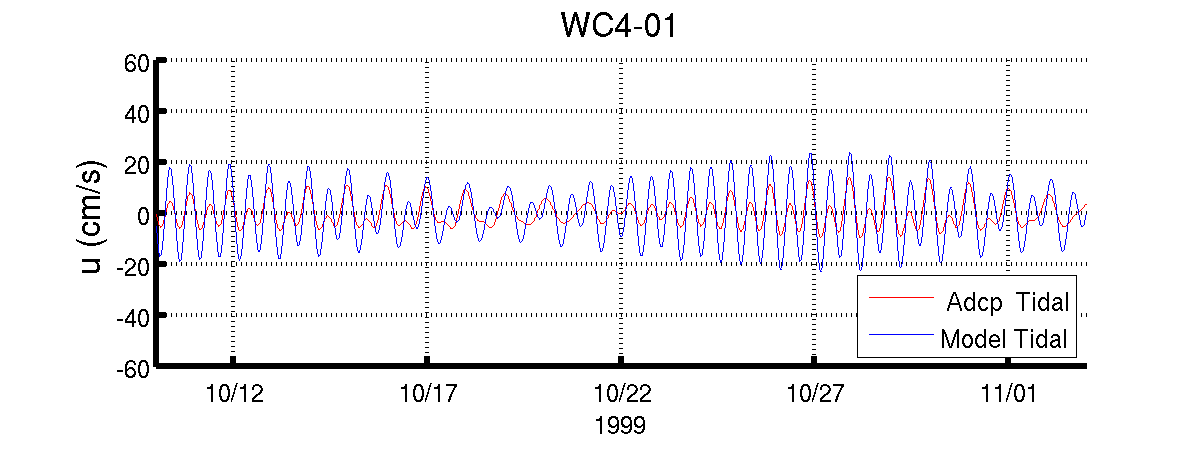
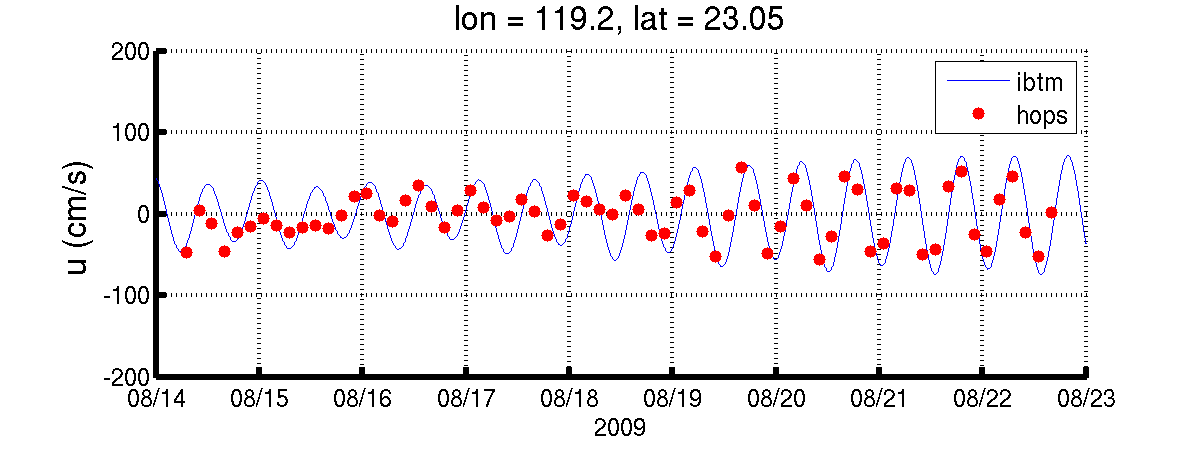
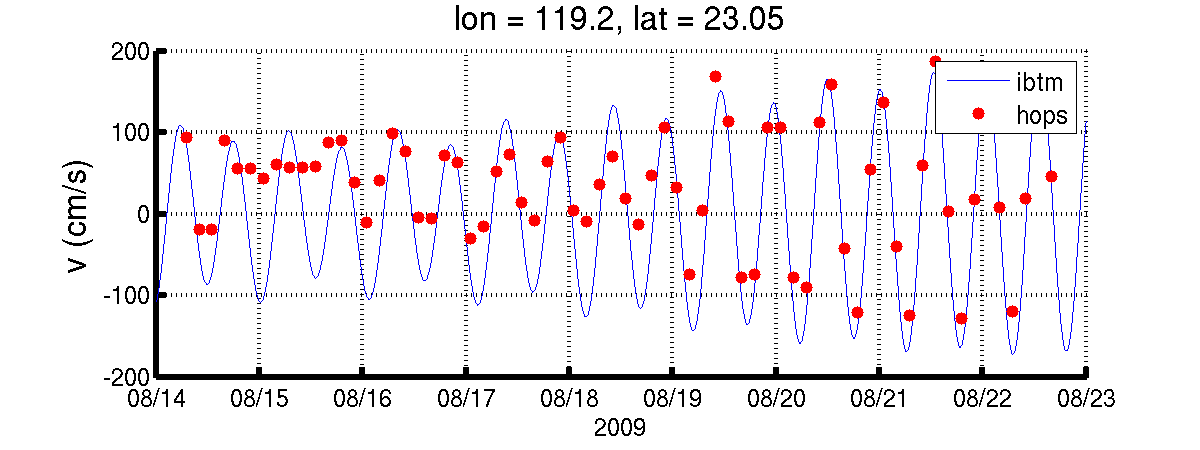
The above are the barotropic tidal estimates only. The in situ velocity values should be depth averaged and filtered before comparing against these model fields.
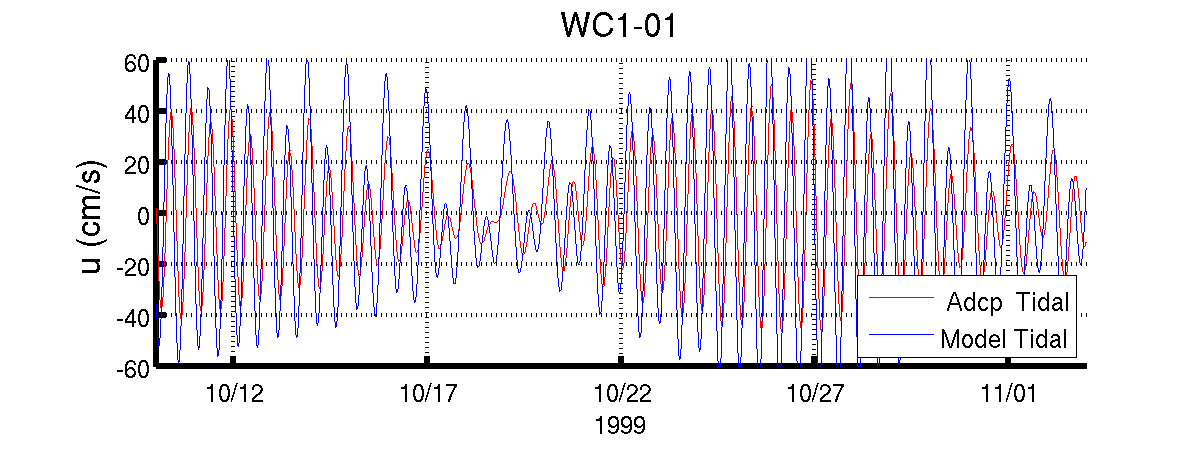
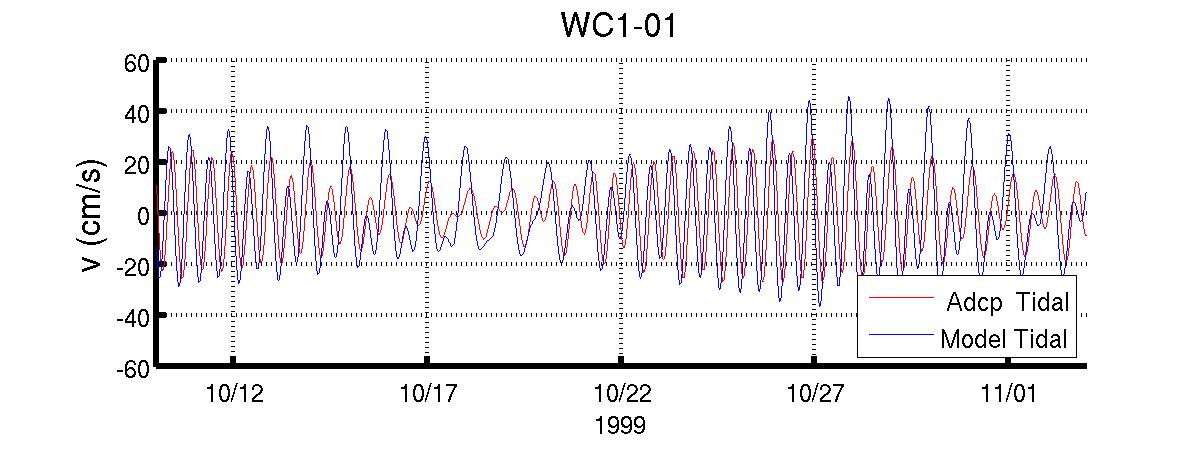
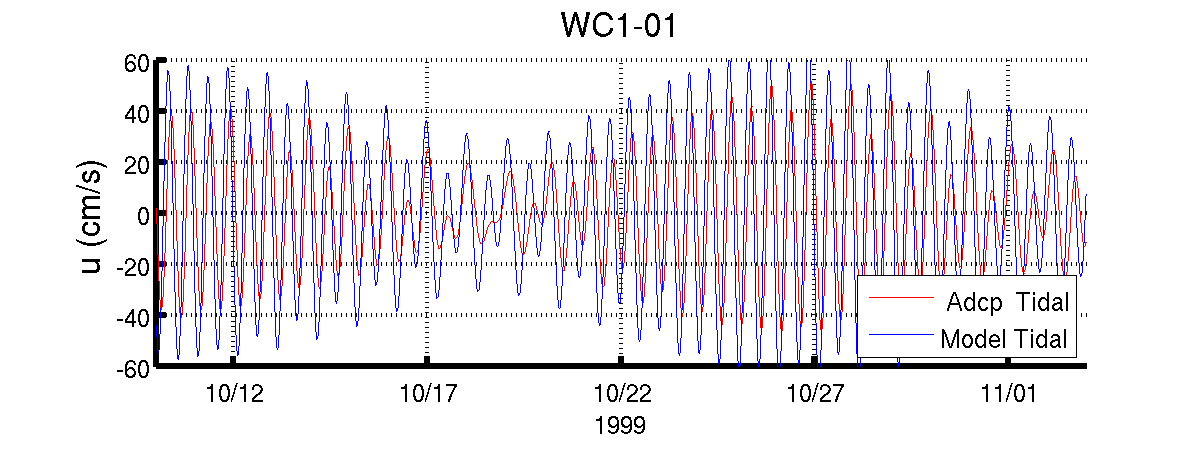
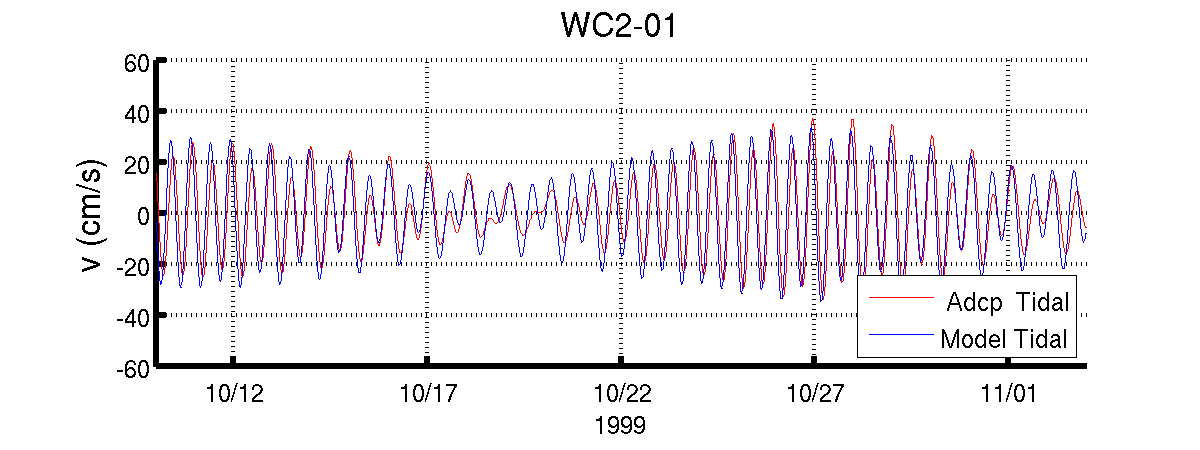
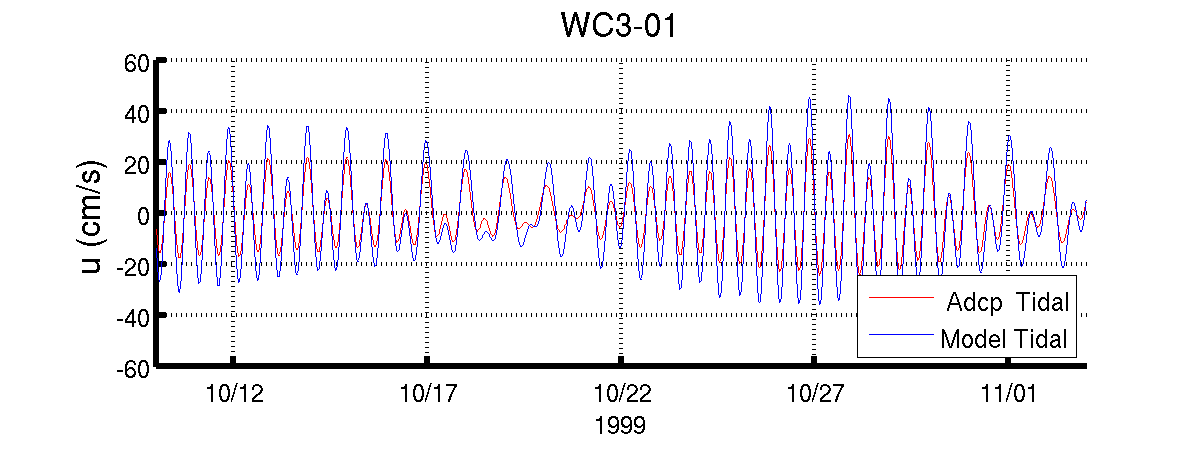
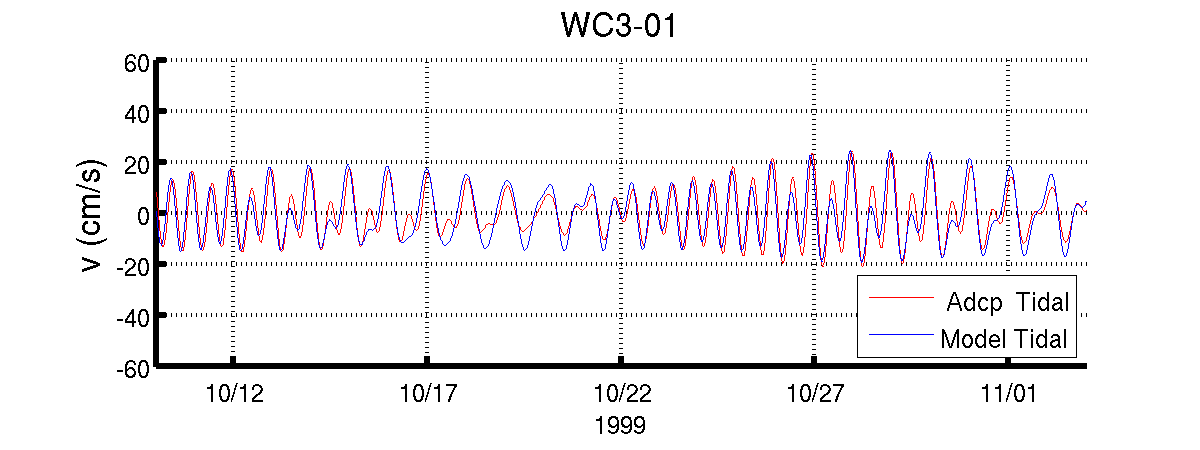
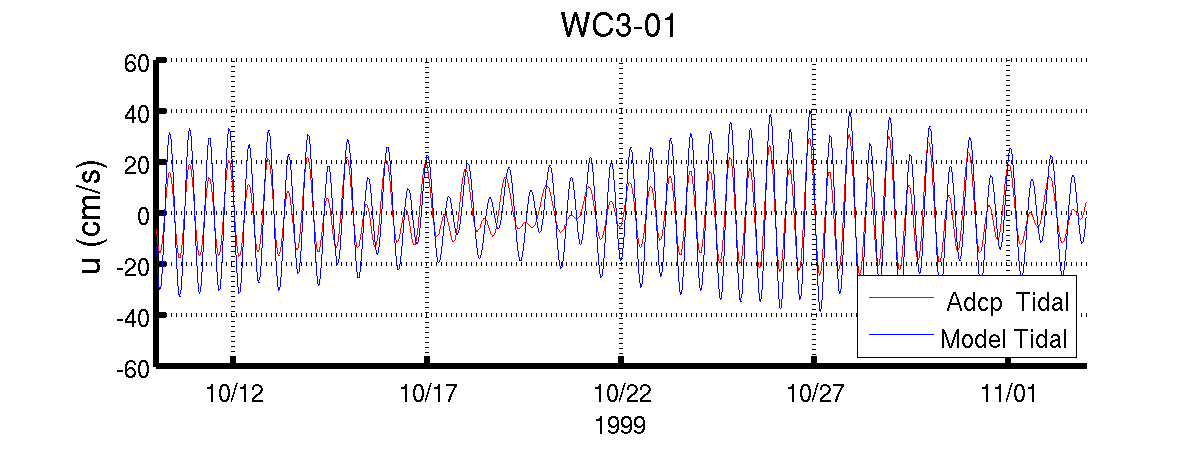
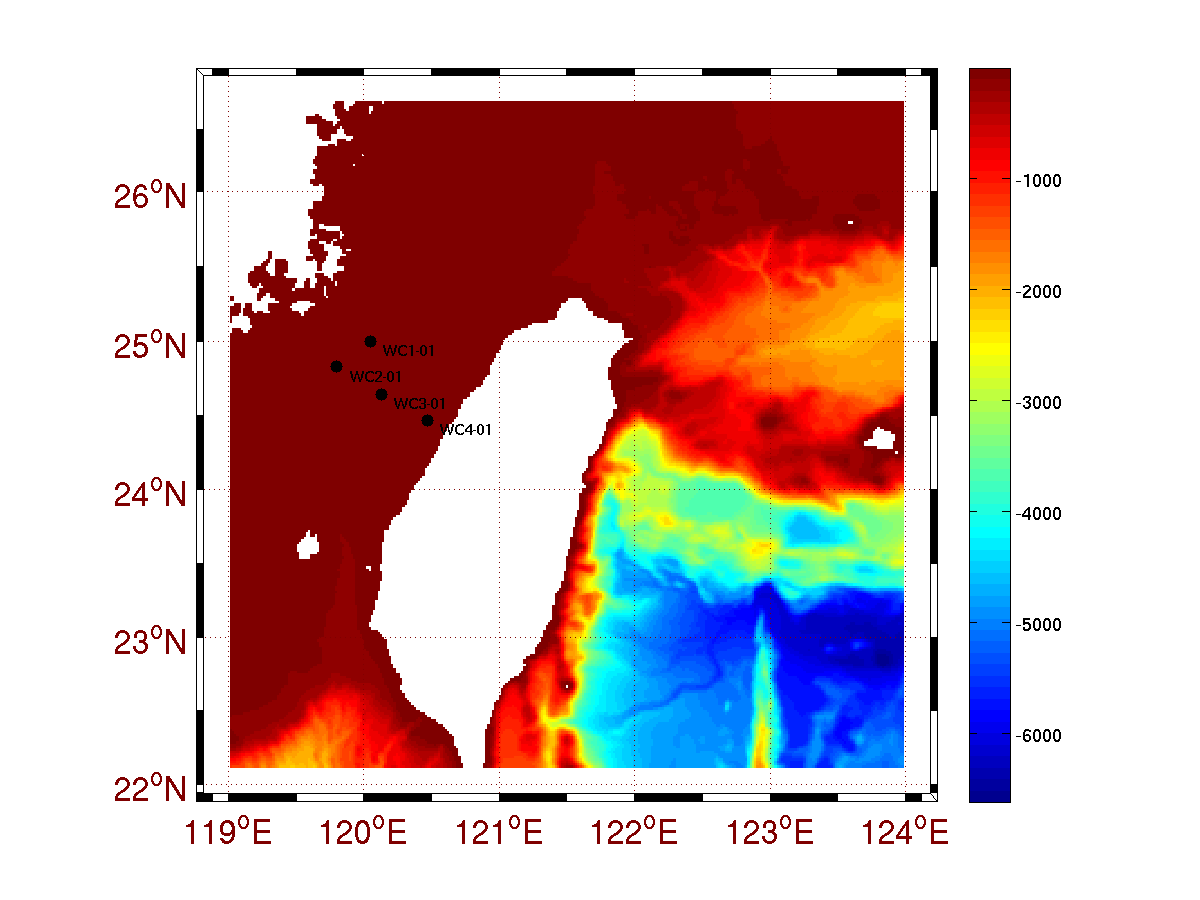
The velocity from 4 ADCP moorings (WC1, WC2, WC3, WC4) (map) were used for model validation. Our thanks go to Dr. Jan Sen, Institute of Hydrological and Oceanic Sciences, Taiwan, for the use of the data. The plots in the table below show the model velocities compared to those of each of the moorings.
| QPE Domain | Taiwan-Kuroshio Domain | |||
| U | V | U | V | |
| WC1 |
 |
 |
 |
 |
| WC2 |
 |
 |
 |
 |
| WC3 |
 |
 |
 |
 |
| WC4 |
 |
 |
 |
 |
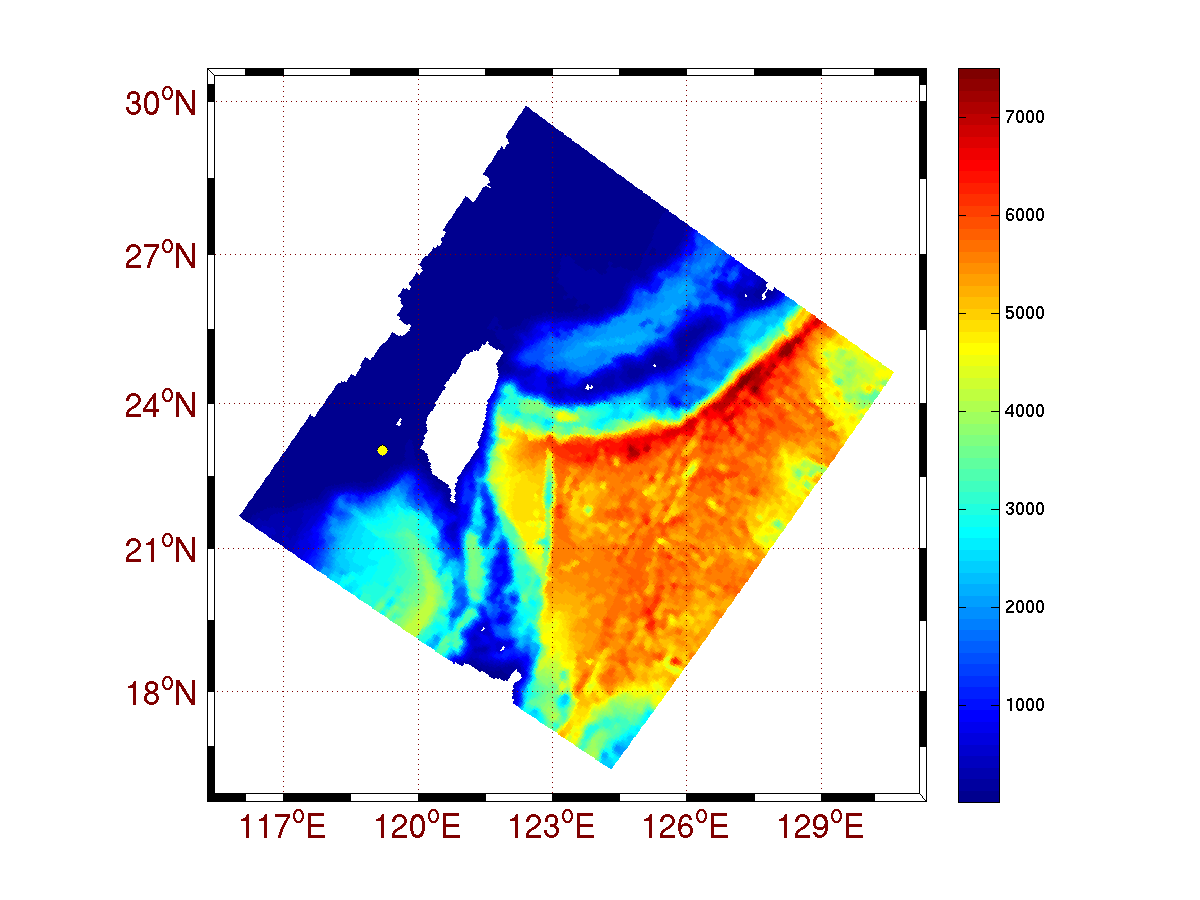
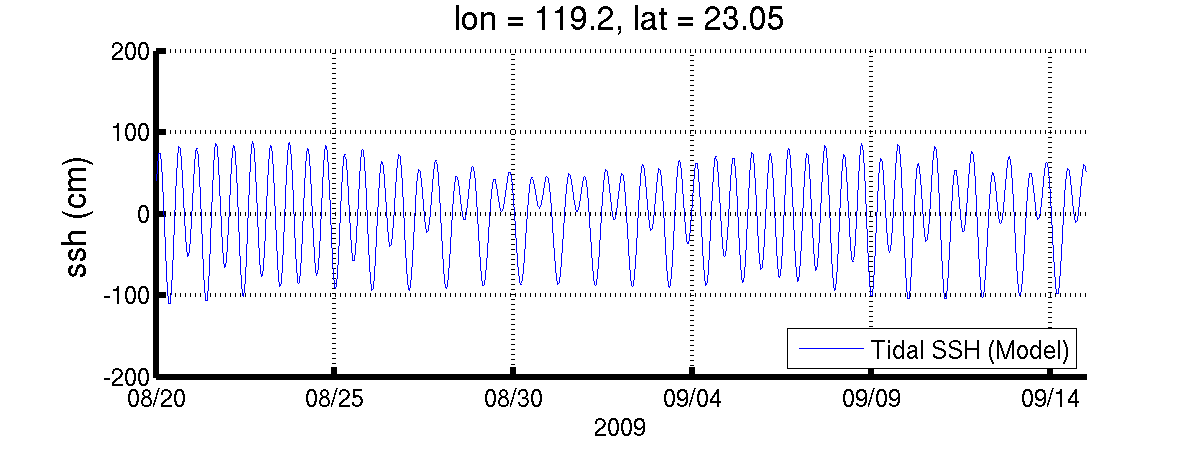
For further insight, the model barotropic tides were evaluated at the Peng-Hu islands (yellow dot on image).
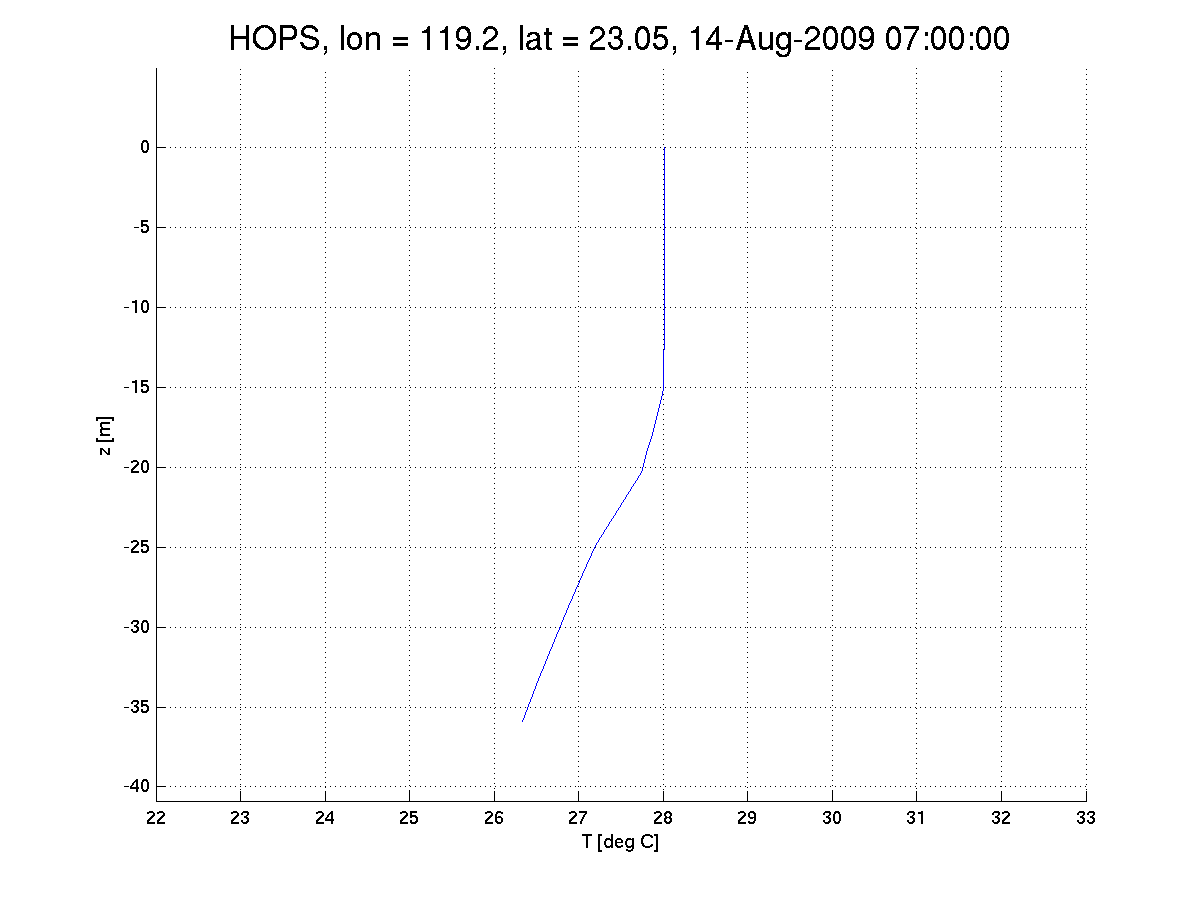
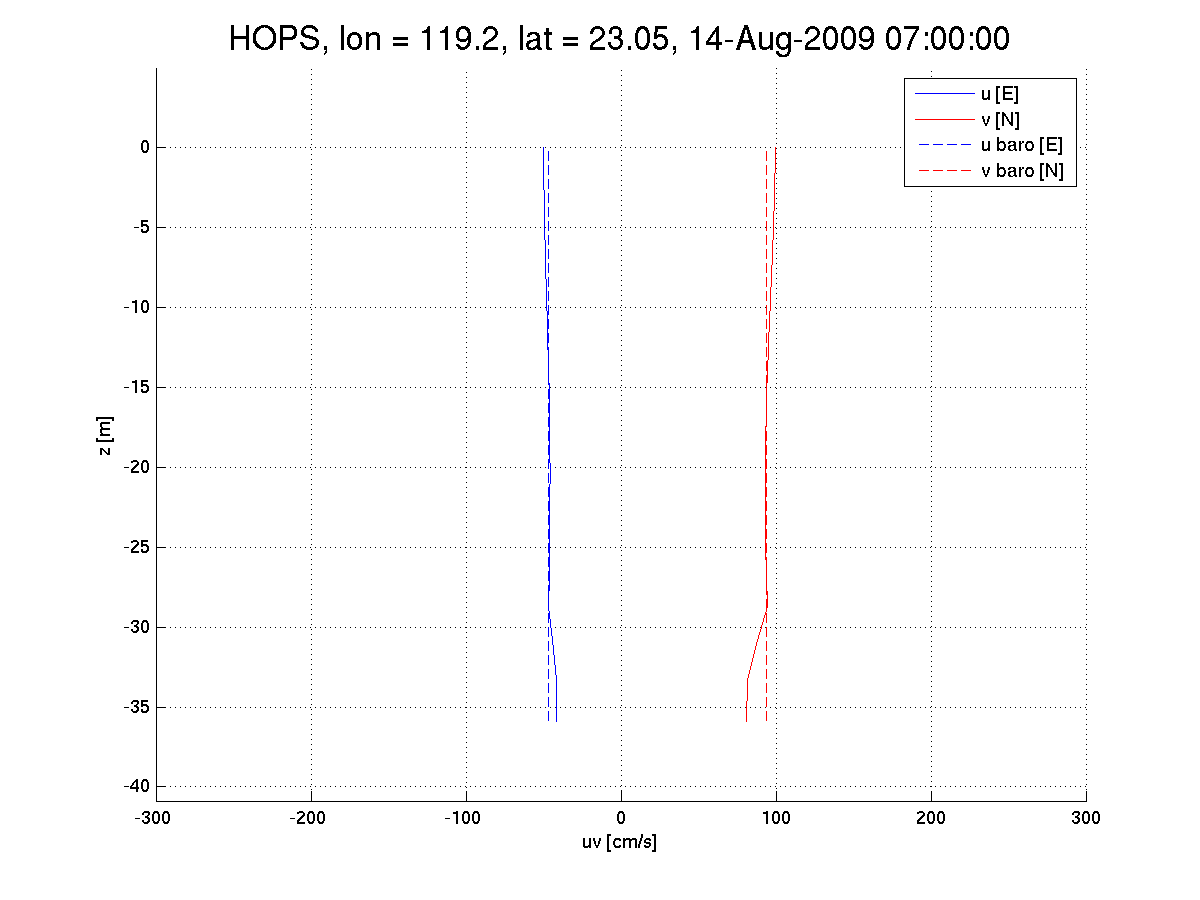
| Location of Peng-Hu | U and V components of velocity | Sea Surface Height (SSH) | Movies (14 Aug 07Z - 22 Aug 16Z) of vertical profiles of temperature and speed |
|
|
|
|