|
P.F.J. Lermusiaux, P.J. Haley, S. Jana, C. Mirabito, M. Kane Massachusetts Institute of Technology
|
Data and Simulations Inputs Data sources |

|
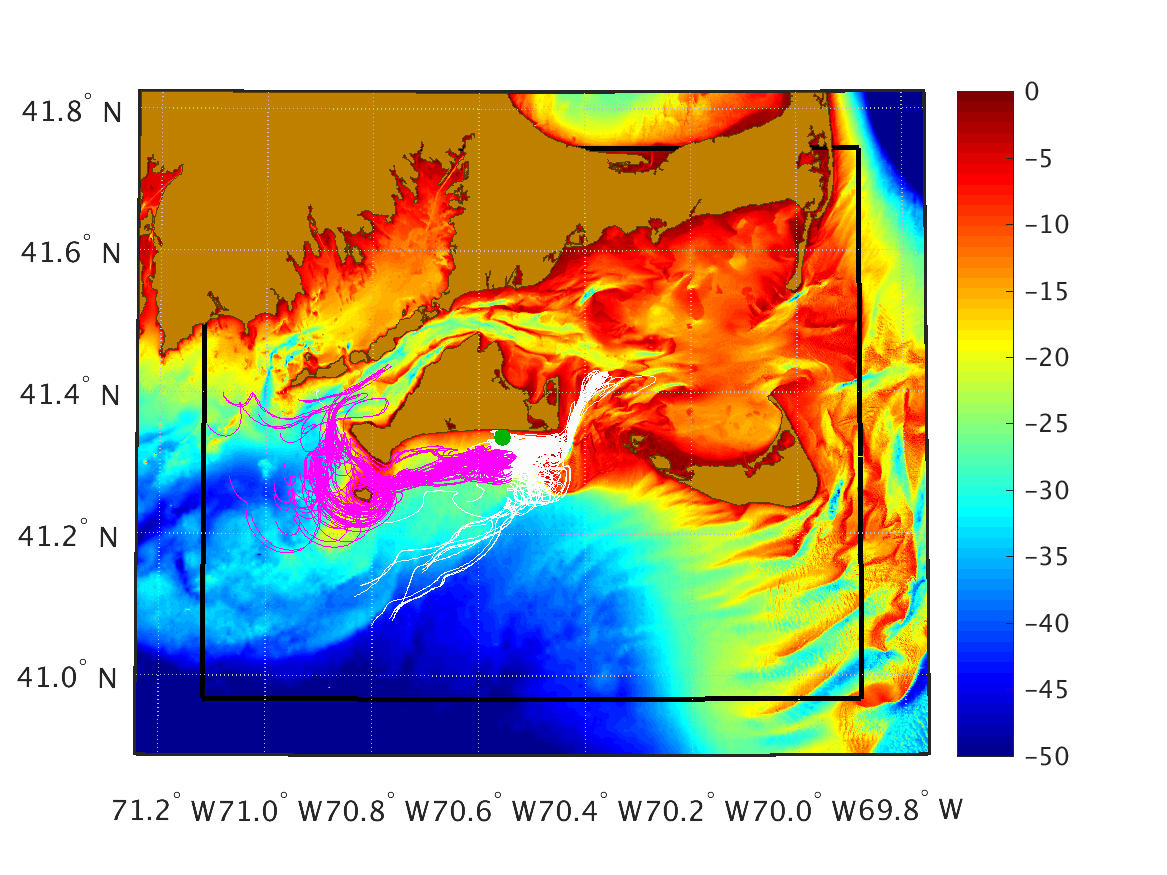
This page contains the results of the MSEAS group for the reanalysis of ocean dynamical fields in the Nantucket and Martha's Vineyard coastal region during the July/August/September 2014 time period. It provides the MSEAS-PE ocean re-analysis simulations as well as the data processed by the MSEAS group for input, initialization, and/or forcing to these simulations. The data is broken down into two categories: synoptic and historical. Synoptic data consists of bathymetric data, atmospheric data from the National Centers for Environmental Prediction (NCEP), ADCP and CTD data for ocean currents, temperature and salinity from Woods Hole Oceanographic Institute's Martha's Vineyard Coastal Observatory (MVCO), current velocity data from WHOI's high-frequency (HF) radar, WHOI drifter tracks, SST images from Johns Hopkins University's Applied Physics Lab (JHU APL) and the Satellite Oceanography Data Lab at the University of Maine, and profiles from the National Marine Fisheries Service (NMFS). Historical data consists of NMFS profile comparisons for a "normal" (that is, not in El Niño conditions) July and September. We thank all NSF-ALPHA ocean observing colleagues for their data as well as the many above-mentioned data providers.
Data and Simulation Inputs Utilized/Processed for the MSEAS Reanalysis:
Synoptic
- Bathymetric data
- Atmospheric forcing plots:
- MSEAS processing of NCEP HIRESW forecast, 5km WRF model:
July 2014 S M T W T F S 1 2 3 4 5 6 7 8 9 10 11 12 13 14 15 16 17 18 19 20 21 22 23 24 25 26 27 28 29 30 31 August 2014 S M T W T F S 1 2 3 4 5 6 7 8 9 10 11 12 13 14 15 16 17 18 19 20 21 22 23 24 25 26 27 28 29 30 31 September 2014 S M T W T F S 1 2 3 4 5 6 7 8 9 10 11 12 13 14 15 16 17 18 19 20 21 22 23 24 25 26 27 28 29 30 - Daily average wind stress, heat flux, E-P, and SW Radiation
- Comparison of MVCO wind data and NCEP simulations
- MSEAS-PE forcing data:
- MSEAS processing of NCEP HIRESW forecast, 5km WRF model:
- MSEAS-processed MVCO ocean synoptic data
- WHOI HF Radar current velocity data
8-02 8-03 8-04 8-05 8-06 8-07 8-08 8-09 8-10 8-11 Snapshots X X X X X X X X X X 62-hour avg X Difference: snapshots minus 62-h avg X X X X X X X X X X 1-day avg X - WHOI Drifter Tracks with Temperature and Time
- SST Images
- NMFS Data
Historical
The July-September 2014 time period does not coincide with an El Niño event (based on the Ocean Niño Index). Hence, here below, we gathered and processed data for normal years, for the months of July and September which are the months during which drifters are at sea. These data are then used as partial inputs for the initialization of our MSEAS-PE simulations.- NMFS profiles for Normal July Months: year-to-year comparisons
- NMFS profiles for Normal August Months: year-to-year comparisons
- NMFS profiles for Normal September Months: year-to-year comparisons
| Top of page |
Data sources
- Ocean synoptic
- WHOI Martha's Vineyard Coastal Observatory (MVCO)
- The Global Temperature and Salinity Profile Programme (GTSPP)
- National Data Buoy Center Real-Time & historical data from moored buoy & C-MAN stations
- SST Images
- Ocean historical/climatological
- NOAA/NOS tidal elevation stations in MA
- CO-OPS current station data (historical)
- The Global Temperature and Salinity Profile Programme (GTSPP)
- Data sets & products NOAA National Centers for Environmental Information
- World Ocean Database (WOD)
-
Northeast Fisheries Science Center Ecosystem Processes Division Oceanography Branch
NMFS. Includes data from CTDs, fish hauls, hull-mounted sensors, eMOLT
moorings, drifters, etc.
- Hydrographic Conditions of the Northeast Continental Shelf Northeast Fisheries Science Center Oceanography Branch
- Data/Mapping Interface Northeast Fisheries Science Center, Oceanography Branch
- Atmospheric forcing
- Weather Research and Forecasting (WRF) Model Real-Time Forecasts
- National Centers for Environmental Prediction (NCEP) products:
| Top of page |


