

WHOI MVCO Data – August 2018
|
P.F.J. Lermusiaux, P.J. Haley, C. Mirabito, J. Coulin, C. Kulkarni, A. Dutt, A. Gupta, T. Peacock Massachusetts Institute of Technology
|
|
WHOI Martha's Vineyard Coastal Observatory (MVCO), MSEAS-processed information
|
|
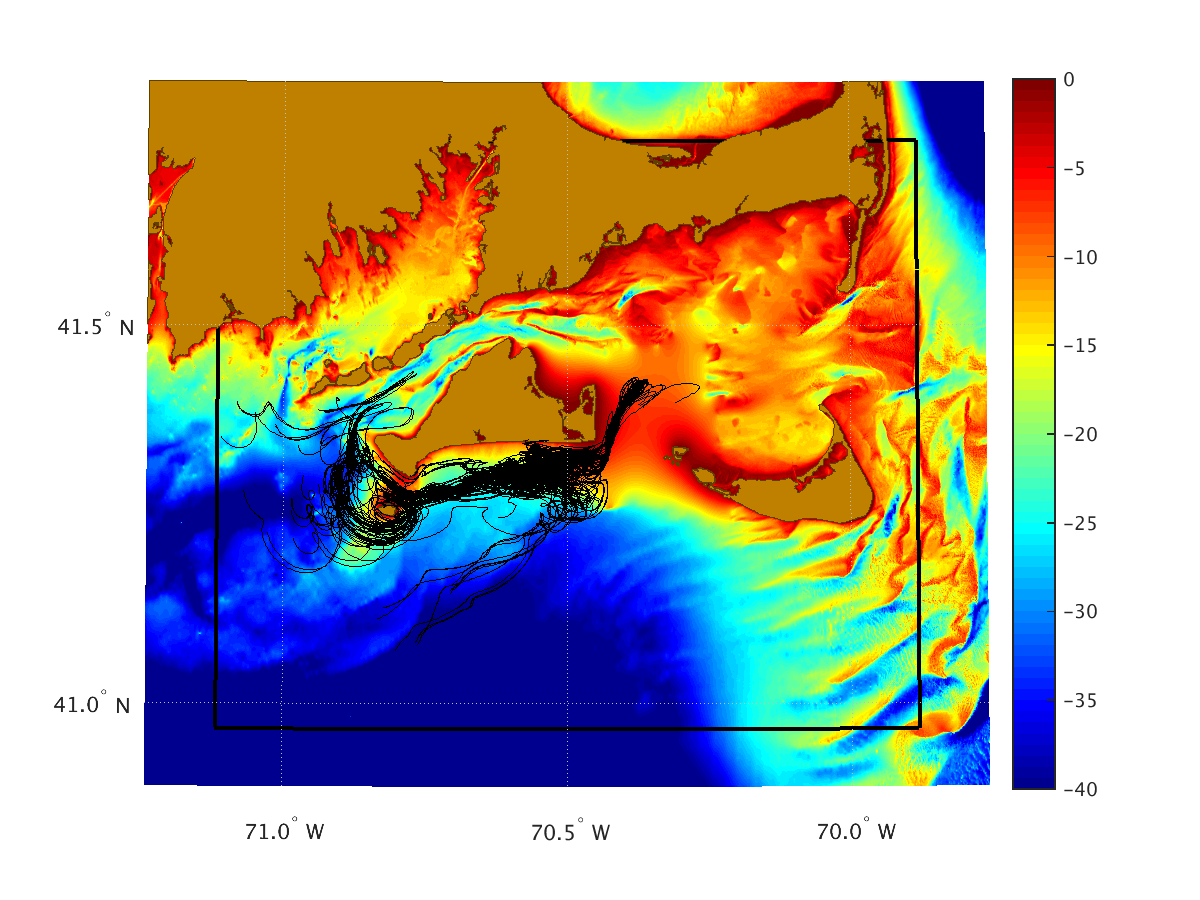
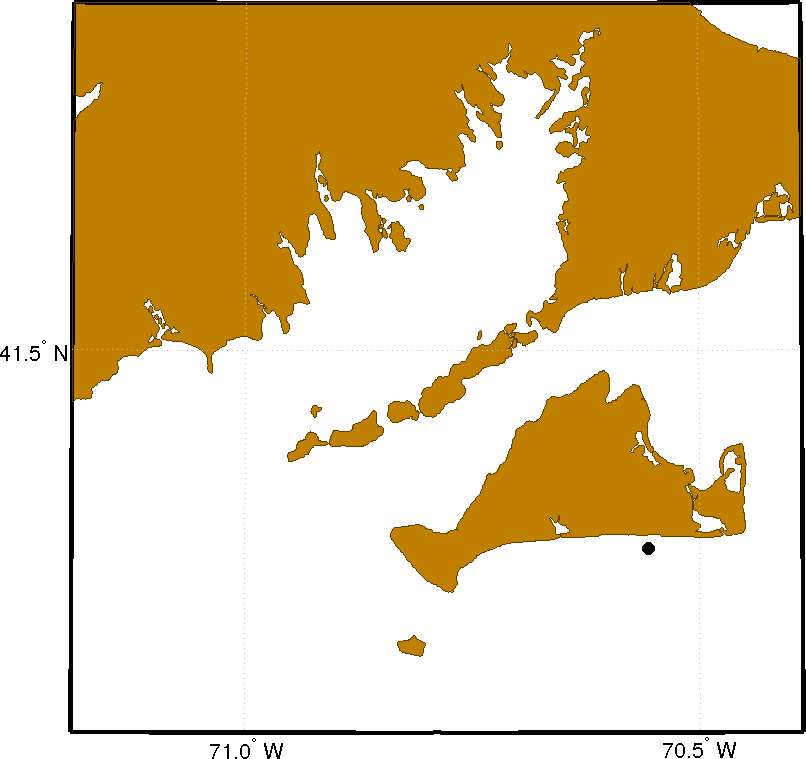
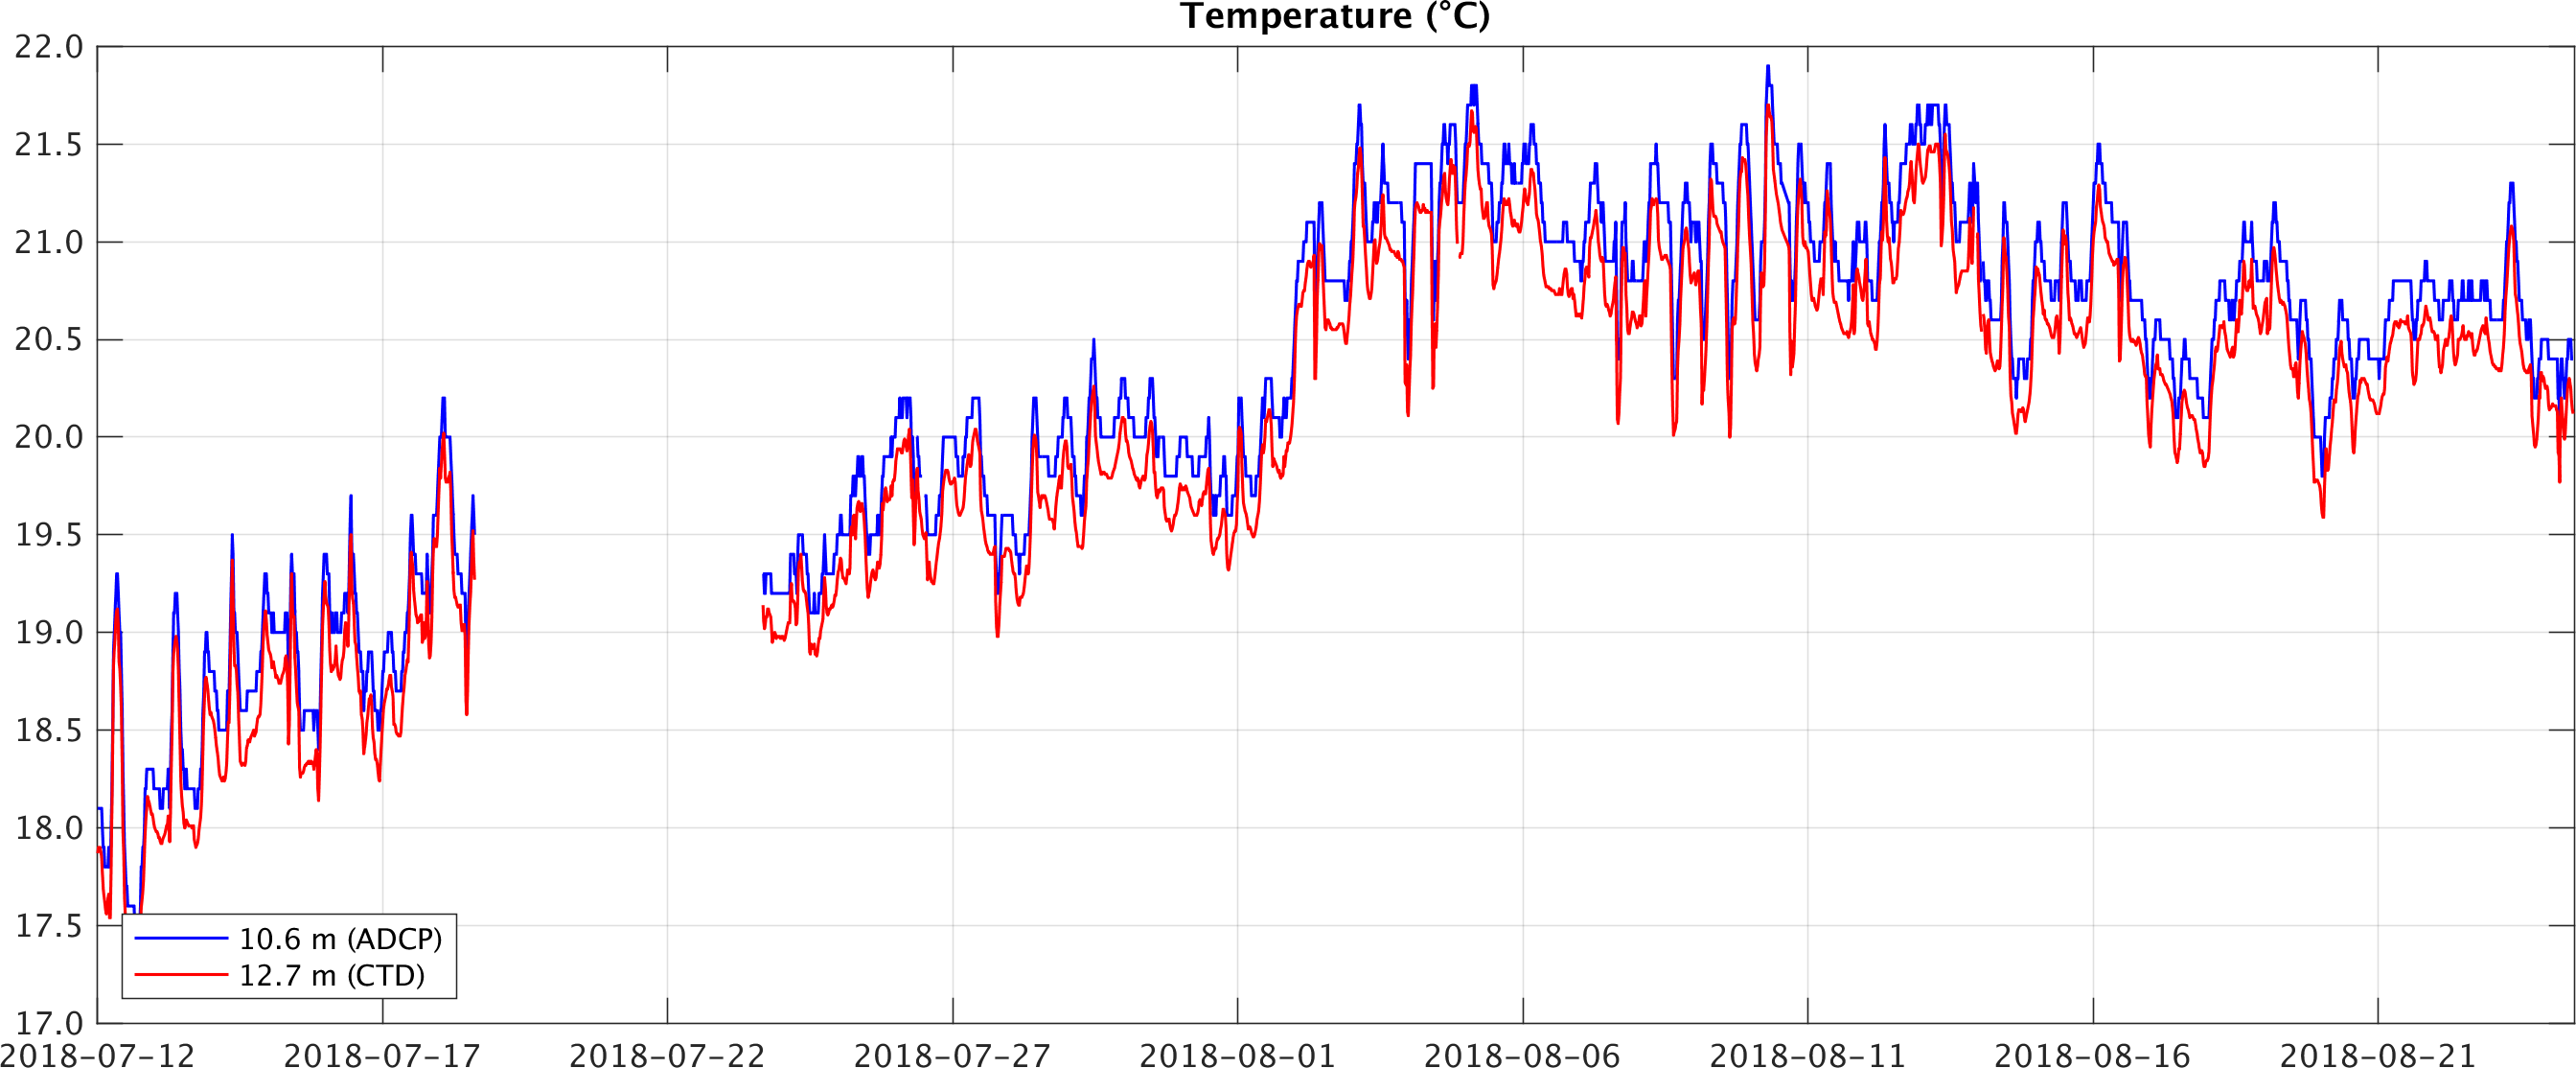
| Location of the MVCO offshore 12 m sea node (black dot) where the data in the following plots are measured | 20-minute burst-averaged sea temperature (°C) at 10.6 m and 12.7 m depths from July 12, 2018 0000Z to August 24, 2018 1030Z as measured by ADCP (blue) and CTD (red) sensors at the MVCO offshore 12 m sea node, respectively |
|
|
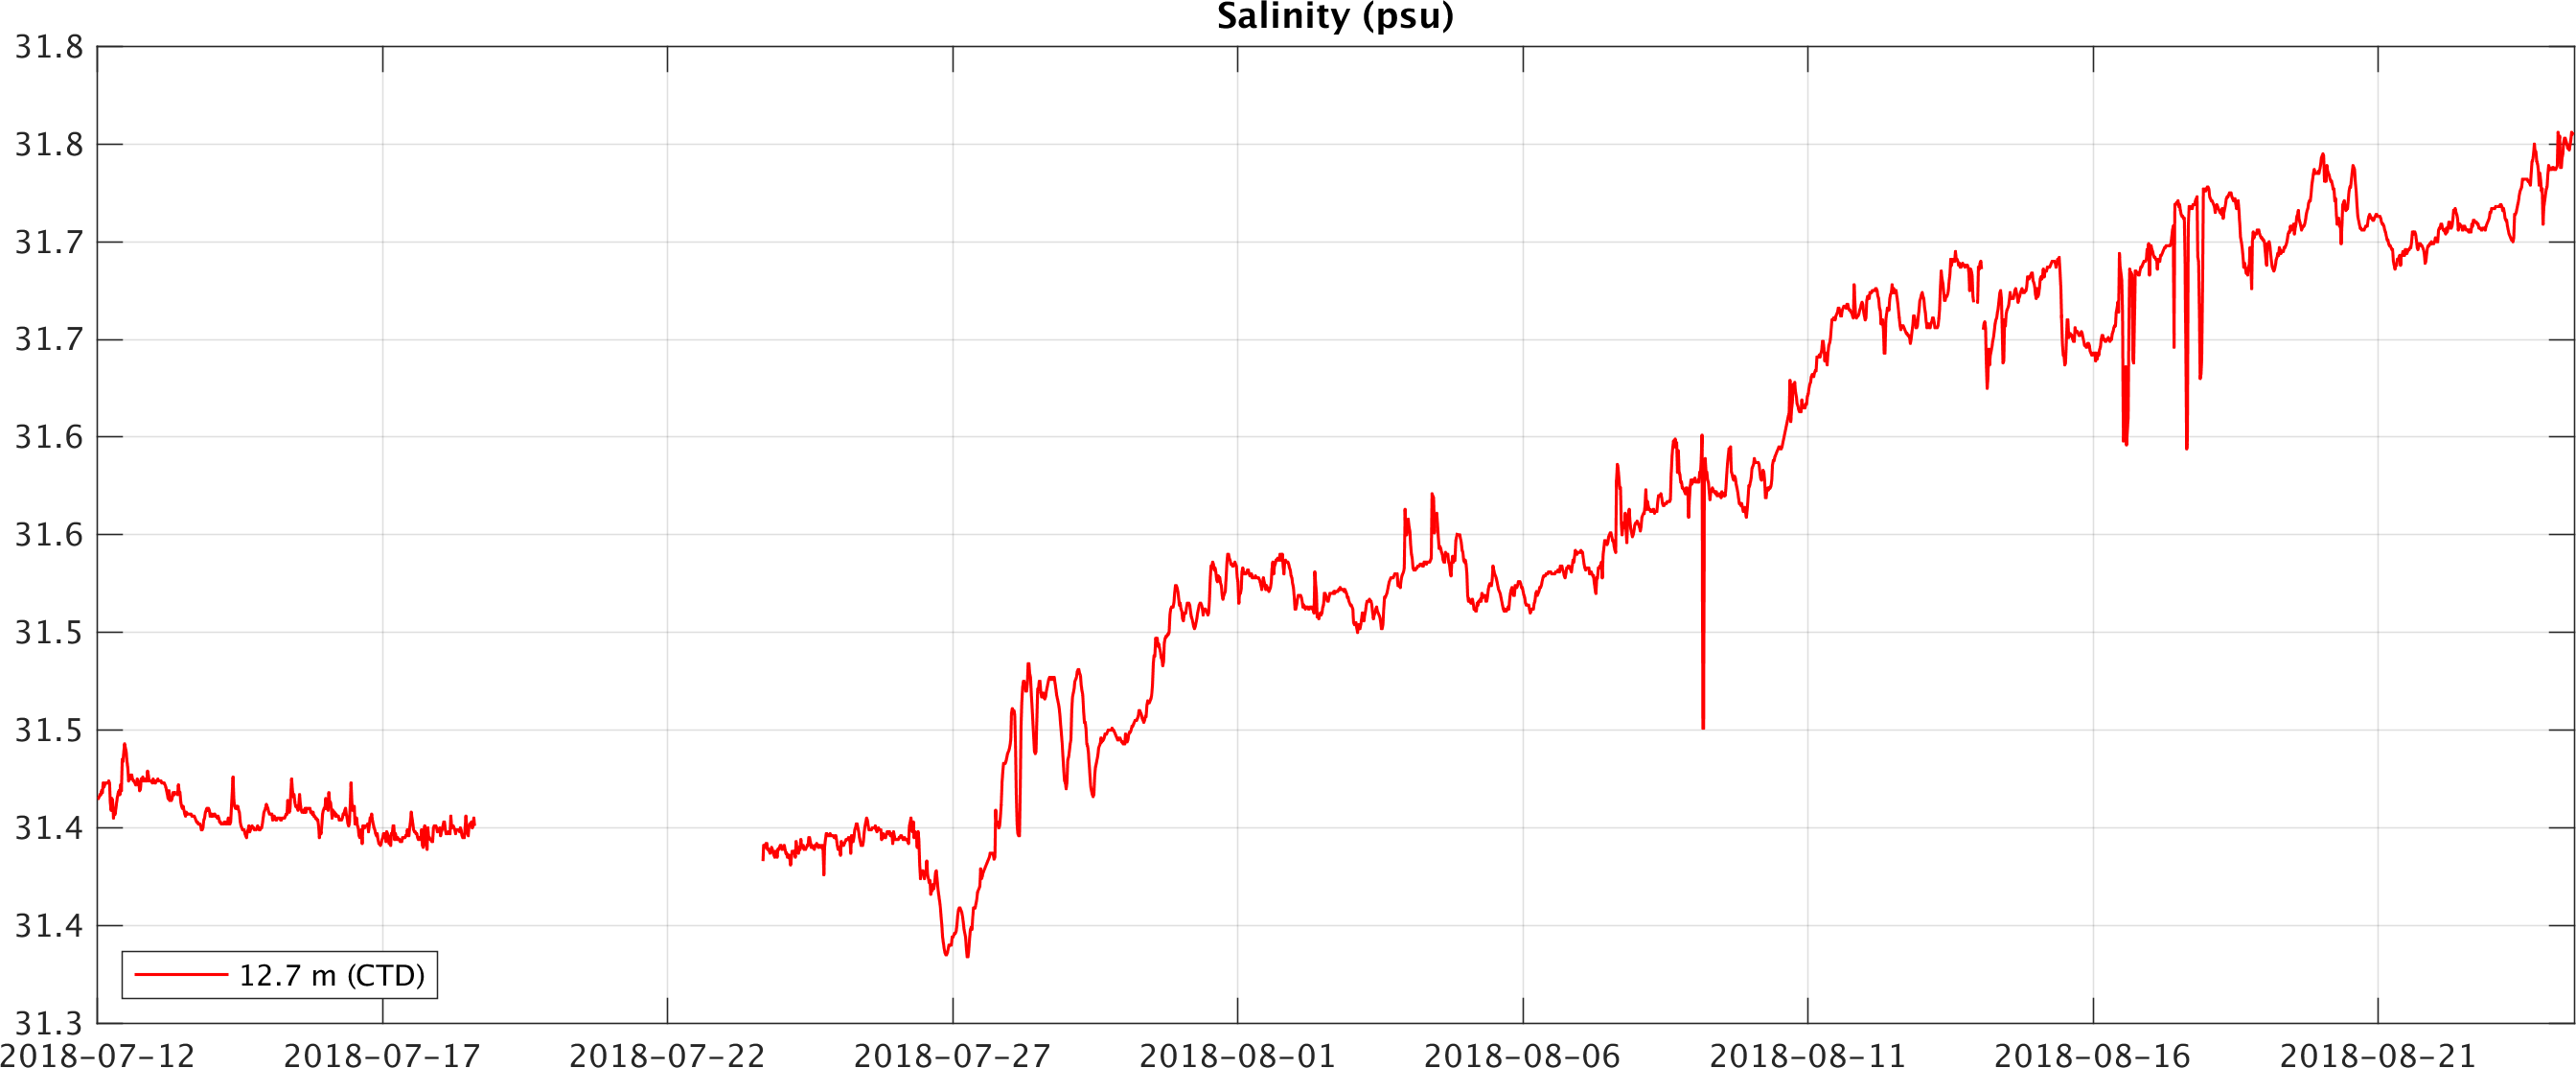
| 20-minute burst-averaged salinity (psu) from July 12, 2018 0000Z to August 24, 2018 1030Z as measured by CTD sensors at the MVCO offshore 12 m sea node | |
|
|
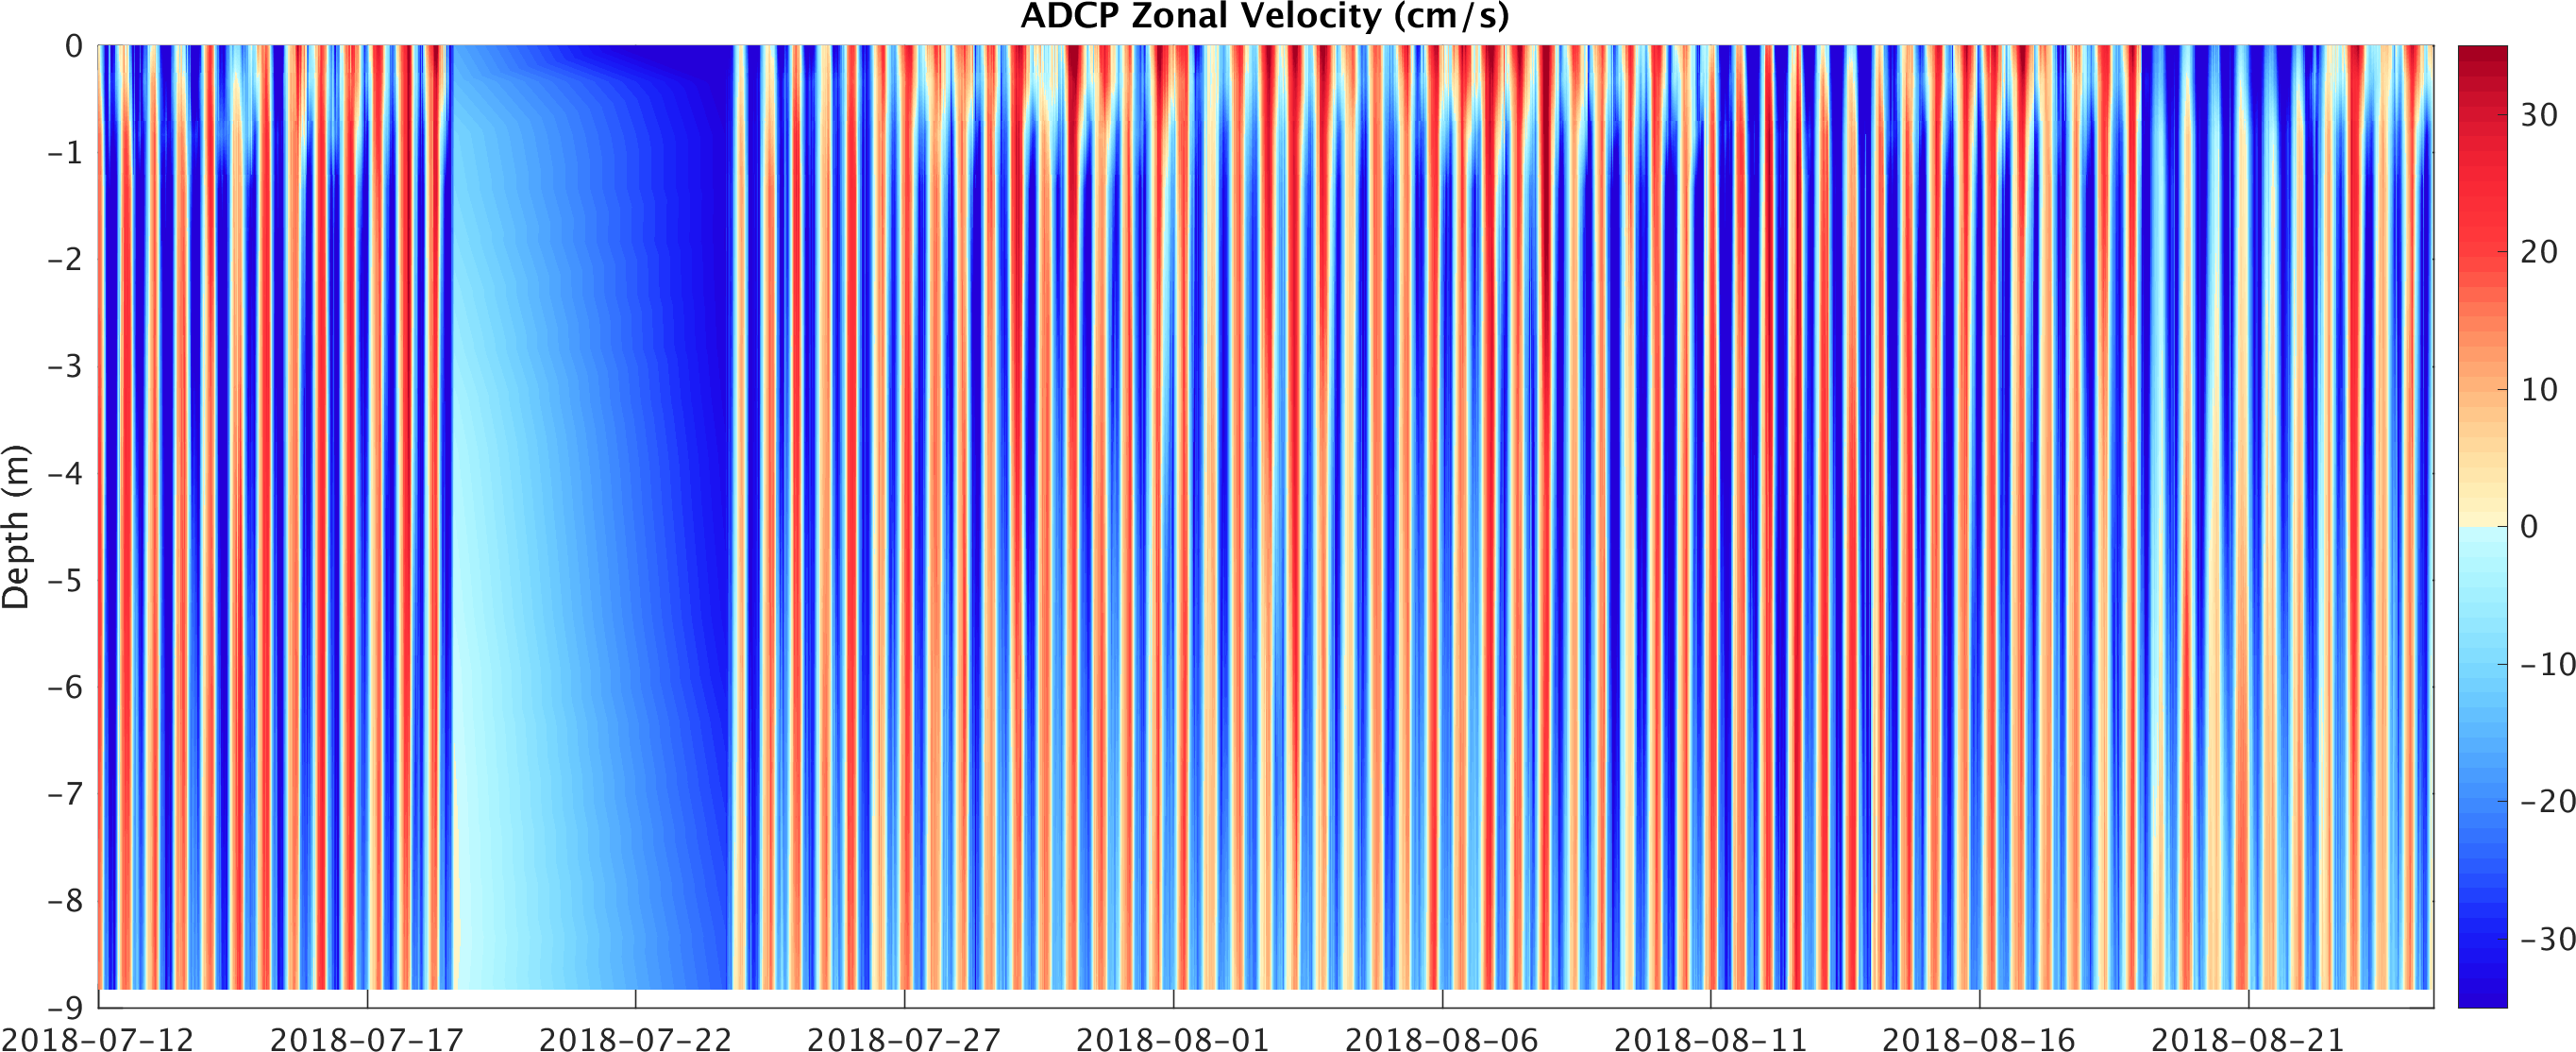
| 20-minute burst-averaged zonal velocity (cm/s) versus depth (m) from July 12, 2018 0000Z to August 24, 2018 1030Z as measured by ADCP sensors at the MVCO offshore 12 m sea node | |
|
|
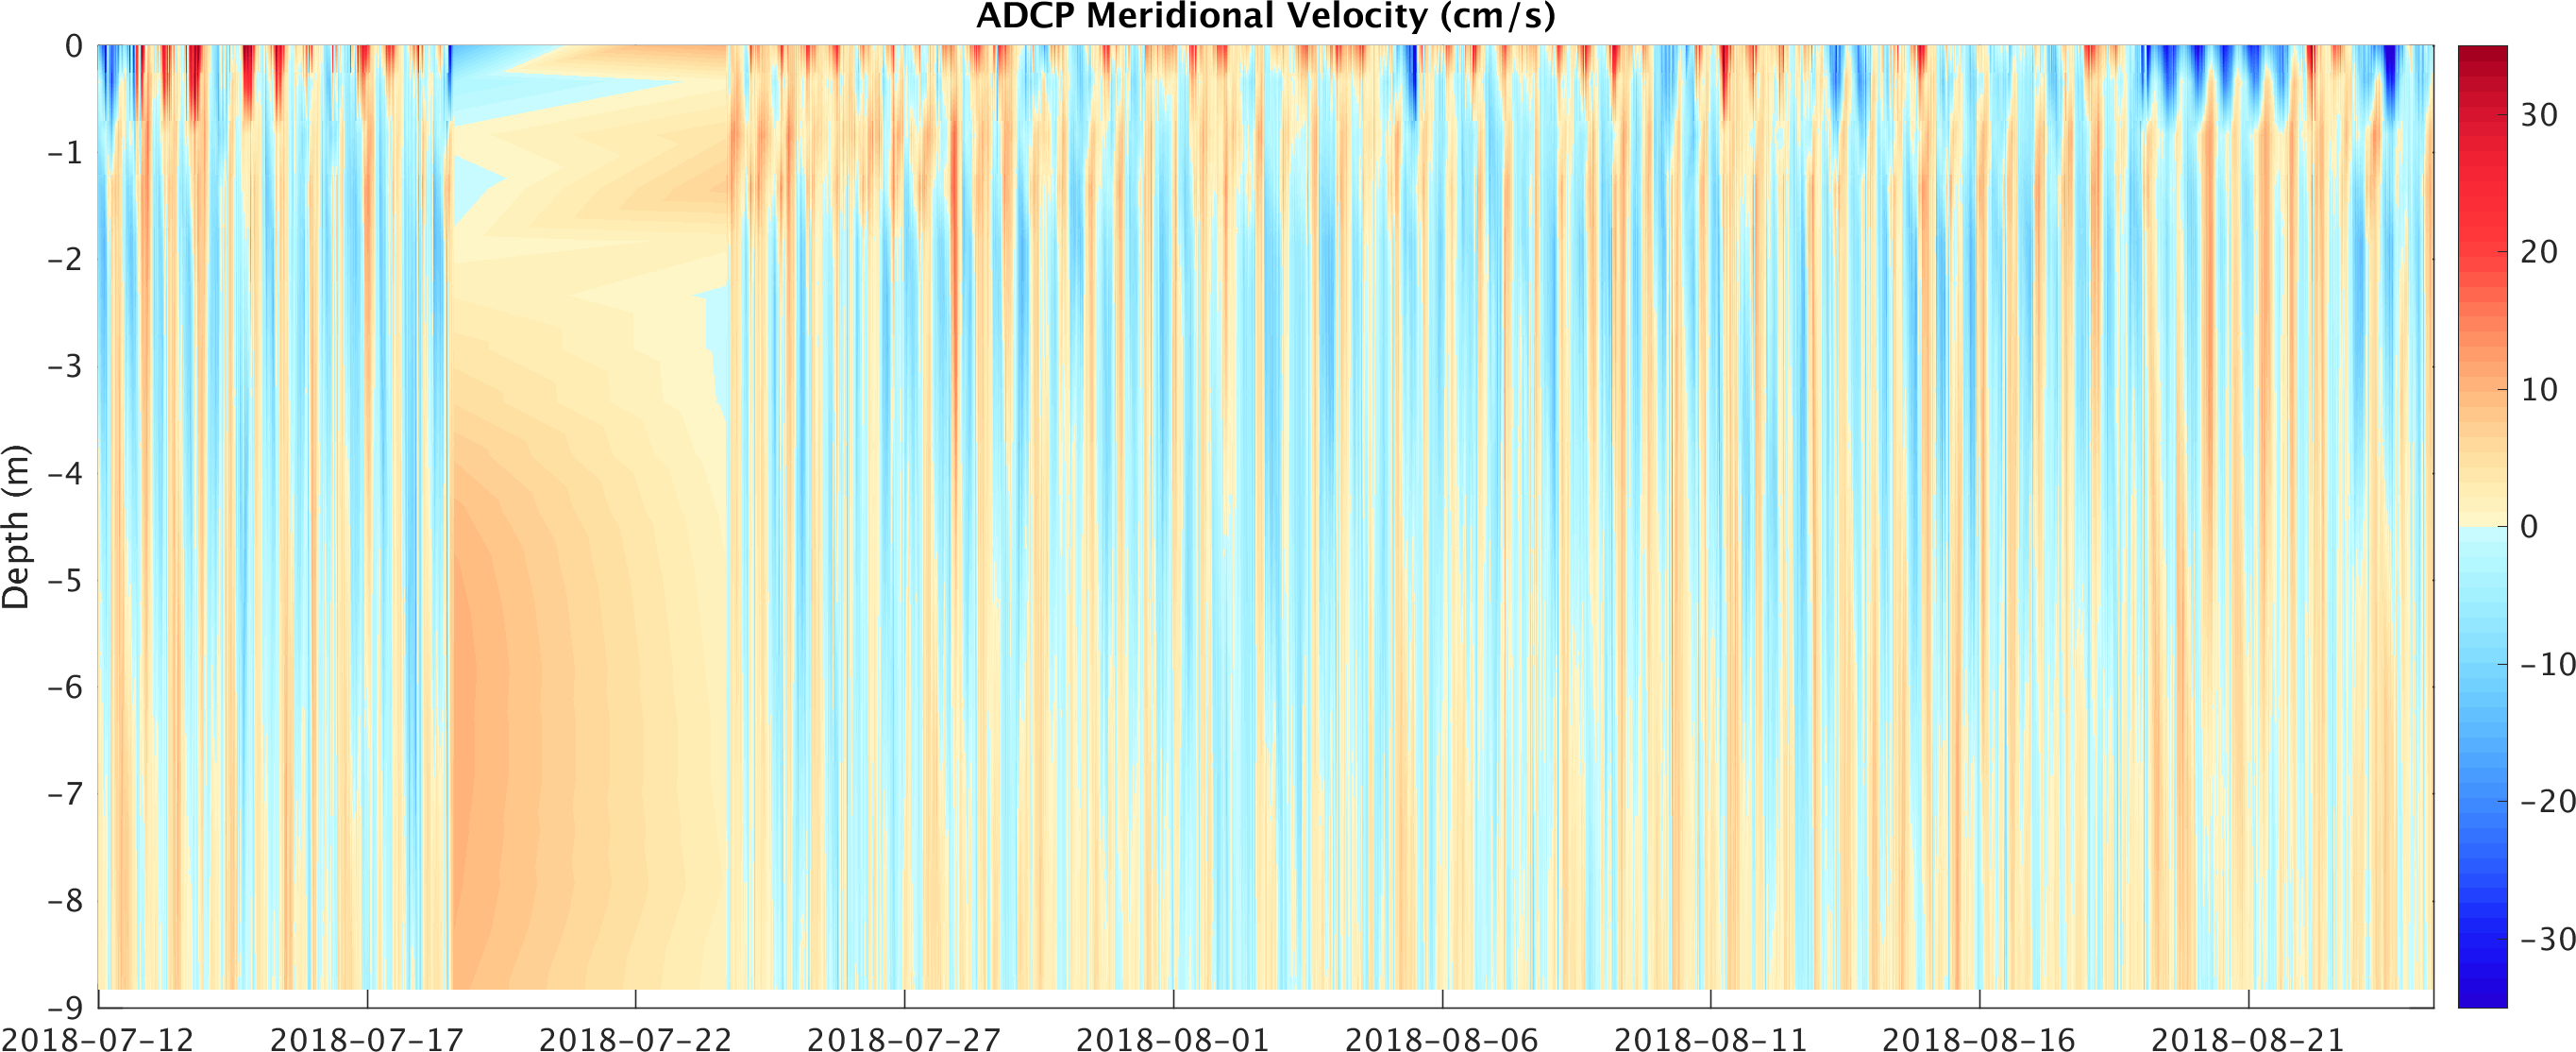
| 20-minute burst-averaged meridional velocity (cm/s) versus depth (m) from July 12, 2018 0000Z to August 24, 2018 1030Z as measured by ADCP sensors at the MVCO offshore 12 m sea node |
|
|
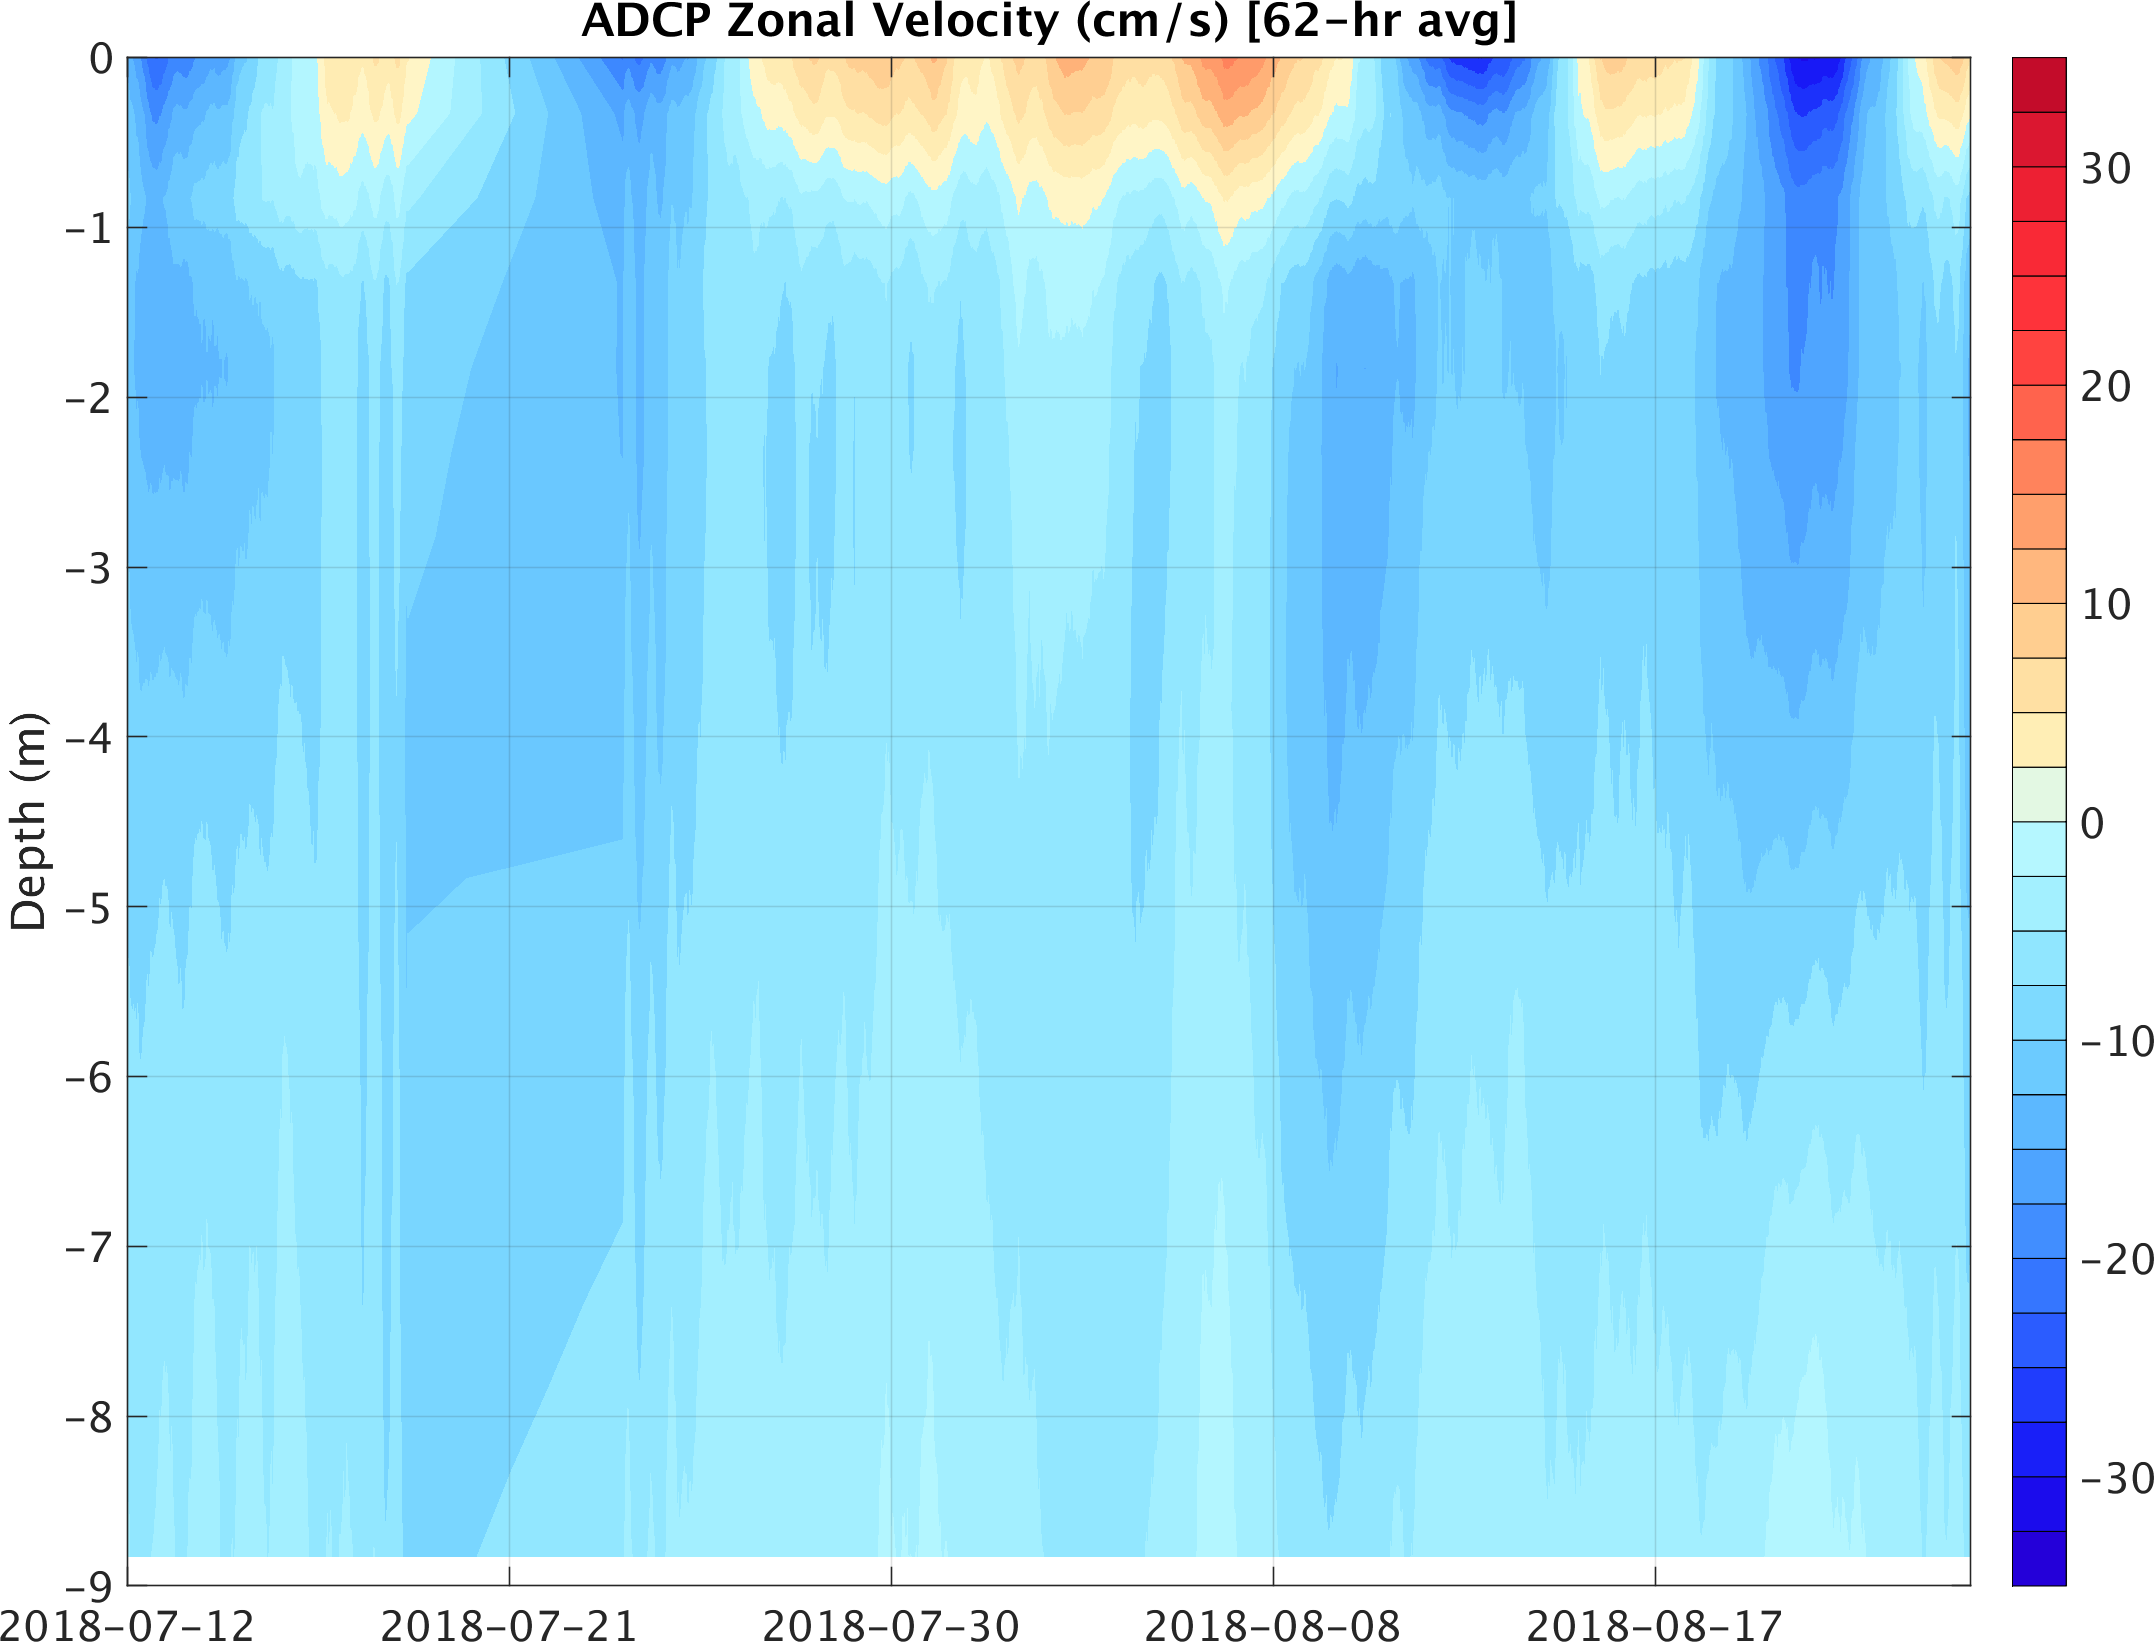
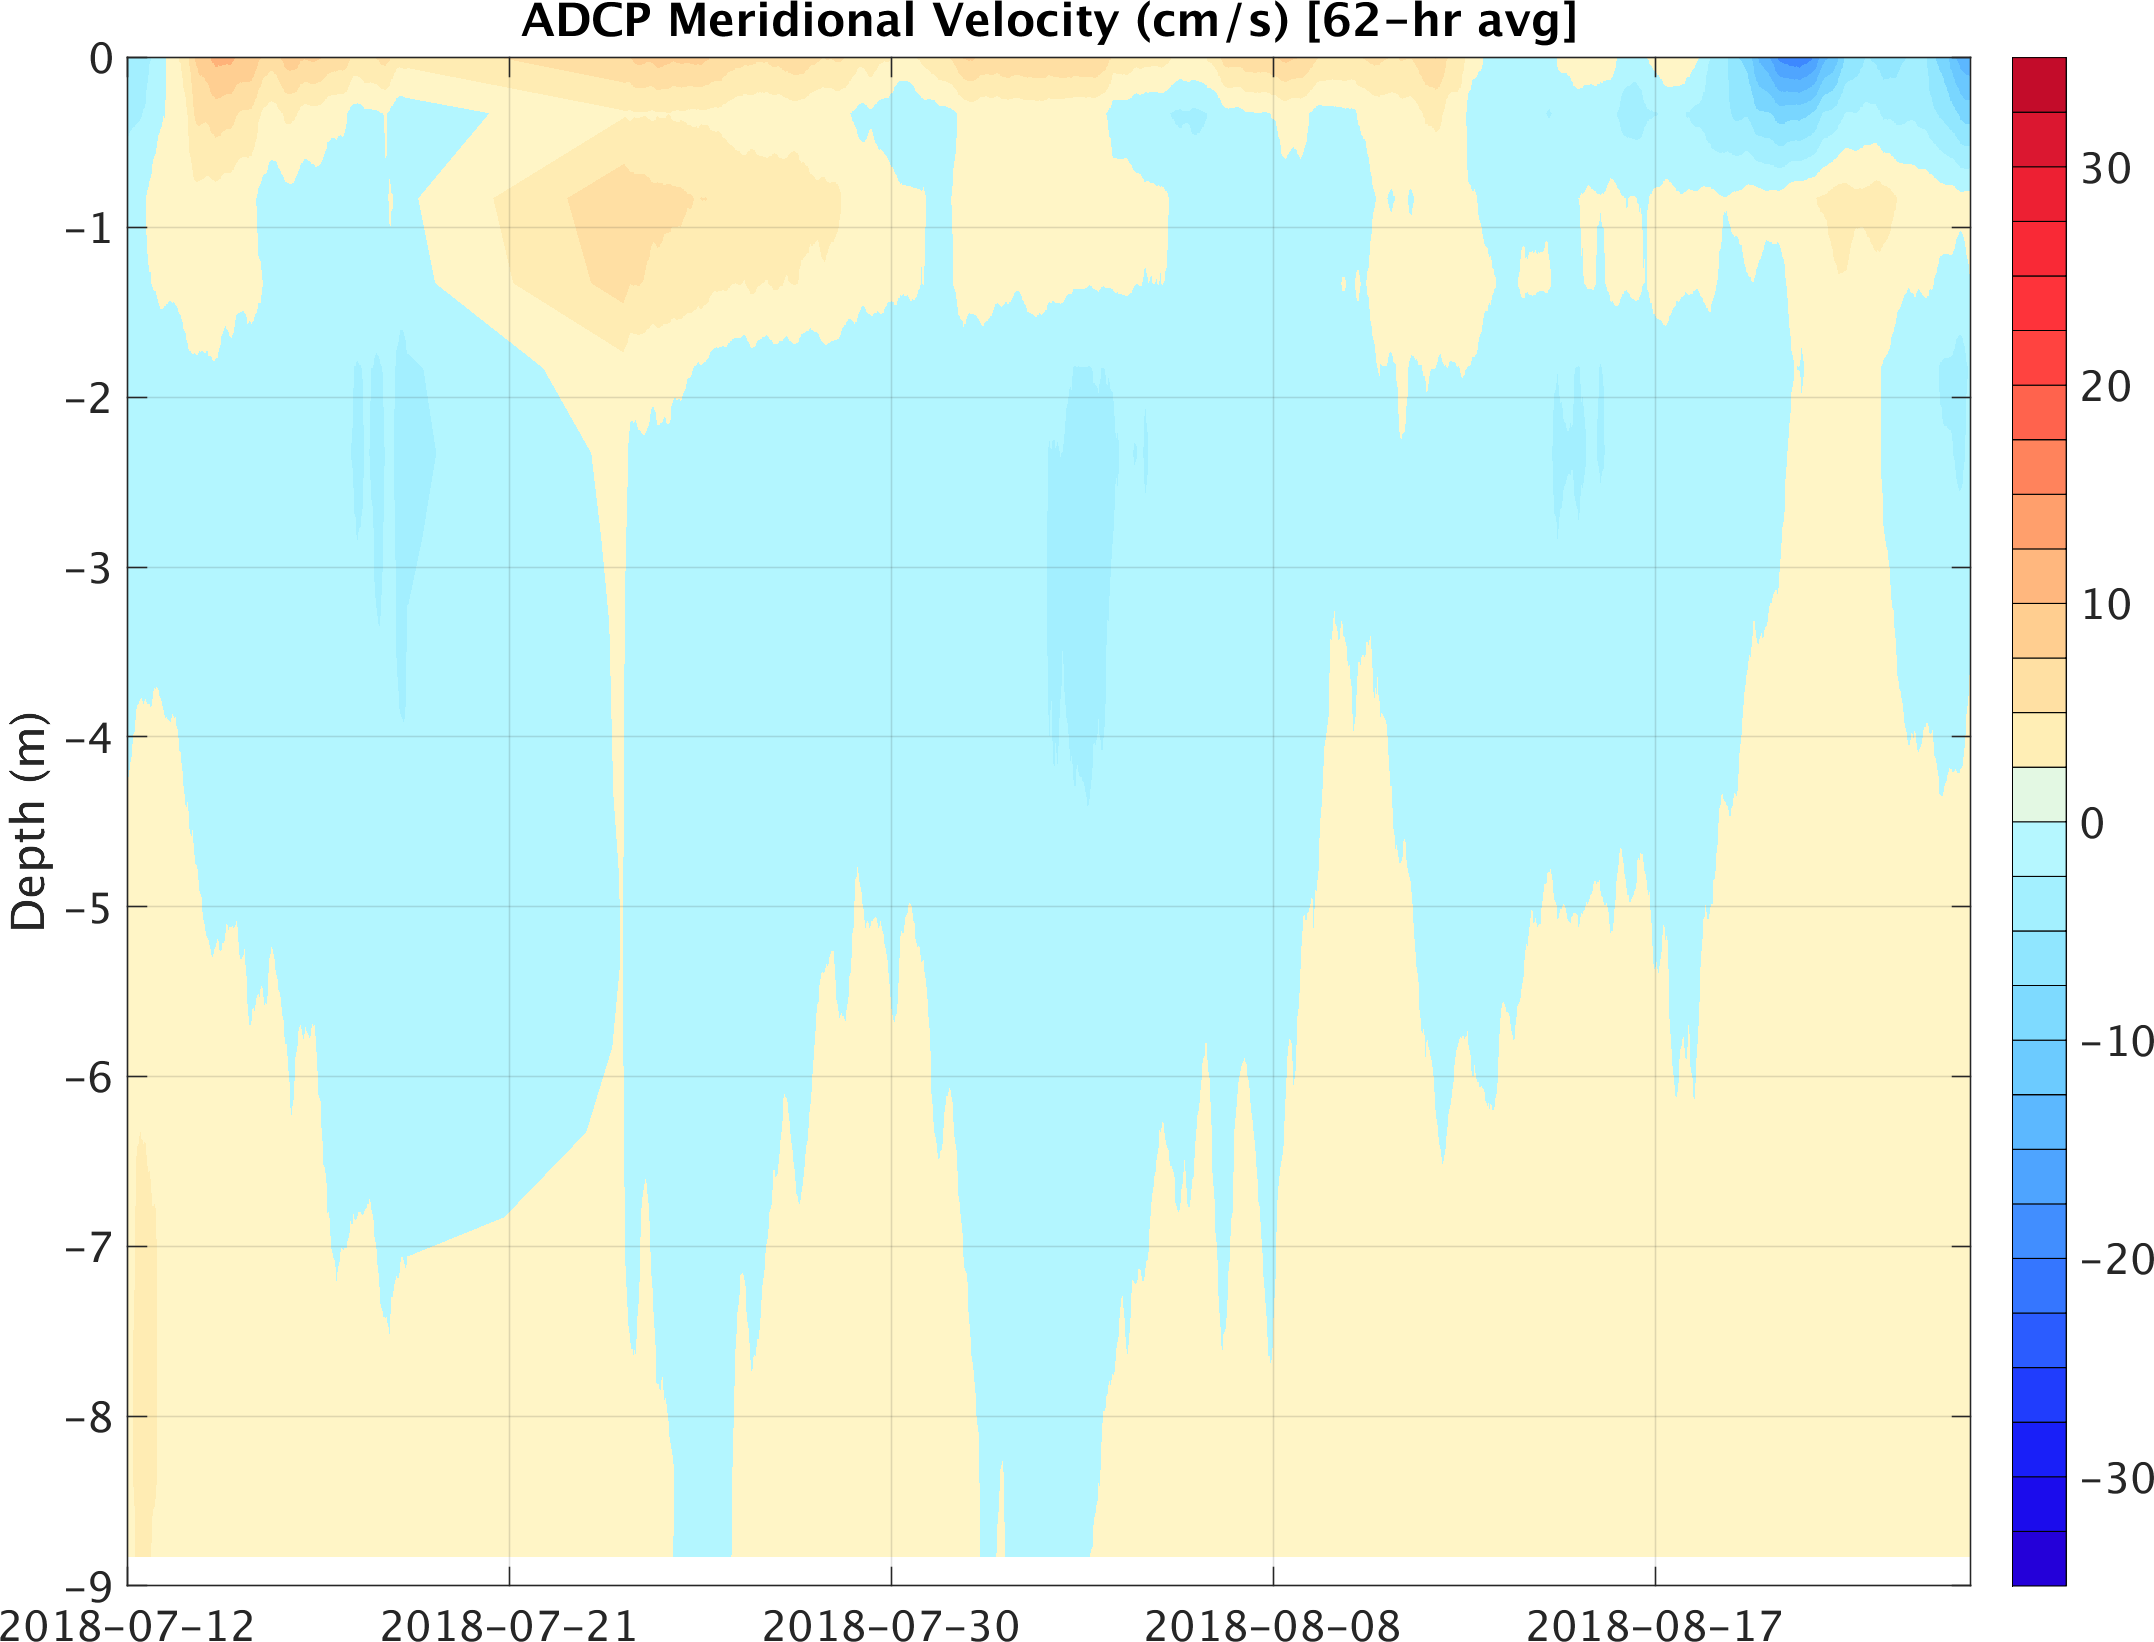
| 62-hr moving average zonal velocity (cm/s) versus depth (m) from July 12, 2018 0000Z to August 24, 2018 1030Z as measured by ADCP sensors at the MVCO offshore 12 m sea node | 62-hr moving average meridional velocity (cm/s) versus depth (m) from July 12, 2018 0000Z to August 24, 2018 1030Z as measured by ADCP sensors at the MVCO offshore 12 m sea node |
| Top of page |
