Mid-Atlantic/New York Bight Region - August 2018
|
P.F.J. Lermusiaux, P.J. Haley, C. Mirabito, J. Coulin, W. Ali, A. Dutt, D. Subramani, M. Merhi Massachusetts Institute of Technology Center for Ocean Engineering Mechanical Engineering Cambridge, Massachusetts
|
E. Dorfman, A. Laferriere, A. Kofford, G. Shepard, M. Goldsmith Raytheon BBN Technologies K. Heaney, E. Coelho J. Boyle, J. Murray OASIS, Inc. L. Freitag, A. Morozov Woods Hole Oceanographic Institution |
Real-time modeling Data sources |
 |
 |
POSYDON-POINT Project Main Page
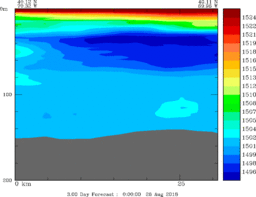
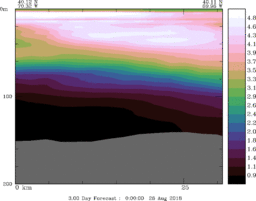
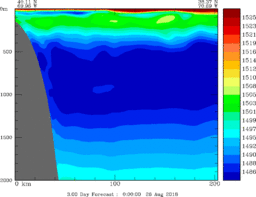
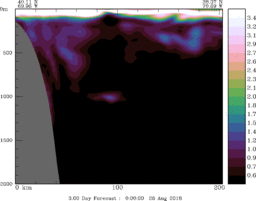
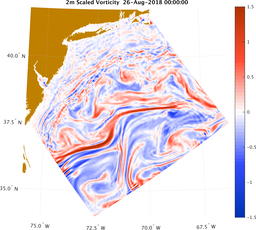
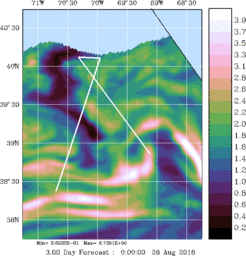
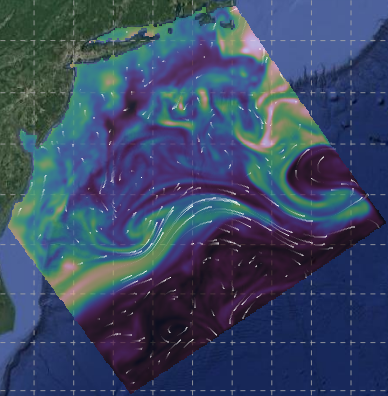
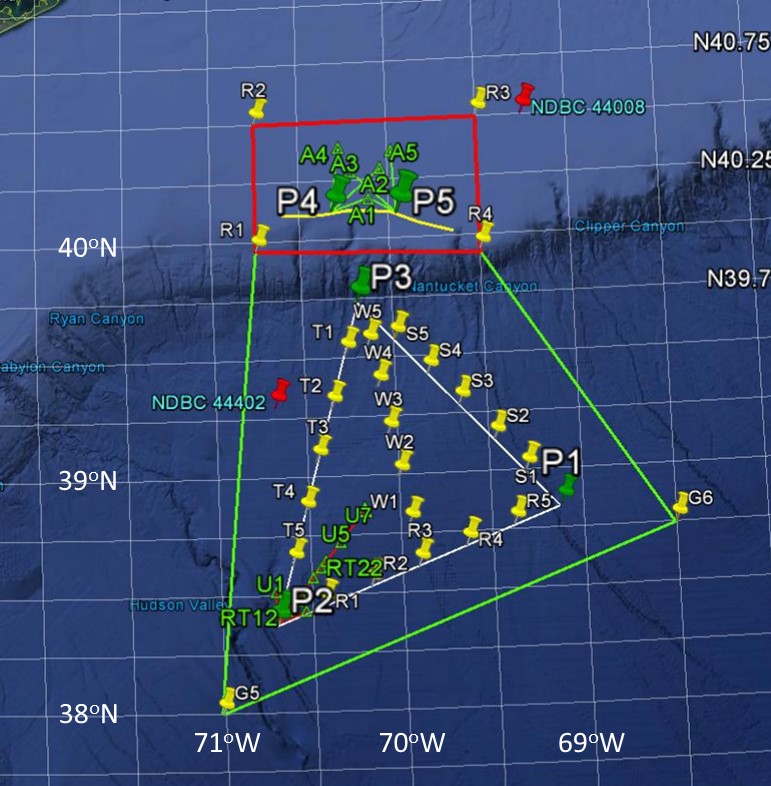
The POSYDON Sea Exercise 2018 occurs in the Middle Atlantic - New York Bight Region for August 2018. In collaboration with the POINT team, our objectives are to utilize the MIT MSEAS system to: (i) forecast the probability of high-resolution ocean fields using our ESSE methodology; (ii) transfer the corresponding distribution of the sound speed field to three-dimensional underwater sound propagation uncertainties; (iii) collect sufficient data to evaluate the accuracy of the Bayesian tomographic inversion and of its posterior estimates of range between transducers and sound velocity profiles (SVPs). We thank the POINT team members for their collaboration, the HYCOM team for their real-time ocean fields, and the NCEP GFS team for their real-time atmospheric flux forecasts.
This research is sponsored by DARPA.
Real-time MSEAS Ensemble Forecasting
- MSEAS ocean ensemble ESSE forecasts
Interactive Maps of Real-Time MSEAS ocean central forecast and ensemble ESSE uncertainty forecasts.
Nowcast and Forecast Products
with dynamics and uncertainty descriptionsAnalyses and Forecasts Issued On August 9 10 11 12 13 14 15 16 17 18 19 19
8p20 21 22 23 24 Ocean Physics Horizontal Maps Central Forecast X X X X X X X X X X X X X X X X X Mean and Uncertainty X X X X X X X X X X X X X X X X X Operational Vertical Sections Central Forecast X X X X X X X X X X X X X X X X X Mean and Uncertainty X X X X X X X X X X X X X X X X X Interactive Nowcast and Forecast Products
with dynamics and uncertainty descriptionsAnalyses and Forecasts Issued On August 9 10 11 12 13 14 15 16 17 18 19 19
8p20 21 22 23 24 Ocean Physics Interactive Maps Central Forecast X X X X X X X X X X X X X X X X X Mean and Uncertainty X X X X X X X X X X X X X X X X X - Methods and Systems: The probabilistic MIT-MSEAS Primitive-Equation (PE) ocean modeling system is utilized in real-time to provide ocean field and uncertainty forecasts for underwater GPS exercises in the Mid-Atlantic/New York Bight region. The MSEAS modeling system is set-up in an implicit 2-way nesting configuration. The ocean forecasts are initialized from HYCOM, downscaled to higher resolution and updated with ocean data from varied open sources of opportunity (CTDs, ARGO floats, gliders, SST, etc.) and with our MSEAS feature models for additional corrections. For uncertainty predictions, ensemble forecasts are initialized using our multiscale Error Subspace Statistical Estimation (ESSE) procedures. These ocean simulations are forced by atmospheric flux fields forecast by the GFS 0.25° model from the National Centers for Environmental Prediction (NCEP) and tidal forcing from TPXO8, but updated for the high-resolution bathymetry and coastlines.
- MSEAS-processed atmospheric forcing flux forecasts:
GFS 0.25° August 2018 Daily average wind stress, E-P, heat flux, and SW Radiation (from 0Z forecast each day) Flux snapshot plots (a single 60hr fct issued daily) 9 10 11 12 13 14 15 16 17 18 19 20 21 22 23 24 Forecast snapshot plots (Four 6-hour forecasts/day) 9 10 11 12 13 14 15 16 17 18 19 20 21 22 23 24
- Marine Weather Forecasts:
- HF Radar
HF Radar August 2018 Velocity Snapshots 9 10 11 12 13 14 15 16 17 18 19 20 21 22 23 24 24-hour Average Velocity X X X X X X X X X X X X X X X X - SST Images
- Acknowledgements: We thank the POINT team members for their collaboration, the HYCOM team for their real-time ocean fields, and the NCEP GFS team for their real-time atmospheric flux forecasts (Matthew Pyle, Eric Rogers, Geoff DiMego, and Arun Chawla of NCEP for help and support for atmospheric forcing data). We also thank NOAA for supplying buoy data, the JHU APL for providing processed SST images, and Tamara Holzwarth-Davis and Paula Fratantoni of NOAA for support for ocean historical/climatological data from NMFS. We also thank the Rutgers Center for Ocean Observing Leadership for their AUV data, as well as the WHOI Autonomous Systems Lab (ASL) for their SDOTS WaveGlider data. Finally, we thank the OOI and the NOAA ECOA2 teams for their data.
| Top of page |
Data sources
- Ocean synoptic
- The Global Temperature and Salinity Profile Programme (GTSPP)
- National Data Buoy Center Real-Time & historical data from moored buoy & C-MAN stations
- SST Images
- CFRF - WHOI Shelf Research Fleet (Fishermen data)
- SCRIPPS HF-Radar (HFRnet) THREDDS Server
- HF Radar Coverage Maps
- Ocean historical/climatological
- NOAA/NOS tidal elevation stations
- CO-OPS current station data (historical)
- The Global Temperature and Salinity Profile Programme (GTSPP)
- Data sets & products NOAA National Centers for Environmental Information
- World Ocean Database (WOD)
-
Northeast Fisheries Science Center Ecosystem Processes Division Oceanography Branch
NMFS. Includes data from CTDs, fish hauls, hull-mounted sensors, eMOLT
moorings, drifters, etc.
- Hydrographic Conditions of the Northeast Continental Shelf Northeast Fisheries Science Center Oceanography Branch
- Data/Mapping Interface Northeast Fisheries Science Center, Oceanography Branch
- Atmospheric forcing
- Weather Research and Forecasting (WRF) Model Real-Time Forecasts
- National Centers for Environmental Prediction (NCEP) products:
- High-Resolution Window (HIRESW) (5 km resolution):
- Global Forecast System Model: version 4 (GFS), at 0.5 degree resolution (GFSp5) and also at 0.25 degree resolution (GFSp25)
- The European Centre for Medium-Range Weather Forecasts (ECMWF) ERA Intrim (global Re-Analysis)
- ESSO - Indian National Centre for Ocean Information Services (TropFlux project):
- Coupled Ocean / Atmosphere Mesoscale Prediction System (COAMPS)
- Navy Global Environmental Model (NAVGEM) products:
| Top of page |


